An optimal data partitioning in parallel/distributed implementation of clustering algorithms is a necessary
computation as it ensures independent task completion, fair distribution, less number of affected points and
better & faster merging. Though partitioning using Kd-Tree is being conventionally used in academia, it suffers
from performance drenches and bias (non equal distribution) as dimensionality of data increases and hence is
not suitable for practical use in industry where dimensionality can be of order of 100’s to 1000’s. To address
these issues we propose two new partitioning techniques using existing mathematical models & study their
feasibility, performance (bias and partitioning speed) & possible variants in choosing initial seeds. First method
uses an n-dimensional hashed grid based approach which is based on mapping the points in space to a set of
cubes which hashes the points. Second method uses a tree of voronoi planes where each plane corresponds to a
partition. We found that grid based approach was computationally impractical, while using a tree of voronoi
planes (using scalable K-Means++ initial seeds) drastically outperformed the Kd-tree tree method as
dimensionality increased.
New Approach for K-mean and K-medoids AlgorithmEditor IJCATR
K-means and K-medoids clustering algorithms are widely used for many practical applications. Original k
medoids algorithms select initial centroids and medoids randomly that affect the quality of the resulting clusters and sometimes it
generates unstable and empty clusters which are meaningless.
expensive and requires time proportional to the product of the number of data items, number of clusters and the number of iterations.
The new approach for the k mean algorithm eliminates the deficiency of exiting k mean. It first calculates the initial centro
requirements of users and then gives better, effective and stable cluster. It also takes less execution time because it eliminates
unnecessary distance computation by using previous iteration. The new approach for k
systematically based on initial centroids. It generates stable clusters to improve accuracy.
The method of identifying similar groups of data in a data set is called clustering. Entities in each group are comparatively more similar to entities of that group than those of the other groups.
A Correlative Information-Theoretic Measure for Image SimilarityFarah M. Altufaili
A hybrid measure is proposed for assessing the similarity among gray-scale images. The well-known Structural Similarity Index Measure (SSIM) has been designed using a statistical approach that fails under significant noise (low PSNR). The proposed measure, denoted by SjhCorr2, uses a combination of two parts: the first part is information - theoretic, while the second part is based on 2D correlation. The concept
of symmetric joint histogram is used in the information - heoretic part. The new measure shows the advantages of statistical approaches and information - theoretic approaches. The proposed similarity approach is robust under noise. The new measure outperforms the classical SSIM in detecting image similarity at low PSN.
K-Means clustering uses an iterative procedure which is very much sensitive and dependent upon the initial centroids. The initial centroids in the k-means clustering are chosen randomly, and hence the clustering also changes with respect to the initial centroids. This paper tries to overcome this problem of random selection of centroids and hence change of clusters with a premeditated selection of initial centroids. We have used the iris, abalone and wine data sets to demonstrate that the proposed method of finding the initial centroids and using the centroids in k-means algorithm improves the clustering performance. The clustering also remains the same in every run as the initial centroids are not randomly selected but through premeditated method.
The International Journal of Engineering and Science (The IJES)theijes
The International Journal of Engineering & Science is aimed at providing a platform for researchers, engineers, scientists, or educators to publish their original research results, to exchange new ideas, to disseminate information in innovative designs, engineering experiences and technological skills. It is also the Journal's objective to promote engineering and technology education. All papers submitted to the Journal will be blind peer-reviewed. Only original articles will be published.
IJERA (International journal of Engineering Research and Applications) is International online, ... peer reviewed journal. For more detail or submit your article, please visit www.ijera.com
Here, in this paper we are introducing a dynamic clustering algorithm using fuzzy c-mean clustering algorithm. We will try to process several sets patterns together to find a common structure. The structure is finalized by interchanging prototypes of the given data and by moving the prototypes of the subsequent clusters toward each other. In regular FCM clustering algorithm, fixed numbers of clusters are chosen and those are pre-defined. If, in case, the number of chosen clusters is wrong, then the final result will degrade the purity of the cluster. In our proposed algorithm this drawback will be overcome by using dynamic clustering architecture. Here we will take fixed number of clusters in the beginning but on iterations the algorithm will increase the number of clusters automatically depending on the nature and type of data, which will increase the purity of the result at the end. A detailed clustering algorithm is developed on a basis of the standard FCM method and will be illustrated by means of numeric examples.
Range, quartiles, and interquartile rangeswarna sudha
The IQR describes the middle 50% of values when ordered from lowest to highest. To find the interquartile range (IQR), first find the median (middle value) of the lower and upper half of the data. These values are quartile 1 (Q1) and quartile 3 (Q3). The IQR is the difference between Q3 and Q1.
Template matching is a basic method in image analysis to extract useful information from images. In this
paper, we suggest a new method for pattern matching. Our method transform the template image from two
dimensional image into one dimensional vector. Also all sub-windows (same size of template) in the
reference image will transform into one dimensional vectors. The three similarity measures SAD, SSD, and
Euclidean are used to compute the likeness between template and all sub-windows in the reference image
to find the best match. The experimental results show the superior performance of the proposed method
over the conventional methods on various template of different sizes.
Optimising Data Using K-Means Clustering AlgorithmIJERA Editor
K-means is one of the simplest unsupervised learning algorithms that solve the well known clustering problem. The procedure follows a simple and easy way to classify a given data set through a certain number of clusters (assume k clusters) fixed a priori. The main idea is to define k centroids, one for each cluster. These centroids should be placed in a cunning way because of different location causes different result. So, the better choice is to place them as much as possible far away from each other.
FAST ALGORITHMS FOR UNSUPERVISED LEARNING IN LARGE DATA SETScsandit
The ability to mine and extract useful information automatically, from large datasets, is a
common concern for organizations (having large datasets), over the last few decades. Over the
internet, data is vastly increasing gradually and consequently the capacity to collect and store
very large data is significantly increasing.
Existing clustering algorithms are not always efficient and accurate in solving clustering
problems for large datasets.
However, the development of accurate and fast data classification algorithms for very large
scale datasets is still a challenge. In this paper, various algorithms and techniques especially,
approach using non-smooth optimization formulation of the clustering problem, are proposed
for solving the minimum sum-of-squares clustering problems in very large datasets. This
research also develops accurate and real time L2-DC algorithm based with the incremental
approach to solve the minimum
An Efficient Clustering Method for Aggregation on Data FragmentsIJMER
Clustering is an important step in the process of data analysis with applications to numerous fields. Clustering ensembles, has emerged as a powerful technique for combining different clustering results to obtain a quality cluster. Existing clustering aggregation algorithms are applied directly to large number of data points. The algorithms are inefficient if the number of data points is large. This project defines an efficient approach for clustering aggregation based on data fragments. In fragment-based approach, a data fragment is any subset of the data. To increase the efficiency of the proposed approach, the clustering aggregation can be performed directly on data fragments under comparison measure and normalized mutual information measures for clustering aggregation, enhanced clustering aggregation algorithms are described. To show the minimal computational complexity. (Agglomerative, Furthest, and Local Search); nevertheless, which increases the accuracy.
Parallel Implementation of K Means Clustering on CUDAprithan
K-Means clustering is a popular clustering algorithm in data mining. Clustering large data sets can be
time consuming, and in an attempt to minimize this time, our project is a parallel implementation of KMeans
clustering algorithm on CUDA using C. We present the performance analysis and implementation
of our approach to parallelizing K-Means clustering.
Scalable and efficient cluster based framework for multidimensional indexingeSAT Journals
Abstract Indexing high dimensional data has its utility in many real world applications. Especially the information retrieval process is dramatically improved. The existing techniques could overcome the problem of “Curse of Dimensionality” of high dimensional data sets by using a technique known as Vector Approximation-File which resulted in sub-optimal performance. When compared with VA-File clustering results in more compact data set as it uses inter-dimensional correlations. However, pruning of unwanted clusters is important. The existing pruning techniques are based on bounding rectangles, bounding hyper spheres have problems in NN search. To overcome this problem Ramaswamy and Rose proposed an approach known as adaptive cluster distance bounding for high dimensional indexing which also includes an efficient spatial filtering. In this paper we implement this high-dimensional indexing approach. We built a prototype application to for proof of concept. Experimental results are encouraging and the prototype can be used in real time applications. Index Terms–Clustering, high dimensional indexing, similarity measures, and multimedia databases
IJRET : International Journal of Research in Engineering and Technology is an international peer reviewed, online journal published by eSAT Publishing House for the enhancement of research in various disciplines of Engineering and Technology. The aim and scope of the journal is to provide an academic medium and an important reference for the advancement and dissemination of research results that support high-level learning, teaching and research in the fields of Engineering and Technology. We bring together Scientists, Academician, Field Engineers, Scholars and Students of related fields of Engineering and Technology.
In recent machine learning community, there is a trend of constructing a linear logarithm version of
nonlinear version through the ‘kernel method’ for example kernel principal component analysis, kernel
fisher discriminant analysis, support Vector Machines (SVMs), and the current kernel clustering
algorithms. Typically, in unsupervised methods of clustering algorithms utilizing kernel method, a
nonlinear mapping is operated initially in order to map the data into a much higher space feature, and then
clustering is executed. A hitch of these kernel clustering algorithms is that the clustering prototype resides
in increased features specs of dimensions and therefore lack intuitive and clear descriptions without
utilizing added approximation of projection from the specs to the data as executed in the literature
presented. This paper aims to utilize the ‘kernel method’, a novel clustering algorithm, founded on the
conventional fuzzy clustering algorithm (FCM) is anticipated and known as kernel fuzzy c-means algorithm
(KFCM). This method embraces a novel kernel-induced metric in the space of data in order to interchange
the novel Euclidean matric norm in cluster prototype and fuzzy clustering algorithm still reside in the space
of data so that the results of clustering could be interpreted and reformulated in the spaces which are
original. This property is used for clustering incomplete data. Execution on supposed data illustrate that
KFCM has improved performance of clustering and stout as compare to other transformations of FCM for
clustering incomplete data.
Predicting rainfall using ensemble of ensemblesVarad Meru
The Paper was done in a group of three for the class project of CS 273: Introduction to Machine Learning at UC Irvine. The group members were Prolok Sundaresan, Varad Meru, and Prateek Jain.
Regression is an approach for modeling the relationship between data X and the dependent variable y. In this report, we present our experiments with multiple approaches, ranging from Ensemble of Learning to Deep Learning Networks on the weather modeling data to predict the rainfall. The competition was held on the online data science competition portal ‘Kaggle’. The results for weighted ensemble of learners gave us a top-10 ranking, with the testing root-mean-squared error being 0.5878.
A Dependent Set Based Approach for Large Graph AnalysisEditor IJCATR
Now a day’s social or computer networks produced graphs of thousands of nodes & millions of edges. Such Large graphs
are used to store and represent information. As it is a complex data structure it requires extra processing. Partitioning or clustering
methods are used to decompose a large graph. In this paper dependent set based graph partitioning approach is proposed which
decomposes a large graph into sub graphs. It creates uniform partitions with very few edge cuts. It also prevents the loss of
information. The work also focuses on an approach that handles dynamic updation in a large graph and represents a large graph in
abstract form.
k-Means is a rather simple but well known algorithms for grouping objects, clustering. Again all objects need to be represented as a set of numerical features. In addition the user has to specify the number of groups (referred to as k) he wishes to identify. Each object can be thought of as being represented by some feature vector in an n dimensional space, n being the number of all features used to describe the objects to cluster. The algorithm then randomly chooses k points in that vector space, these point serve as the initial centers of the clusters. Afterwards all objects are each assigned to center they are closest to. Usually the distance measure is chosen by the user and determined by the learning task. After that, for each cluster a new center is computed by averaging the feature vectors of all objects assigned to it. The process of assigning objects and recomputing centers is repeated until the process converges. The algorithm can be proven to converge after a finite number of iterations. Several tweaks concerning distance measure, initial center choice and computation of new average centers have been explored, as well as the estimation of the number of clusters k. Yet the main principle always remains the same. In this project we will discuss about K-means clustering algorithm, implementation and its application to the problem of unsupervised learning
ABSTRACT: In the field of computer science known as "machine learning," a computer makes predictions about
the tasks it will perform next by examining the data that has been given to it. The computer can access data via
interacting with the environment or by using digitalized training sets. In contrast to static programming
algorithms, which require explicit human guidance, machine learning algorithms may learn from data and
generate predictions on their own. Various supervised and unsupervised strategies, including rule-based
techniques, logic-based techniques, instance-based techniques, and stochastic techniques, have been presented in
order to solve problems. Our paper's main goal is to present a comprehensive comparison of various cutting-edge
supervised machine learning techniques.
Similar to An Efficient Method of Partitioning High Volumes of Multidimensional Data for Parallel Clustering Algorithms (20)
Using recycled concrete aggregates (RCA) for pavements is crucial to achieving sustainability. Implementing RCA for new pavement can minimize carbon footprint, conserve natural resources, reduce harmful emissions, and lower life cycle costs. Compared to natural aggregate (NA), RCA pavement has fewer comprehensive studies and sustainability assessments.
Cosmetic shop management system project report.pdfKamal Acharya
Buying new cosmetic products is difficult. It can even be scary for those who have sensitive skin and are prone to skin trouble. The information needed to alleviate this problem is on the back of each product, but it's thought to interpret those ingredient lists unless you have a background in chemistry.
Instead of buying and hoping for the best, we can use data science to help us predict which products may be good fits for us. It includes various function programs to do the above mentioned tasks.
Data file handling has been effectively used in the program.
The automated cosmetic shop management system should deal with the automation of general workflow and administration process of the shop. The main processes of the system focus on customer's request where the system is able to search the most appropriate products and deliver it to the customers. It should help the employees to quickly identify the list of cosmetic product that have reached the minimum quantity and also keep a track of expired date for each cosmetic product. It should help the employees to find the rack number in which the product is placed.It is also Faster and more efficient way.
6th International Conference on Machine Learning & Applications (CMLA 2024)ClaraZara1
6th International Conference on Machine Learning & Applications (CMLA 2024) will provide an excellent international forum for sharing knowledge and results in theory, methodology and applications of on Machine Learning & Applications.
KuberTENes Birthday Bash Guadalajara - K8sGPT first impressionsVictor Morales
K8sGPT is a tool that analyzes and diagnoses Kubernetes clusters. This presentation was used to share the requirements and dependencies to deploy K8sGPT in a local environment.
Sachpazis:Terzaghi Bearing Capacity Estimation in simple terms with Calculati...Dr.Costas Sachpazis
Terzaghi's soil bearing capacity theory, developed by Karl Terzaghi, is a fundamental principle in geotechnical engineering used to determine the bearing capacity of shallow foundations. This theory provides a method to calculate the ultimate bearing capacity of soil, which is the maximum load per unit area that the soil can support without undergoing shear failure. The Calculation HTML Code included.
Welcome to WIPAC Monthly the magazine brought to you by the LinkedIn Group Water Industry Process Automation & Control.
In this month's edition, along with this month's industry news to celebrate the 13 years since the group was created we have articles including
A case study of the used of Advanced Process Control at the Wastewater Treatment works at Lleida in Spain
A look back on an article on smart wastewater networks in order to see how the industry has measured up in the interim around the adoption of Digital Transformation in the Water Industry.
Harnessing WebAssembly for Real-time Stateless Streaming PipelinesChristina Lin
Traditionally, dealing with real-time data pipelines has involved significant overhead, even for straightforward tasks like data transformation or masking. However, in this talk, we’ll venture into the dynamic realm of WebAssembly (WASM) and discover how it can revolutionize the creation of stateless streaming pipelines within a Kafka (Redpanda) broker. These pipelines are adept at managing low-latency, high-data-volume scenarios.
HEAP SORT ILLUSTRATED WITH HEAPIFY, BUILD HEAP FOR DYNAMIC ARRAYS.
Heap sort is a comparison-based sorting technique based on Binary Heap data structure. It is similar to the selection sort where we first find the minimum element and place the minimum element at the beginning. Repeat the same process for the remaining elements.
Hierarchical Digital Twin of a Naval Power SystemKerry Sado
A hierarchical digital twin of a Naval DC power system has been developed and experimentally verified. Similar to other state-of-the-art digital twins, this technology creates a digital replica of the physical system executed in real-time or faster, which can modify hardware controls. However, its advantage stems from distributing computational efforts by utilizing a hierarchical structure composed of lower-level digital twin blocks and a higher-level system digital twin. Each digital twin block is associated with a physical subsystem of the hardware and communicates with a singular system digital twin, which creates a system-level response. By extracting information from each level of the hierarchy, power system controls of the hardware were reconfigured autonomously. This hierarchical digital twin development offers several advantages over other digital twins, particularly in the field of naval power systems. The hierarchical structure allows for greater computational efficiency and scalability while the ability to autonomously reconfigure hardware controls offers increased flexibility and responsiveness. The hierarchical decomposition and models utilized were well aligned with the physical twin, as indicated by the maximum deviations between the developed digital twin hierarchy and the hardware.
NUMERICAL SIMULATIONS OF HEAT AND MASS TRANSFER IN CONDENSING HEAT EXCHANGERS...ssuser7dcef0
Power plants release a large amount of water vapor into the
atmosphere through the stack. The flue gas can be a potential
source for obtaining much needed cooling water for a power
plant. If a power plant could recover and reuse a portion of this
moisture, it could reduce its total cooling water intake
requirement. One of the most practical way to recover water
from flue gas is to use a condensing heat exchanger. The power
plant could also recover latent heat due to condensation as well
as sensible heat due to lowering the flue gas exit temperature.
Additionally, harmful acids released from the stack can be
reduced in a condensing heat exchanger by acid condensation. reduced in a condensing heat exchanger by acid condensation.
Condensation of vapors in flue gas is a complicated
phenomenon since heat and mass transfer of water vapor and
various acids simultaneously occur in the presence of noncondensable
gases such as nitrogen and oxygen. Design of a
condenser depends on the knowledge and understanding of the
heat and mass transfer processes. A computer program for
numerical simulations of water (H2O) and sulfuric acid (H2SO4)
condensation in a flue gas condensing heat exchanger was
developed using MATLAB. Governing equations based on
mass and energy balances for the system were derived to
predict variables such as flue gas exit temperature, cooling
water outlet temperature, mole fraction and condensation rates
of water and sulfuric acid vapors. The equations were solved
using an iterative solution technique with calculations of heat
and mass transfer coefficients and physical properties.
Saudi Arabia stands as a titan in the global energy landscape, renowned for its abundant oil and gas resources. It's the largest exporter of petroleum and holds some of the world's most significant reserves. Let's delve into the top 10 oil and gas projects shaping Saudi Arabia's energy future in 2024.
We have compiled the most important slides from each speaker's presentation. This year’s compilation, available for free, captures the key insights and contributions shared during the DfMAy 2024 conference.
Industrial Training at Shahjalal Fertilizer Company Limited (SFCL)MdTanvirMahtab2
This presentation is about the working procedure of Shahjalal Fertilizer Company Limited (SFCL). A Govt. owned Company of Bangladesh Chemical Industries Corporation under Ministry of Industries.
Industrial Training at Shahjalal Fertilizer Company Limited (SFCL)
An Efficient Method of Partitioning High Volumes of Multidimensional Data for Parallel Clustering Algorithms
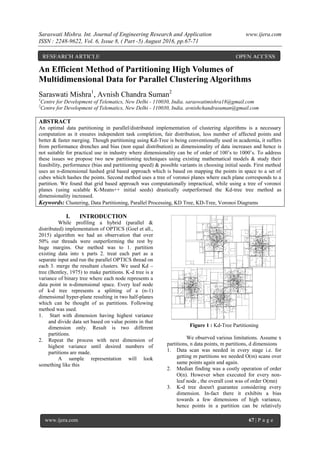
1. Saraswati Mishra. Int. Journal of Engineering Research and Application www.ijera.com
ISSN : 2248-9622, Vol. 6, Issue 8, ( Part -5) August 2016, pp.67-71
www.ijera.com 67 | P a g e
An Efficient Method of Partitioning High Volumes of
Multidimensional Data for Parallel Clustering Algorithms
Saraswati Mishra1
, Avnish Chandra Suman2
1
Centre for Development of Telematics, New Delhi - 110030, India. saraswatimishra18@gmail.com
2
Centre for Development of Telematics, New Delhi - 110030, India. avnishchandrasuman@gmail.com
ABSTRACT
An optimal data partitioning in parallel/distributed implementation of clustering algorithms is a necessary
computation as it ensures independent task completion, fair distribution, less number of affected points and
better & faster merging. Though partitioning using Kd-Tree is being conventionally used in academia, it suffers
from performance drenches and bias (non equal distribution) as dimensionality of data increases and hence is
not suitable for practical use in industry where dimensionality can be of order of 100’s to 1000’s. To address
these issues we propose two new partitioning techniques using existing mathematical models & study their
feasibility, performance (bias and partitioning speed) & possible variants in choosing initial seeds. First method
uses an n-dimensional hashed grid based approach which is based on mapping the points in space to a set of
cubes which hashes the points. Second method uses a tree of voronoi planes where each plane corresponds to a
partition. We found that grid based approach was computationally impractical, while using a tree of voronoi
planes (using scalable K-Means++ initial seeds) drastically outperformed the Kd-tree tree method as
dimensionality increased.
Keywords: Clustering, Data Partitioning, Parallel Processing, KD Tree, KD-Tree, Voronoi Diagrams
I. INTRODUCTION
While profiling a hybrid (parallel &
distributed) implementation of OPTICS (Goel et all.,
2015) algorithm we had an observation that over
50% our threads were outperforming the rest by
huge margins. Our method was to 1. partition
existing data into x parts 2. treat each part as a
separate input and run the parallel OPTICS thread on
each 3. merge the resultant clusters. We used Kd –
tree (Bentley, 1975) to make partitions. K-d tree is a
variance of binary tree where each node represents a
data point in n-dimensional space. Every leaf node
of k-d tree represents a splitting of a (n-1)
dimensional hyper-plane resulting in two half-planes
which can be thought of as partitions. Following
method was used.
1. Start with dimension having highest variance
and divide data set based on value points in that
dimension only. Result is two different
partitions.
2. Repeat the process with next dimension of
highest variance until desired numbers of
partitions are made.
A sample representation will look
something like this
Figure 1 : Kd-Tree Partitioning
We observed various limitations. Assume x
partitions, n data points, m partitions, d dimensions
1. Data scan was needed in every stage i.e. for
getting m partitions we needed O(m) scans over
same points again and again.
2. Median finding was a costly operation of order
O(n). However when executed for every non-
leaf node , the overall cost was of order O(mn)
3. K-d tree doesn't guarantee considering every
dimension. In-fact there it exhibits a bias
towards a few dimensions of high variance,
hence points in a partition can be relatively
RESEARCH ARTICLE OPEN ACCESS
2. Saraswati Mishra. Int. Journal of Engineering Research and Application www.ijera.com
ISSN : 2248-9622, Vol. 6, Issue 8, ( Part -5) August 2016, pp.67-71
www.ijera.com 68 | P a g e
far than points in different dimensions for a
large d. This will lead to a poor clustering result.
Also as the number of dimensions tend to
increase, the performance of k-d tree with
regards to bias decreases.
4. Partitions are half planes. They have a general
tendency to result in more number of affected
points in uniformly or near-uniformly
distributed space.
5. No inherent merging structure. A merging
strategy needs to be implemented
The most concerning of these at that time
for us was 1 & 2 as they were highly serial and slow
part of our parallel implementation. We wanted to
optimize the multiple passes over data to as few as
possible. Also we wanted a better way of finding
median or near median. In next section we will see
how we tried solving 1 & 2 by splitting our d-
dimensional space into d-cubes such that in a single
pass we determine the points in every cube & their
cardinality and other computations which improves
median finding performance significantly. However
we soon realized the impractical aspects of our
approach and it inherently lacking the solutions to 3,
4 & 5. We moved on to next approach where we
partition our space using n-dimensional voronoi
diagrams and found it to be extraordinarily
outperforming kd-tree with proper initial seeds.
II. N-CUBE BASED APPROACH
The proposed partitioning approach works
by initially dividing the n-dimensional space into n-
Cubes by making y splits along each dimension so
that we obtain (y+1)n
cubes.
The basic idea here is to create an overall
index (a summary in space based on cubes) such that
for any partitioning computation, we only need to
use this summary and not the entire data. n-Cubes
work as following
Algorithm: Construct Cubes
Input: Set of x points p in space (p1,p2...px) where
each px is (x1,x2..xn).
Number of partitions m
k: a natural number 1<=k
#higher values for k ensures better overall
distribution but lower performance.
Output: Set of Cubes (c1, c2 …. cm )
Where m = (y+1)n
Procedure:
# Finding an optimal y & initializing cube
boundaries
Let minxn be min (px) in nth
dimension
Let maxxn be max (px) in nth
dimension
Let Y = ky. Let M = (Y+1)n
for each ci in (c1..cM)
Boundary(cMn) =
{(i-1)*(maxn-minn)/M , i*(maxn-minn)/M}
Binary sort c
For each pi in (p1...px)
Find pi’s location in p.
Add pi to cM
cM.totalPonits++
Algorithm: Find Median
Input : Set of Cubes (c1...cM), Total Points
Output : Median along a dimension n say mn
Procedure :
P : total points in space
X=0;
While X<P/2
Move to next cube , x = x+Cm.totalPoints
#We stop at the cube that contains our median (or a
close approximation if k is too low or too high)
Find median of set of points in Cm.
We can see that cube creation is an
O(n+logn) task while median creation is an O(n/M)
task which looks very efficient . The approach
should have worked in two passes over data plus a
single pass on grid cells. However there were major
design & implementation issues with this approach
1. The number of cubes is (y+1)n
. Even if y is 2,
for a huge n, we get 2n
cells. This grows closer
to total number of data points.
2. Programmatically unfeasible in direct sense.
Accessing n-dimensional arrays needs n loops,
we don’t know n beforehand. Solution is to
convert n-d cells to 1-d (resulting in very long
1-d array). Unable to allocate memory on stack
for the 1-d array.
3. Too many cells, sparse cells, data distribution
across cells not uniform at all.
4. Most of the partitions will be empty, even when
the number of data points N is large, leading to
extreme waste of memory and CPU time.
5. Hence we conclude that the method was not
Suitable for > 2d data
6. Didn’t solve problem of bias but tends to
worsen it with a higher cubes number
III. VORONOI DIAGRAM BASED
PARTITIONING
Our second approach involves voronoi
diagrams (Aurenhammer,1991). Our goal is to
construct a partitioning scheme that handles high-
dimensionality as well and not just provide good
performance by ignoring a lot of dimensions. It is
also necessary that partitions should not hold too
many or too few points. Number of passes on data
should be as less as possible preferably ~1.
An efficient way to satisfy problem 1 & 2
of kd-tree is a tree structure that needs O(log n)
number of comparisons on average to distribute a
3. Saraswati Mishra. Int. Journal of Engineering Research and Application www.ijera.com
ISSN : 2248-9622, Vol. 6, Issue 8, ( Part -5) August 2016, pp.67-71
www.ijera.com 69 | P a g e
point and to determine the affected partitions where
n is the number of nodes in the tree. One way to
satisfy problem of considering all dimensions all
together is to use a Voronoi diagram which
partitions the space into Voronoi cells, directed by a
set of split points Q = q1, q2, . . . such that for each
cell corresponding to split point qi, the points x in
that cell are nearer to qi than to any other split point
in Q. Hence, by constructing a tree of Voronoi
diagrams, we can satisfy our two major concerns.
Let’s call such a structure as v_tree. The
top or root node of a v_tree gives a brief summary of
the whole data and is split to many Voronoi cells
which are split as well and so on.
Figure 2: A voronoi diagram depicted in two
dimensions
Construction of v_tree
At each level, find k (2) centre
1. Points must be appropriately spaced and far
2. Use scalable kmeans++ (Bahmani et all., 2012)
or gnat technique (Brin ,1995)
3. Assign all points to either centre based on
distance
4. All points that lie in current to current + eps
boundary (Goel et all., 2015) are considered
affected.
5. Delete extra points stored in parent node to
remove redundancy
Repeat for new sets until requisite number of
partitions found.
Data Structure
A minimal n-voronoi-tree implementation data
structure in c will look like this.
typedef struct member {
int id;
float *val;
} member;
struct v_node {
int level;
int core1,core2;
member *mem1,*mem2,*mem_overlap;
struct v_node *left,*right;
int count_mem1,count_mem2, count_overlap,
total_count;
}
struct v_tree {
int levels;
struct node *head;
}
Head node is the summary of Entire Data.
Each parent node contains summary of points in
child nodes. The exact points are stored until data is
partitioned at level & deleted as soon as we move to
next level.
Note that v_tree might not necessarily be
binary. More than two centres can be chosen.
The leaf nodes are our final partitions, and
going up the tree inherently makes a merging
structure for resultant clusters. Load in each partition
will depend upon the center chosen and distribution
of data in n-dimensional space.
How to choose initial seeds?
1. Select randomly: Choosing centre randomly
doesn’t guarantee or breach anything and
simply leaves thing to the centre chosen and
distribution of data. There is equal probability
of getting each load distribution. Hence the
probability of getting a perfect load balance
tends to zero.
2. GNAT Approach: Suppose we need n seeds.
We start by selecting a point at random. The
next point is chosen such that its distance from
first point is maximum, the third point is chosen
such that its distance from sum of previous two
points is maximum. Similarly forth point should
be the point farthest from sum of first three
points and so on. This approach is good in terms
of load balancing for a big value of n, but
cannot guarantee good balance for small n (~2-
5).
3. Scalable K-Means++ Approach: Suppose k
centre are needed, C be the set of initial seeds,
then
a. Sample a point uniformly at random from the
data points.
b. For each data point p, compute it’s distance
from nearest centre.
c. Choose a m point p using Weighted probability
distribution where a point p is chosen with
probability proportional to D(p)2. Assume it be
new centre
d. If you have k centres, proceed with partitioning,
else repeat 2 & 3
The centres that we get tend to be close to
the centroids of clusters present in data, assuming
there are k-clusters. Load distribution is entirely
dependent on the data; however we can be optimistic
about not getting very biased distribution with real-
life datasets.
4. Saraswati Mishra. Int. Journal of Engineering Research and Application www.ijera.com
ISSN : 2248-9622, Vol. 6, Issue 8, ( Part -5) August 2016, pp.67-71
www.ijera.com 70 | P a g e
Such a partitioning hugely tends to reduce
the time spent in merging the final clusters as there
will be minimal affected points.
4. More than 2 centre: can be used in
implementation to satisfy various criteria.
a. All the above approaches (or any random or
probability based approach) will tend to good
balancing as we increase number of centre. This
can be proved mathematically using induction.
We receive a perfect balance when numbers of
points equals number of centre i.e. each point is
a partition.
b. In a case when number of partitions is not in
power of 2.
c. Different number of centre at different level can
be used for perfect guided partitioning.
5. How about Median: Points very close to median
and on same axis as centre will produce exact
partitions (similar to kd-tree), however
complexity sumps up to O (kd-tree) +O
(v_tree).
IV. EXPERIMENTATION & RESULTS
We used following environment to execute
test & profile. Execution Environment: - Ubuntu
13.04, Intel Core i3 (3rd generation), 2.4GHz (2
cores hyper threaded), 4GB RAM, 3MB L2 Cache.
Compilation Environment: - C, gcc, gdb, gprof,
vampir, Geany IDE .Visualization of output was
done using geogebra.
Test Data-sets: (no. of points x no. of
dimensions, double precision data)
1. 100x2,
2. 700x9,
3. 1500x1024,
4. 4000x1024,
5. 40000x1024
Figure 3 : Comparison of v_tree partitioning result
with four partitions
Figure 4: Comparison of v_tree partitioning result
with eight partitions
We noticed an increase in load bias as
number of partitions increase.
Distribution was almost uniform with
uniform data. However we can see that Kd-tree
(right) provides a better distribution with uniformly
distributed data. However this will decrease with
number of dimensions.
Figure 5 : Comparison of uniform data partitioning
(v_tree )
Figure 6 Comparison of uniform data partitioning
(k-d tree)
5. Saraswati Mishra. Int. Journal of Engineering Research and Application www.ijera.com
ISSN : 2248-9622, Vol. 6, Issue 8, ( Part -5) August 2016, pp.67-71
www.ijera.com 71 | P a g e
Performance (in approx ~10sec units)
Data Set
Approach
700*9 1500*
1024
4000*1024 40000*1024
Kd - Tree 0.02 9.88 46.67 512
v_tree
(Scalable
Kmeans++)
0.01 3.05 7.61 73.34
v_tree
(Median)
0.02 9.96 54.43 542
V. CONCLUSION
We have seen that for higher
dimensionality the approach proposed takes very
less time as compared to kd-tree approach; however
v_tree technique needs a load balanced variant to
boast perfect results.
Our future works will include better load
balancing, comparison of merging time and
distribution time, parallelizing the approach and
implementing a grid based alternative.
APPENDIX
Related Code, Data Sets & Results can be requested
from
https://drive.google.com/file/d/0Bxo9wQ432jhla1dQ
NWFrbnM4bnc/view?usp=sharing
REFERENCES
[1]. Poonam Goyal, Sonal Kumari, Dhruv
Kumar, Sundar Balasubramaniam, Navneet
Goyal, Saiyedul Islam, and Jagat Sesh
Challa. 2015. Parallelizing OPTICS for
Commodity Clusters. In Proceedings of the
2015 International Conference on
Distributed Computing and Networking
(ICDCN '15). ACM, New York, NY, USA,
Article 33
[2]. J. L. Bentley. Multidimensional binary
search trees used for associative searching.
Communications of the ACM, 18(9):509-
517, 1975.
[3]. Franz Aurenhammer (1991). Voronoi
Diagrams – A Survey of a Fundamental
Geometric Data Structure. ACM Computing
Surveys, 23(3):345–405, 1991
[4]. B. Bahmani, B. Moseley, A. Vattani, R.
Kumar, S. Vassilvitskii "Scalable K-
means++" 2012 Proceedings of the VLDB
Endowment.
[5]. S. Brin, Near neighbor search in large
metric spaces, in: Proceedings of the
International Conference on Very Large
Databases (VLDB), 1995.