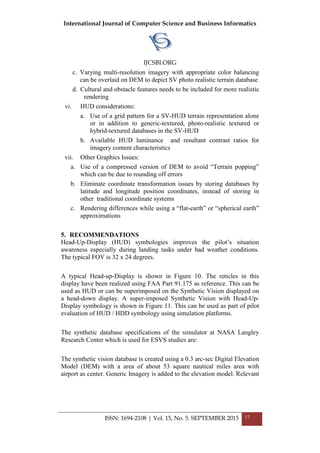
This document provides an overview of synthetic vision systems (SVS), including their components, benefits, and display requirements. A SVS renders a virtual outside view of terrain and obstacles using an onboard terrain database and sensors. This improves situational awareness for pilots in low visibility conditions. The accuracy of the terrain database and sensors is important for integrity. SVS can provide both safety benefits by helping avoid accidents like controlled flight into terrain, as well as operational benefits like increased airspace usage. Standards define requirements for database accuracy and resolution depending on the application and region. SVS utilizes various displays including head-up and head-down formats.


![International Journal of Computer Science and Business Informatics
IJCSBI.ORG
ISSN: 1694-2108 | Vol. 15, No. 5. SEPTEMBER 2015 2
GPS Global Positioning System
HDD Head Down Display
HFOV Horizontal Field of View
HSI Horizontal Situation Indicator
HUD Head Up Display
IESVS Integrated Enhanced and Synthetic Vision System
ILS Instrument Landing System
ISRO Indian Space Research Organisation
LCD Liquid Crystal Diode
LED Light Emitting Diode
LiDAR Light Detection and Ranging
NASA National Aeronautics and Space Agency, USA
NAV Navigation Mode
ND Navigation Display
NDB Non Directional Beacon
NRSA National Remote Sensing Agency, India
PFD Primary Flight Display
RADARRadio Detection and Ranging
RTCA Radio Technical Commission for Aeronautics
SA Situational Awareness
SRTM Shuttle Radar Topography Mission
SVS Synthetic Vision System
TAWS Terrain Awareness Warning System
VFOV Vertical Field of View
VOR Very High Frequency Omni-Directional Radio Range
1. INTRODUCTION
One of the flight accident reasons is Controlled Flight Into Terrain (CFIT).
Here, a pilot continues to fly into bad weather and poor visibility, which can
lead to casualty due to failure of visual horizon. The pilot can fly into
unknown terrain leading to loss of control. As per statistics, over 30% of
flight accidents occur due to CFIT [1]. To overcome the loss of visibility,
avionics systems such as attitude indicators, radio navigation etc has been
introduced. Still, partial visibility is still a significant factor which affects
flight operations even today.](https://image.slidesharecdn.com/vol15no5-september2015-171208072531/85/Vol-15-No-5-September-2015-4-320.jpg)
![International Journal of Computer Science and Business Informatics
IJCSBI.ORG
ISSN: 1694-2108 | Vol. 15, No. 5. SEPTEMBER 2015 3
Enhanced Vision Systems (EVS) and Synthetic Vision Systems (SVS) have
the capability to permit pilots to take advantage of different image sources
available. Data from imaging sensors are fused digitally in an EV system.
This provides a clear view of external world even in impaired visibility
conditions within the cone of visibility of the imaging sensors. SVS renders
the image using a priori database depending on the current pilot view. This
displays terrain and flight path information to the pilot, which is not possible
with EVS. With the technology advancement, it is possible to obtain more
accurate terrain and obstacle data for most part of world. The availability of
low cost 3-D graphics cards facilitates simulation of external world as on a
clear day. The ability of pilot to see in all directions, even in bad weather
conditions provides substantial operational usefulness and safety benefits
[2].
A detailed description of synthetic vision system is presented in Section 2.
The synthetic vision systems that are commercially available are discussed
in Section 3. The requirements for the development of a typical SVS are
presented in Section 4. The recommendations of a typical SVS are provided
in Section 5.
2. SYNTHETIC VISION SYSTEM
According to the definition of SVS by Federal Aviation Administration
(FAA) [3], ―Synthetic Vision (SV) is a computer-generated image of the
external scene topography from the perspective of the flight deck, derived
from aircraft attitude, high-precision navigation solution, and database of
terrain, obstacles, and relevant cultural features‖. NASA added more
information to the SVS by augmenting it with flight display symbologies,
data links and navigation systems [4]. These systems represent the visual
cues as seen by a pilot in broad daylight.
Information from SVS and weather penetrating sensors or actual imagery
from enhanced vision sensors are fused together to form Integrated
Enhanced and Synthetic Vision System (IESVS) [5].
SVS display has the capability to better safety of flight by increasing the
Situational Awareness (SA) of pilot in bad weather conditions similar to
clear daylight weather conditions. Head-Down Display (HDD) and Head-
Up-Displays (HUD) have been used to display attitude information of
aircraft along with a perspective view of synthetic terrain to simulate outside
cockpit view to the pilot. The baseline Head-down Display and SVS Head-
down Displays are shown in Figure 1 and Figure 2 respectively. It is clearly
noticed that SVS HDD conveys better awareness to the pilot. Air traffic and
weather information can also be depicted on these displays. To increase SA
of terrain by pilot, FAA has ordered Terrain Awareness Warning Systems](https://image.slidesharecdn.com/vol15no5-september2015-171208072531/85/Vol-15-No-5-September-2015-5-320.jpg)
![International Journal of Computer Science and Business Informatics
IJCSBI.ORG
ISSN: 1694-2108 | Vol. 15, No. 5. SEPTEMBER 2015 4
(TAWS) to be installed on most aircraft. SVS is developed for applications
from being advisory to flight critical systems but TAWS are purely advisory
in nature. The SVS with terrain data integrity monitoring would aid the pilot
in avoiding CFIT which could be flight critical. As SVS is used to support
decision making depending on terrain depiction, it is essential that terrain
database is certified to flight critical levels.
Figure 1. Baseline Head-Down Display Figure 2. SVS Head-Down Display
Synthetic Vision can be classified as either advisory, strategic or as tactical
applications [6]. Based on the application, SVS can be categorized as non-
essential, essential and critical systems. The integrity levels are calculated as
acceptance of probability of a failure which is not detected. Systems with
undetected failure rate greater than 10-3
(per flight or per flight hour) are
classified as advisory system applications. Systems with probability
between 10-4
and 10-7
are termed as strategic essential applications. For
flight-critical applications, the integrity levels are between 10-6
and 10-9
.
The benefits of SVS are discussed in the following section.
2.1 Benefits of Synthetic Vision System
The safety and operational benefits of a SVS are briefly explained in this
section.
2.1.1 Safety Benefits
A SV system provides a visual representation of outside world resembling
visual flight conditions [7]. This has the potential to warn about loss of
attitude pathway and terrain awareness, traffic and altitude awareness, run
way incursions, spatial disorientation etc, thus reducing loss due accidents.
These benefits are visible during emergency conditions when pilot mental
workload is high. SVS can enhance situation awareness of pilots, thus
reducing his workload.
2.1.2 Operational Benefits
Synthetic vision provides visuals-like gate-to-gate operations irrespective of
weather conditions. This can lead to increase in airspace system capability.
Through a sponsored study, NASA has calculated the cost-benefit analysis](https://image.slidesharecdn.com/vol15no5-september2015-171208072531/85/Vol-15-No-5-September-2015-6-320.jpg)
![International Journal of Computer Science and Business Informatics
IJCSBI.ORG
ISSN: 1694-2108 | Vol. 15, No. 5. SEPTEMBER 2015 5
and proved that airlines can make huge savings on operational costs [7].
These savings are possible, provided other aiding technologies are
developed and the units are to be certified for operational efficiencies
offered by these technologies are to be analyzed further. SVS can provide
operational benefits such as enhanced surface operations, decreased runway
occupancy time during low visibility, reduce inter-arrival separations,
improved path guidance and alerting mechanisms, enhanced flight
management etc. A cost-benefit study conducted by NASA for 10 major US
airports has predicted savings of about $2.25 billion for years 2006 to 2015
for the airliners.
SVS consists of Enhanced intuitive view, Hazard detection and display,
Integrity Check and Alerting and Precision navigation guidance display. As
explained earlier, SVS displays relevant and critical environment features of
out of window visuals using computer generated terrain images even when
weather conditions are inferior. As the pilot will see the display as he sees in
clear day light environment, the display is termed as intuitive. Symbology
can be added to the display to increase pilot’s awareness.
To maintain pilot’s SA and provide terrain and hazard separation, terrain,
traffic, obstacles and other hazards are pictorially displayed. SVS provides
pilot detection, identification, geometry awareness and overall SA which is
not possible by standard avionics displays.
As pilots have to trust the SVS is providing accurate information, integrity
monitoring and alerting needs to be implemented. Here, independent sensors
such as GPS, radar altimeter, enhanced vision sensors can be used to
monitor the integrity function. If a mismatch occurs, the display should
degrade to backup modes and alert the pilot the SV is no longer trustworthy.
Such a monitoring prevents pilot from relying on misleading information.
To use terrain elevation databases in flight critical systems, it is important
that misleading terrain information display should be avoided. Thus a SV
system must have a real-time database monitoring mechanism to reduce
inadvertent display of undetected database errors. Such mechanism can use
wither FWL or DWL sensor information [8]. A downward-looking
monitoring concept is shown in Figure 3. Differential GPS and Radar
Altimeter sensors are used in this architecture. These sensors are used to
generate synthesized and terrain database elevation profiles. These two
terrain profiles are compared statistically. Whenever inconsistency is
noticed between the profiles defined above, an integrity alarm is generated
to alert the pilot. Such alarm indicates the pilot that the synthetic vision
display is not reliable.](https://image.slidesharecdn.com/vol15no5-september2015-171208072531/85/Vol-15-No-5-September-2015-7-320.jpg)
![International Journal of Computer Science and Business Informatics
IJCSBI.ORG
ISSN: 1694-2108 | Vol. 15, No. 5. SEPTEMBER 2015 6
Figure 3. Block Diagram of a Downward Looking Integrity Monitoring
System
SV elements such as surface guidance, tunnels/highways-in-the-sky,
velocity vector etc allow pilot to correlate aircraft position to outside
environment. These elements facilitate pilot to check navigation precision to
meet Required Navigation Performance criteria without depending on land-
based navigation aids. The components which form a SV system are
discussed in next section.
2.2 Synthetic Vision System Components
The components of a SV system are [7]:
- Synthetic Vision Database/Sensors
- Synthetic Vision Displays
- Computers/Embedded Computational Functions
- Equipment
- Associated Aircraft Systems
Database used can be generated statically and carried on-board or can be
generated using Light Detection and Ranging (LIDAR). Sensors such as
Weather Radar, Radar Altimeter, Global Positioning System (GPS) and
other forward looking sensors such as Millimeter wave radar or Infra-Red
Sensors can also be used.
The virtual out-the-window (OTW) view can be generated using accurate,
ortho-rectified satellite imagery, airport details, elevation database and
cultural features. Jeppesen provides the Aerodrome Mapping Database
(AMDB) for most important airports in the world. High resolution terrain
database has become a pre requisite for Low Level Flights, Terrain
-
p (ti)
hDEM(ti)
lonDGPS(ti)
Radar
Altimeter
DGPS
DEM
Database
T
Algorithm
Test Statistic
Algorithm
latDGPS(ti)
hDGPS(ti)
-
hRA(ti)
+
- hSYNT(ti)
+](https://image.slidesharecdn.com/vol15no5-september2015-171208072531/85/Vol-15-No-5-September-2015-8-320.jpg)
![International Journal of Computer Science and Business Informatics
IJCSBI.ORG
ISSN: 1694-2108 | Vol. 15, No. 5. SEPTEMBER 2015 7
Following and Terrain Avoidance under Instrument Meteorological
Conditions. Highly accurate SRTM terrain database is suitable for aviation
use. The SRTM terrain database with 3-arc sec resolution is available in
public domain. National Remote Sensing Agency (NRSA) has released
CartoDEM data with accuracy of 3-arc second for Indian sub-continent
region in public domain [9]. LiDAR system can be used to generate terrain
databases. A LiDAR system has a scanning laser ranger, an Inertial
Measurement Unit and a GPS receiver. The principle of LiDAR is similar to
that of RADAR. Information from above sensors can be used to create
synthesized terrain profiles. The precision of measurements can be as high
as up to 20 centimeters. [10].
RTCA / DO-272 defines the accuracy and resolution specifications of a
airport for a SV system [11]. The data requirements for an airport and
obstacle data is indicated in Table 1. The accuracy is categorized as Fine,
Medium or Coarse. The data accuracy of aerodrome shall meet the
confidence level of 95% for Fine and 90% for Medium or Coarse quality
categories.
Table 1. Accuracy and Resolution requirements of Obstacle Data as per RTCA
Region Area 1
The World
Area 2
Terminal
Airspace
Area 3 –
Cat II/III
Operation
Area
Horizontal Accuracy 50 m 5.0 m 2.5 m
Vertical Accuracy 30 m 3.0 m 1.0 m
Vertical Resolution 1.0 m 0.1 m 0.1 m
Data Integrity 10-3
10-5
10-5
Confidence Level 90% 90% 90%
Terrain database Post
Spacing
3 arc second
(~90 m)
1.0 arc second
(~30 m)
0.3 arc second
(~10 m)
The accuracy and resolution requirements of terrain data for world, terminal
area and airport are defined in Table 2. The mapping of different areas such
as World, Terminal Space and Aerodrome Mapping Area is shown in Figure
4. Different types of synthetic vision displays are described in next section.](https://image.slidesharecdn.com/vol15no5-september2015-171208072531/85/Vol-15-No-5-September-2015-9-320.jpg)
![International Journal of Computer Science and Business Informatics
IJCSBI.ORG
ISSN: 1694-2108 | Vol. 15, No. 5. SEPTEMBER 2015 8
2.3 Synthetic Vision Displays
The different types of Synthetic Vision Displays [7] are,
- Head-Up / Helmet Mounted Display
- Primary Flight Display / Head Down Display
- Navigation Display
Table 2. Accuracy and Resolution requirements of Terrain Data
Region Area 1
The
World
Area 2
Terminal
Airspace
Area 3
CAT II/III
Operations
Airport
Surface
Horizontal
Accuracy
50 m
(90%)
5 m
(90%)
2.5 m 0.5 m
(95%)
Vertical
Accuracy
30 m
(90%)
3 m
(90%)
1 m 0.5 m
(95%)
Post Spacing
Integrity
3 arc-sec
10-3
1 arc-sec
10-5
1 arc-sec
10-5
20 m
10-5
2.3.1 Head-Up-Display / Helmet Mounted Displays
The Head-Up-Display (HUD) is used to improve position awareness and
guidance during flight [12]. This is a see-through display projected onto the
wind shield of the aircraft. Many important aircraft parameters such as air
speed, velocity vector, rate of climb, aircraft attitude and position are
projected on the HUD for quick reference to the pilot.
The HUD can be of two types – Fixed HUD or Helmet Mounted Displays
(HMD) [12]. In a fixed HUD setup, the pilot looks through the display
element attached to the aircraft. Helmet mounted displays (HMD) are
displays where the image is projected on small display optic mounted in
front of the eyes of pilot. The orientation of the pilot’s head is used to move
the display elements.](https://image.slidesharecdn.com/vol15no5-september2015-171208072531/85/Vol-15-No-5-September-2015-10-320.jpg)
![International Journal of Computer Science and Business Informatics
IJCSBI.ORG
ISSN: 1694-2108 | Vol. 15, No. 5. SEPTEMBER 2015 9
Figure 4. Areas of Coverage
Development of HUD technology can be categorized into four generations
[12]. In the first generation, CRT technology was used to generate display
image. This used phosphor screen which used to degrade over time. In the
second generation HUDs, solid state light source such as LEDs are used to
display the symbology. The advantage of this technology is that the symbols
do not fade over time. This technology is adapted in commercial airliners.
Optical wave guides are used to produce images in the combiner in third
generation series. Scanning laser technology is used to display images in
fourth generation HUDs.
Various factors to be considered during design of a HUD are field of view,
eye box, luminance/contrast ratio, display accuracy and ease of integration
to existing aircraft systems. FOV can be defined as Total FOV,
Instantaneous FOV, Binocular FOV or Monocular FOV [13]. In this paper,
FOV means Total FOV defined by Horizontal and Vertical FOV.
Figure 5 shows a generic HUD symbology set [14].
FAA has recommended HUD symbologies for Enhanced Flight Vision
System in FAA Part No 91.175. The recommended symbols are Airspeed,
Altitude, Horizon bar, Heading, Bank and Side Slip markers, Flight Path
Markers or Velocity Vector, Glideslope and Localiser raw data path
deviation indicators and Guidance information such as horizontal and
vertical ball guidance cues.
Area 1
(World)
Area 2
(Terminal Airspace)
Area 3
(CAT II or III Operation Area)
Aerodrome Mapping Area](https://image.slidesharecdn.com/vol15no5-september2015-171208072531/85/Vol-15-No-5-September-2015-11-320.jpg)
![International Journal of Computer Science and Business Informatics
IJCSBI.ORG
ISSN: 1694-2108 | Vol. 15, No. 5. SEPTEMBER 2015 10
A generic SVS HUD symbology is shown in Figure 6. The HUD should
have haloing effect so that the symbology is highlighted with scene imagery
as background. The physical characteristics of the required dynamic range
and the grey level resolution required must be considered during design of a
HUD system [15]. Field trials were conducted by Advanced 3D Primary
Flight Display System on Honeywell Citation V aircraft to identify the field
of view (FOV) required for the HUD. For terminal operations, the preferred
HFOV is about 45 degrees and 60 degree HFOV for en-route operations for
generic HUD [16].
For SVS operations, NASA has recommended Head-Up Display FOV of 32
x 24 degrees in raster format is preferred [15]. As mentioned earlier, to
highlight the symbology against scene imagery, ―haloing‖ effect is
necessary. Overall HUD brightness and controls are to be provided for the
pilot. The pilot can be provided with a de-clutter control switch.
Figure 5. Generic Head-Up-Display Symbology set
Pilot trials were conducted by NASA to find out appropriate display sizes
and FOV for HUD and HDD SVS displays [17]. It was found that the path
performance of pilots does not vary with display size of HDD.
A experimental size of 22 degrees VFOV by 28 degrees HFOV was set to
maintain conformality with outside world. Pilots were provided options to
control the FOV size such as unity (as defined above), 30, 60 and 90
degrees. FOV was varied depending on size of experimental HDD chosen. It
was concluded that although SVS improves the SA, there were no](https://image.slidesharecdn.com/vol15no5-september2015-171208072531/85/Vol-15-No-5-September-2015-12-320.jpg)
![International Journal of Computer Science and Business Informatics
IJCSBI.ORG
ISSN: 1694-2108 | Vol. 15, No. 5. SEPTEMBER 2015 11
significant differences among SVS concepts. The study recommended a
variable FOV depending on the phase of flight [4].
Figure 6. Generic SVS Head Up Display
Another study was conducted by NASA on retro-fitting HUD displays to
non-glass cockpit aircraft. A SVS retro-fit was recommended along with
existing head-down PFD. A SVS Navigational Display has been suggested
to replace the existing HSI display [4]. The most important symbol
integrated into SVS PFD and SVS HUD is the velocity vector. Along with
this, the pathway or the highway symbology, explained below provides the
pilot an awareness of current and future spatial situation.
2.3.2 Head Up Display Hardware
In Aircraft, HUD symbologies are realized by specialized hardware. ARINC
764 is the technical standard for HUD avionics [18]. This standard describes
the physical form factors, dimensions, interface definitions and functionality
of HUD. Two areas of focus are integration of Enhanced Vision System
(EVS) and Synthetic Vision System functionality to HUD and develop
alternatives to CRT image projection system for use in smaller aircraft.
Initial displays were built with CRT projection to the combiner glass. Later
this was replaced with LCD image source which provides a wider field of
view. Airbus (A340-600), Boeing (B787) and Embraer (ERJ 190) aircraft
have used LCD images source displays for HUD implementation.
Honeywell’s HUD2020 equipment displays both HUD symbologies and
EVS display [19].](https://image.slidesharecdn.com/vol15no5-september2015-171208072531/85/Vol-15-No-5-September-2015-13-320.jpg)
![International Journal of Computer Science and Business Informatics
IJCSBI.ORG
ISSN: 1694-2108 | Vol. 15, No. 5. SEPTEMBER 2015 12
2.3.3 Additional SVS Head Down Display Symbologies
To aid the pilot, more symbologies have been evolved by research. Some of
the symbologies researched were Flight Path Marker, Flight Director
Guidance Markers, Pathway/Highway/Tunnel Marker and Pitch Ladder.
The Flight Director Guidance and Tunnel markers are discussed in this
section.
The guidance markers explored were the integrated cue circle (―ball‖) used
in several HUDs, a ―follow me‖ aircraft concept (―ghost‖), and a ―tadpole‖
guidance symbol [4]. The tadpole symbology has been implemented in F-16
military aircraft HUD. It was found there were no statistically detectable
differences between the symbols, although pilots favored tadpole symbol
and the ghost airplane symbol over the ball guidance symbol. The ghost
airplane symbol was preferred over the tadpole symbol due to the
anticipatory information provided by the symbol. Each of these symbols is
shown in Figure 7.
Figure 7. Guidance symbols: Integrated cue “Ball” (left), “Tadpole” (center) and
Ghost aircraft
Tunnel-in-the-Sky, also known as Pathway-in-the-Sky or Highway-in-the-
Sky which displays the predicted aircraft position is another important area
of research [20]. As per definition of FAA Advisory Circular 23-26 [20],
―The pathway symbology provides a pictorial representation of the
navigation path to pilots using a perspective view in the airspace‖. This
symbology provides a three dimensional navigation path to the pilots. This
enhances the visual information of the pilot by providing status and
command information about current and flight situation in future. This
symbology displays a rectangular tube geometry depicting vertical and
lateral flight path trajectory in wire frame as shown in Figure 8 [22]. The
Crow’s foot symbology was evolved from this rectangle tunnel to minimize
clutter by using truncated short segments at corners of rectangles, creating a
crow’s foot. A typical crow’s foot symbol is shown in Figure 9. Instead of
displaying the tunnel as series if rectangles, the corners are displayed using
crow’s foot symbol.](https://image.slidesharecdn.com/vol15no5-september2015-171208072531/85/Vol-15-No-5-September-2015-14-320.jpg)
![International Journal of Computer Science and Business Informatics
IJCSBI.ORG
ISSN: 1694-2108 | Vol. 15, No. 5. SEPTEMBER 2015 13
Pilots have evaluated four tunnel concepts – Box, Minimal, Dynamic
Crow’s foot and Dynamic Pathway along with no tunnel display [23]. Box
tunnel, as defined before, consists of a series of boxes with the corners
connected, which forms the boundary path likely to be flown by the pilot.
The tunnel displayed can be of length of 10nm with five segments per
nautical mile. Five segments of tunnel per nautical mile are displayed for a
distance of three nautical miles. The symbology fades away to invisibility
gradually. Pilots get a feedback about the aircraft position with respect to
the tunnel. The tunnel walls grow on increase of path error which helps pilot
gauge the deviation. In this concept, when the aircraft flies outside the
tunnel, the tunnel opens up on the side where the aircraft leaves the tunnel
indicating the pilot to fly into the tunnel. The pilots were found to prefer
dynamic crow’s feet over other symbologies [24]. This symbology is found
to reduce workload of pilot during landing tasks and complex maneuvers in
helicopters too [25].
Figure 8. Conventional tunnel in the sky concept
Figure 9. Crow’s foot symbology](https://image.slidesharecdn.com/vol15no5-september2015-171208072531/85/Vol-15-No-5-September-2015-15-320.jpg)
![International Journal of Computer Science and Business Informatics
IJCSBI.ORG
ISSN: 1694-2108 | Vol. 15, No. 5. SEPTEMBER 2015 14
2.3.4 Primary Flight Displays
On the flight deck, Attitude Direction Indicator is displayed on a Primary
Flight Display (PFD) [23]. The PFD also contains other critical information
such as calibrated airspeed, altitude, heading, attitude and vertical speed. If a
Horizontal Situational Indicator (HSI) is displayed on the PFD, then this
display is known as Navigation Display. The PFD integrates important
analog instruments which can improve pilot’s SA during flight. This display
can also alert then pilot during harmful situations such as low airspeed, high
rate of descent etc by generating audio signals.
To improve situational awareness of pilots, more functionality is added to
the normal PFD display and can be denoted as SVS display. In addition to
the existing symbology, this can display synthetic terrain, command
guidance indicating the possible path to fly, horizontal and vertical path
deviations, velocity vector etc. [27].
2.3.5 Navigation Display
A Navigation Display (ND) provides lateral position information of the
aircraft. Depending different modes such as ILS, VOR or NAV, it displays a
compass rose or an arc of the compass rose. Lateral flight plan as well as
additional points like NDBs, VORs, airports are displayed on the ND.
The next section explains some of the commercial SVS products available
in the industry today.
3. COMMERCIAL OFF THE SHELF SVS PRODUCTS
This section describes the SVS products developed by various aviation
majors. It is found that, Honeywell Inc and Universal Avionics, two major
companies from USA are supplying SVS related products. Thales, Garmin,
Chelton Systems and Elbit Systems have also come up with certified SVS
displays.
Some of the certified SVS Systems along with a brief explanation of
capabilities of the product is explained below:
- SmartView Synthetic Vision System from Honeywell System
SmartView is a revolutionary product to increase safety and situational
awareness. SmartView is currently available on Gulfstream aircraft
equipped with the PlaneView™ cockpit, and Dassault aircraft featuring
the EASy flight deck. [28]
- Universal Avionics Systems Corporation’s Vision-1+ SVS
(FAR Part 23 and 25 Supplemental Type Certificates)
Terrain and runways are displayed using 15-arc second data resolution
worldwide and 6-arc second data for airport area [30]
- Garmin G-1000H® Synthetic Vision System](https://image.slidesharecdn.com/vol15no5-september2015-171208072531/85/Vol-15-No-5-September-2015-16-320.jpg)
![International Journal of Computer Science and Business Informatics
IJCSBI.ORG
ISSN: 1694-2108 | Vol. 15, No. 5. SEPTEMBER 2015 15
Garmin’s SVT displays 3D terrain, obstacles and traffic on G1000 PFD
simulating pilot’s outside the cockpit view during clear weather
conditions. This unit has implemented Highway-In-The-Sky guidance
symbology also [31]
- Thales’ Helicopter Flight Vision System (H-SVS)
This system provides enhanced situation awareness to approach, with
confidence, unfamiliar airports in all weather conditions. The display is
intuitive, real-time image is provided during all phases of flight, higher
mission reliability and lower rate of missed approaches. This system
meets the latest FAR 91.175 requirements and has been implemented On
Bombardier Global XRS AND Global 5000 Business Aircraft [32]
- Genesis Aerosystems’ (Previously known as Chelton Flight System) 3D
Synthetic Vision System
Synthetic vision with three-dimensional Highway-In-The-Sky
navigation (FAR Part 23 Supplemental Type Certificate)
- Rockwell Collins’ Helisure Helicopter Synthetic Vision System (H-
SVS)
This displays high-resolution terrain and identified obstacle database
with a resolution of 3-arc second [33]
- Elbit Systems’ Mission Safety Equipment Package (MSEP) for the C-
130 and ORIA Integrated Display System [34]
- Aspen Avionics’ Evolution Synthetic System which renders 3D
computer generated terrain with obstacles and traffic as viewed from
cockpit by pilot [35]
4. REQUIREMENT SPECIFICATIONS FOR THE
IMPLEMENTATION OF SVS
i. Elevation Database Resolution: SVS terrain depiction can match the
actual terrain environment if high DEM resolution data used.
Elevation reference (average elevation, maximum elevation or
elevation of the geometric center of the area) which is related to
DEM resolution has to be chosen to determine the manner of
assigning elevation values to the cells in the DEM for terrain
depiction. The data base resolution requirements [23] depend on the
flight phase. Experiments conducted by NASA indicate that although
one and three arc second resolutions are preferred, adequate situation
awareness can be obtained by pilot from a 30-arc second database
also
ii. Rendering: It is necessary to have anti-aliased video rendering on
displays using on-board avionics grade hardware in a cost-effective](https://image.slidesharecdn.com/vol15no5-september2015-171208072531/85/Vol-15-No-5-September-2015-17-320.jpg)
![International Journal of Computer Science and Business Informatics
IJCSBI.ORG
ISSN: 1694-2108 | Vol. 15, No. 5. SEPTEMBER 2015 16
way. The challenge in rendering arises as representation of realistic
terrain requires high resolution terrain databases while real-time
rendering requires optimized terrain models. Methods for adaptive
terrain meshing and depiction have been explored [28].
iii. Storage: Avionics quality storage devices are readily available for
SVS database applications. Typical storage requirements for a 1º by
1º cell (approximately 60 square miles at the equator) [4] are of the
order of 5 MB for DTED Level 1 data, 54 MB for DTED Level 2
data, 6.3 GB for DTED Level 4 data. [4]
iv. Texture / Color / Shading: To convey terrain information to pilot,
Terrain coloring and shading techniques have been found to be very
effective. NASA research has demonstrated that colored terrain
portrayal techniques convey more information than constant color
terrain displays. Two of the commonly used texturing methods are:
(i) elevation-based color-coding with generic texturing of the DEM
(ii) ortho-rectified photographic imagery overlays on the DEM
("photo-realistic"). Other enhancements that could be tried include:
(a) coloring bands with each band representing a 100 foot change in
elevation to show the height of the terrain
(b) Shading, texturing and shadowing to avoid the obscuration of
important terrain features by shadows due to the light source
positioning
(c) Hybrid textured format, created by false-color coding
monochromatic imagery (aerial photographs) of the flight test areas
of interest
While creating synthetic vision photo-realistic terrain database, color
balancing of imagery and time of year are important aspects to be
addressed.
v. Data base creation: A typical database model which can be used for
studies can be defined as below:
a. To generate an airport database, the airport surface needs to be
surveyed, especially the runway markings, lightings, buildings on the
runway vicinity. The markings can be accurate up to one foot to
carry out low visibility operations
b. DEMs around the runway need to be leveled / flattened as this can
make the pilot view a bumpy terrain creating peculiar artifacts. Once
a level field is created, polygon models of runway and airport
buildings to provide proper 3-D perspective cues can be inserted. By
doing this, the cues do not blur during close proximity display.](https://image.slidesharecdn.com/vol15no5-september2015-171208072531/85/Vol-15-No-5-September-2015-18-320.jpg)
![International Journal of Computer Science and Business Informatics
IJCSBI.ORG
ISSN: 1694-2108 | Vol. 15, No. 5. SEPTEMBER 2015 18
3D models of airport area such as runway and terminal buildings are derived
from aerial photographs of about one feet accuracy.
Figure 10. Recommended HUD symbology as per FAA Part 91.175 requirements
NRSC, ISRO through its portal BHUVAN [9] has made available Cartosat-
1 data with DEM of 1-arc second in public domain for Indian region. This
data has an accuracy of 10m and resolution of 30m. CartoSat-2 series
provides stereographic imagery with a resolution up to 0.8m. Cartosat-2C to
be launched in near future is expected to provide 0.64m DEMs. The
stereoscopic images have to be processed to generate DEM. In future,
Cartosat-3 is expected to provide DEM of resolution of 0.25m. For flight
tests, the database specifications should be as per RTCA / DO- 276
document. Cartosat data can be used for generating terrain database for
Indian airports.](https://image.slidesharecdn.com/vol15no5-september2015-171208072531/85/Vol-15-No-5-September-2015-20-320.jpg)
![International Journal of Computer Science and Business Informatics
IJCSBI.ORG
ISSN: 1694-2108 | Vol. 15, No. 5. SEPTEMBER 2015 19
Figure 11. Synthetic Terrain with recommended HUD symbology for SVS operations
6. CONCLUSION
A literature survey for Synthetic Vision Systems has been carried out. The
importance of SVS, its safety and operational benefits and various
components were studied. Different types of SV displays were deliberated.
A baseline SVS HUD and HDD display symbology has been developed
using FAA recommendations. Field tests of different field of views of HUD
have been elaborated. A study of tunnel-in-the-sky symbology and its
different implementations has been carried out. Certified SV Systems
available with state of art technology have been identified and listed.
Finally, the requirement specifications for implementation of a typical
synthetic system such as database resolution, rendering, storage space etc.
are elaborated.
REFERENCES
[1] M Uijt De Haag, J Sayre, J Campbell, S D Young, R A Gray, Terrain database
Integrity Monitoring for Synthetic Vision Systems, IEEE Transactions on Aerospace
and Electronics Vol 41 No. 2, April 2005, pp 386-406
[2] Peter Hecker, Hans-Ullrich Doehler, Reiner Suikat, Enhanced Vision meets Pilot
Assistance, Proceedings of SPIE -- Volume 3691 Enhanced and Synthetic Vision 1999,
Jacques G. Verly, Editor, July 1999, pp. 125-136
[3] Advisory Circular 20-267, Airworthiness Approval of Enhanced Vision System,
Synthetic Vision System, Combined Vision System and Enhanced Flight dated 6/22/10](https://image.slidesharecdn.com/vol15no5-september2015-171208072531/85/Vol-15-No-5-September-2015-21-320.jpg)
![International Journal of Computer Science and Business Informatics
IJCSBI.ORG
ISSN: 1694-2108 | Vol. 15, No. 5. SEPTEMBER 2015 20
[4] Russell V Parish et al. Aspects of Synthetic Vision Display Systems and the Best
Practices of the NASA’s SVS Project. NASA/TP-2008-215130, May 2008
[5] Arthur et al, Flight Test Comparison between Enhanced Vision and SVS, NASA LaRC,
Proceedings of SPIE Vol 5802 (ESV 2005)
[6] Maarten Haag, Steve Young, DTED Integrity Monitoring Using DGPS and Radar
Altimeter, ION Annual Meeting, San Diego, California 2000
[7] Prinzel and Kramer, Synthetic Vision Systems, Research and Technology Directorate,
Crew Systems and Operations Branch (D-318), Mail Stop 152, NASA Langley
Research Center, 2009
[8] Jacob Campbell, Characteristics Of A Real-Time Digital Terrain Database Integrity
Monitor For A Synthetic Vision System, November, 2001
[9] Bhuvan, Indian Geo-Portal of ISRO, www.bhuvan.nrsc.gov.in. Accessed on 7 Sept
2015
[10]Campbell, J. L., M. U. de Haag, A. Vadlamani, and S. Young, 2003. The Application
of LiDAR to Synthetic Vision System Integrity,
[11]User requirements for Aerodrome Mapping Information RTC / DO-272, 2001
[12]Head Up Displays, http://en.wikipedia.org/wiki/Heads_up_display, accessed on 7 Sept
2015
[13]Huiying Li, Visual Cueing for Collision Avoidance System, MSc Thesis, Cranfield
University, United Kingdom, 2012
[14]Kramer, Williams, Bailey, NLRC, Simulation evaluation of synthetic vision as an
enabling technology for equivalent visual operations, Proceedings of SPIE Vol 6957,
69570K, 2008)
[15]Wisely, BAE Systems, A digital head-up display system as part of an integrated
autonomous landing system concept, Proceedings of SPIE Vol 6957, 69570O (2008)
[16]Gang He, Thea et al, Flight Tests of Advanced 3D-PFD with Commercial Flap-Panel
Avionics Displays and EGPWS System, Proceedings of SPIE Vol 5802 (2005)
[17]Prinzel et al, The Efficacy of Head-Down and Head-Up Synthetic Vision Display
Concepts for Retro- and Forward-Fit of Commercial Aircraft, The International
Journal of Aviation Psychology 14: 1, 53 — 77 (2004)
[18]Head Up Display, http://www.skybrary.aero/index.php/Head_Up_Display. Accessed
on 8 Sept 2015
[19]HUD2020 Document, Honeywell Systems, http://www.cas.honeywell.com/bcas
[20]G Sachs and Sperl, Speed Control Issues For Tunnel In The Sky display with Predictor,
ESVS Proceedings of SPIE 2001
[21]FAA AC 23-26 - Synthetic Vision and Pathway Depictions on the Primary Flight
Display, Date Issued December 22, 2005
[22]Russel Parrish, Steven Williams et al, A description of the Crow’s Foot Tunnel
Concept June 2006, NASA/TM-2006-214311
[23]Lawrence J. Prinzel III, Jarvis J. Arthur III, Lynda J. Kramer, Randall E. Bailey,
Pathway concepts experiment for head-down synthetic vision displays, NASA Langley
Research Center, (ntrs.nasa.gov/archive/nasa/casi.ntrs.nasa.gov/ 20040056018.pdf)
[24]EFIS, http://principialabs.com/synthetic-vision-systems/http://en.wikipedia.org/wiki/
Electronic_flight_instrument_system. Accessed on : 4th
Sept 2015](https://image.slidesharecdn.com/vol15no5-september2015-171208072531/85/Vol-15-No-5-September-2015-22-320.jpg)
![International Journal of Computer Science and Business Informatics
IJCSBI.ORG
ISSN: 1694-2108 | Vol. 15, No. 5. SEPTEMBER 2015 21
[25]Gursky, Olsman, Pienecke, Development of Tunnel-in-the-sky display for noise
abatement procedures, CAES Journal, February 2014
[26]Thorsten Wiesemann, Jens Schiefele, Wolfgang Kubbat, Multi-resolution terrain
depiction on an embedded 2D/3D synthetic vision system, Elsevier Aerospace Science
and Technology (2005) 517–524
[27]SmartView Synthetic Vision System,
https://aerospace.honeywell.com/products/safety-systems/smartview -synthetic-vision-
system. Accessed on 01 Sept 2015
[28]Universal Avionics Systems, http://www.uasc.com/products/vision1plus.aspx.
Accessed on 09 Sept 2015
[29]Garmin Products, https://buy.garmin.com/en-US/US/in-the-air/avionics-
safety/terrain-awareness/svt-for-g1000-/prod37630.html, Accessed On 7 Sept
2015
[30] Svs_soc_tbw_last_feb15.pdf Brochure, downloaded from www.thalesgroup.com,
Accessed on 07 Sept 2015
[31]HeliSure SVS, https://www.rockwellcollins.com/Data/Products/
Radar_and_Surveillance/Integrated_Hazard_Surveillance/ HeliSure_
Helicopter_Synthetic_Vision_System.aspx. Accessed on 09 Sept 2015
[32]ORIA Integrated Display System, http://www.elbitsystems-us.com/airborne-
solutions/products-sub-systems/displays/oria-integrated-display-system. Accessed on
09 Sept 2015
[33] Evolution Synthetic System, http://www.aspenavionics.com/products/evolution-
synthetic-vision/. Accessed on 10 Sept 2015
This paper may be cited as:
Kudligi S. and Pashilkar A., 2015. Synthetic Vision Systems – Terrain
Database, Symbology and Display Requirements, International Journal of
Computer Science and Business Informatics, Vol. 15, No. 4, pp. 1-21.](https://image.slidesharecdn.com/vol15no5-september2015-171208072531/85/Vol-15-No-5-September-2015-23-320.jpg)

![International Journal of Computer Science and Business Informatics
IJCSBI.ORG
ISSN: 1694-2108 | Vol. 15, No. 5. SEPTEMBER 2015 22
A Conjoint Analysis of Customer
Preferences for VoIP Service in
Pakistan
Amir Manzoor
Bahria University
Karachi, Pakistan
ABSTRACT
In Pakistan, the VoIP service is gaining popularity. By the end of 2014, the total number of
broadband subscribers exceeded 3.35 million and the total number of mobile 3G
subscribers were approximately 4 million. The service providers in Pakistan continue to
invest in infrastructure and supporting regulatory policies fueling the development of
infrastructure. It is expected that such an environment would be able to provide good
quality Voice over IP (VoIP) service. In this context, this study analyzed Pakistani
consumer preferences for VoIP service. The findings have significant implications for
service providers looking to develop effective marketing strategies and design VoIP service
that meets consumers’ demand.
Keywords
Last mile access; Pakistani telecom market; Discrete choice model; Market share; Mobile
phone; Stated preference, Number portability, Mobile telecommunication services;
Willingness to pay.
1. INTRODUCTION
The technology of number probability (NP) has made it very convenient
to switch from traditional public switched telephone network (PSTN) to
Voice-over-IP (VOIP) with no need of changing your phone number [1].
The NP provides several benefits for VOIP service. The NP can reduce
switching costs [3] and promotes competition among service provides by
reducing switching barriers [23] [11]. The NP can also increase VOIP
service attractiveness for mobile customers [8]. Around the globe,
customers of traditional PSTN are switching to VOIP. In Korea alone, there
was 100% increase in customers moving to VOIP in year 2008 and the
expected number of VOIP users were 5.2 million by end of 2008 [13] [7].
The global VOIP market estimated at US$ 70.9 billion in 2013. It was
expected that the market would grow to US$136.8 billion by 2020 [19]. The
modern internet infrastructures are capable of providing good quality VOIP
services. For the future success of VOIP, it is important that service
provides maintain the quality of VOIP service and adopt effective marketing](https://image.slidesharecdn.com/vol15no5-september2015-171208072531/85/Vol-15-No-5-September-2015-25-320.jpg)
![International Journal of Computer Science and Business Informatics
IJCSBI.ORG
ISSN: 1694-2108 | Vol. 15, No. 5. SEPTEMBER 2015 23
strategies. In this context, it is important to understand consumer
preferences for VOIP Service. The purpose of this study is to explore
important VOIP service attributes desired by the consumer in Pakistan.
This paper proceeds as follows. In the next section, the literature review is
presented. Section 3 describes research methodology. Section 4 presents
results and discussion. Conclusion is presented in Section 5.
2. LITERATURE REVIEW
2.1 Voice-over-IP (VoIP)
VOIP refers to voice communication that takes place over the internet
[21]. VOIP uses data packets containing compressed digital signals of voice.
These data packets are transmitted using internet protocol (IP) [23]. The
concept of VOIP was developed in the 1970’s [18]. However, the
commercial development of VOIP was started in the 1990s [23]. The VOIP
service is available in a variety of combinations of devices such as phone-to-
phone, computer-to-phone and computer-to-computer. The most widely
used combination is computer-to-computer [4]. In this combination a
software and headset is required for communication. In the phone-to-phone
combination, an exclusive consumer device is used that connects to the
internet for voice communication.
From a technical standpoint, VOIP provides many advantages over PSTN
including reduced call charges and many additional value-add services
(VAS) [12] [15] [17] [23] [18] [9] [27]. The cost of using VOIP can be as
low as half the cost of traditional PSTN. Since VOIP provides simultaneous
data and voice communication over the Internet, many VAS can be provided
(Such as SMS, video telephony, caller ID, Call forwarding etc.) [17].
Despite all such advantages, quality-of-service (QoS) is still a major
concern of consumers. Services providers have been making continuous
efforts to improve QoS by upgrading their network infrastructures using
modern network technologies [21] [16].
2.2 VoIP in Pakistan
In Pakistan, the VOIP market has grown after Pakistan telecomm Authority
(PTA) deregulated the telecom sector. Due to reduced entry barriers, many
small-scale companies entered into the VOIP market and started providing
the service. These service providers however failed to achieve a broader
diffusion due to QoS-related problems such as jitter, latency, and packet
loss. As such, these companies were unable to provide reliable service [5].
Many companies also entered into the market to reap the benefits of VOIP
by providing grey traffic. In such arrangements, companies used VoIP to](https://image.slidesharecdn.com/vol15no5-september2015-171208072531/85/Vol-15-No-5-September-2015-26-320.jpg)
![International Journal of Computer Science and Business Informatics
IJCSBI.ORG
ISSN: 1694-2108 | Vol. 15, No. 5. SEPTEMBER 2015 24
bypass international gateway exchanges and make cheap international calls
[2]. The situation resulted in crackdown from PTA against such companies
and more stringent requirements for companies starting to provide VOIP
service. Home consumer market greatly benefited from availability of free
VOIP software such as Skype. Many telecom companies also started to
provide video telephony services after the availability of 3G network in
Pakistan. The household consumers of VOIP service were interested in
service attributes such as reduced call charges, simultaneous voice and data
communication, and VAS [20]. From a demographic point of view,
education level, residence, and purchasing power were significant predictors
of consumer intention to use VOIP (15). With the introduction of number
portability in Pakistan in 2009, the VOIP market is expected to grow. This
number portability is expected to increase competition in fixed-phone
services market, make VOIP service more attractive to consumers, and
activate VOIP service market [20].
3. RESEARCH METHODOLOGY
The study sample consisted of 300 household consumers. This was a
convenience sample and all respondents were selected from Karachi. All
respondents were user of some type of VOIP service. The survey
questionnaires were distributed in hard copy to all the participants. Two
hundred forty six participants’ completed and useful questionnaires were
received achieving a response rate of 82%. The data was coded and
analyzed using SPSS version 22 software.
To analyze consumer preferences for various attributes of VOIP service,
this study used the conjoint analysis technique. This technique can be used
when we want to predict consumer preferences among alternative of
multiple attributes options [6][13] [29] [30]. Using this technique, it is
possible to estimate the structure of consumer’s preferences given the
consumer’s evaluation of a set of alternatives with pre-specified levels. The
conjoint analysis is an accepted and popular technique among academicians
and practitioners that is used for a variety of marketing purposes such as
new product evolution and market segmentation.
There exist many studies in the context of developed world that have
used conjoint analysis to estimate consumer’s preferences for VOIP service.
One such study by [18] suggested that voice quality and service reliability
were the critical attributes of VOIP service. The study of [14] estimates
Japanese consumer’s preferences for VOIP service. This study identified
QoS, guarantee, number portability, fax usage, and emergency access as
critical attributes of VOIP service.](https://image.slidesharecdn.com/vol15no5-september2015-171208072531/85/Vol-15-No-5-September-2015-27-320.jpg)
![International Journal of Computer Science and Business Informatics
IJCSBI.ORG
ISSN: 1694-2108 | Vol. 15, No. 5. SEPTEMBER 2015 25
[24] evaluated the South Korean consumer preferences for 4G technology
by conducting personal interviews. They used 4 attributes of 4G technology
in their study namely rates of data transfer, Quality of Service, number of
broadcasting channels, video-on-demand (VOD) service, and supplementary
services. They found that consumer attached most significant weightage to
VOD service. The conjoint analysis study of [25] used a different approach
to investigate the bundling of mobile telecommunication services such as
talk time (in minutes), text messages, and internet access. The study was
conducted among German consumers and results indicated that consumers
perceived price as the most significant attribute in the service bundle. The
second most important attribute was talk time.
To begin with, conjoint analysis we first need to define attributes and their
levels. The VoIP service attributes included in the research survey of this
study were derived from [15] [18] [14]. The survey instrument included four
attributes of VOIP service: the VOIP consumer device cost, savings of
monthly call charges number portability and VAS. It is observed that
consumers can have difficulties in simultaneously processing the
alternatives provided to them if the number of attributes is greater than six
[14] [26]. Therefore, the number of selected attributes in this study (i.e. 4)
was appropriate. Table 1 shows these attributes and their levels.
TABLE 1: VOIP SERVICE ATTRIBUTES AND LEVELS
Attribute Description Level
Consumer
device cost
Cost of an
exclusive
consumer
device
Free with
3-year
contract
PKR
6000
PKR
9000
Savings in
monthly
call charges
Monthly
savings in call
charges as
compared to
PSTN
PKR 600 PKR
800
PKR
1000
Number
portability
Provision of
number
portability
Available Not
available](https://image.slidesharecdn.com/vol15no5-september2015-171208072531/85/Vol-15-No-5-September-2015-28-320.jpg)
![International Journal of Computer Science and Business Informatics
IJCSBI.ORG
ISSN: 1694-2108 | Vol. 15, No. 5. SEPTEMBER 2015 26
Value-
added
services
Value-added
service
provided by
VoIP
Provided Not
provided
To use VOIP a consumer would need to purchase a device capable of
providing VOIP service. In many parts of the world, service providers do
not charge customers for this device but require a long-term service
contract. However, this may not be a case in developing world and therefore
this consumer device cost could act as a switching cost and can act as an
attribute considered by consumers who are thinking to switch to VoIP.
We mentioned earlier that savings in call charges is one significant
advantage of VoIP. This is one significant attribute of VoIP service
consumers are interested in [7]. The charge system of VoIP is more
attractive in terms of initial set up costs, monthly charges, long-distance/
international call charges, and mobile call charges. Many service provider
also offer free calls by phone between their users. The monthly savings can
be increased it a user makes many long-distance and international calls.
Number portability is a significant attribute that can affect customer
preference for VoIP service. We have mentioned earlier that number
portability allows a customer to retain his phone number when he switches
to VoIP. Therefore, number portability can be considered a significant
attribute of VoIP service [2] [22] [28].
In conjoint analysis, a compositional model is assumed in order infer part-
utility of attributes. This model specifies how the scores of different
attributes interact and are related to each other. A further assumption is
made that the bases on which a consumer selects an alternative is the utility
of the alternative and this utility can be determined using the following
equation shown in Figure 1.](https://image.slidesharecdn.com/vol15no5-september2015-171208072531/85/Vol-15-No-5-September-2015-29-320.jpg)
![International Journal of Computer Science and Business Informatics
IJCSBI.ORG
ISSN: 1694-2108 | Vol. 15, No. 5. SEPTEMBER 2015 29
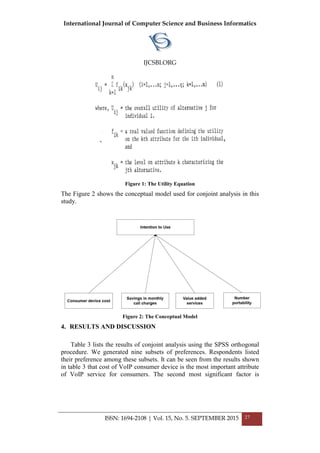
TABLE 2: RESULTS OF CONJOINT ANALYSIS
Attributes Level Utility
Estimates
Sig.
Consumer
device cost
Free with 3-
year contract
2.081 58.50
PKR 6000 0.0713
PKR 9000 -2.513
Savings in
monthly
call
charges
PKR 600 -0.0701 21.44
PKR 800 -0.1024
PKR 1000 0.8143
Number
portability
Available 0.5441 16.56
Not available -0.5432
Value-
added
services
Provided 0.2913 8.74
Not provided -0.2814
5. CONCLUSION
This study attempted to analyze Pakistani household consumer’s preference
of VoIP service. It was found that consumers regard VoIP device cost and
monthly call charges as the most important attribute when deciding to use
VoIP. Therefore, service provides should come up with strategy to provide
an acceptable consumer device cost with good QoS of basic call
functionality of VoIP service.
REFERENCES
[1] Tipping, D., 2014. The rising threats from Voice over IP. Network Security 2014,
5–6.](https://image.slidesharecdn.com/vol15no5-september2015-171208072531/85/Vol-15-No-5-September-2015-32-320.jpg)
![International Journal of Computer Science and Business Informatics
IJCSBI.ORG
ISSN: 1694-2108 | Vol. 15, No. 5. SEPTEMBER 2015 30
[2] Anwar, U., Shabbir, G., Ali, M.A., 2014. Data Analysis and Summarization to
Detect Illegal VOIP Traffic with Call Detail Records. International Journal of
Computer Applications 89, 1–7.
[3] Aoki, R., Small, J., 1999. The economics of number portability: Switching costs
and two-part tariffs. University of Auckland, Dept. of Economics Working Paper.
[4] Asante, G., Hayfron-Acquah, J.B., Riverson, K., 2015. Leveraging VOIP on Local
Area Network using Java Media Framework. International Journal of Computer
Applications 113.
[5] Asmat, H., Ullah, S., 2015. The Impact of Existing and Future Mobile
Technologies on Pakistan: A Survey. International Journal of Future Computer
and Communication 4, 254.
[6] Nam, J., Kim, S., Yeom, M., 2009. Exploring Attributes for Selecting VoIP
Service in Korea, in: Proceedings of International Conference on Computer
Engineering and Applications (ICCEA 2009).
[7] Brown, G.K., Carlson, J., Farnon, M., Land, G.A., Long, B., Lynette, T.D., Moore,
R.D., 2014. Functionalities for local number portability in a telecommunications
network. Google Patents.
[8] Shin, D.H., Kim, W.Y., 2007. Mobile number portability on customer switching
behavior: in the case of the Korean mobile market. info 9, 38–54.
[9] Chopra, A., Chaudhary, B., Mann, S., 2014. Analysis of Security Issues in VoIP.
International Journal of Computer Applications 103.
[10]Kim, D.H., 2007. Voice over IP, Its visions and market analysis. Inf. Soc 12, 64–
91.
[11]Gans, J.S., King, S.P., Woodbridge, G., 2001. Numbers to the people: regulation,
ownership and local number portability. Information Economics and Policy 13,
167–180.
[12]Han, S.-C., Key, Y.-M., 2007. A Study on the Common Carrier’s Strategies for IP
Telephony Service Market under Uncertain and Complex Environment: Focusing
on Scenario Planning Method, in: Advanced Communication Technology, The 9th
International Conference on. IEEE, pp. 869–871.
[13]H. Kim, 2005. Subscription to the Internet Telephony: An Econometric Analysis
of Stated-Preference. Data, KORMS/KIIE Conference, pp.814-821.
[14]Ida, T., Kinoshita, S., Sato, M., 2008. Conjoint analysis of demand for IP
telephony: the case of Japan. Applied Economics 40, 1279–1287.
[15]Park, J.H., Park, H.J., Paik, J.H., 2008. Using characteristics and adoption
determinants of fixed VoIP in Korea. ETRI IT Trends Report 23, 163–174.
[16]Kumar, V.G., Ramesh, G., 2014. Most Influential Factors of Buying Behaviour-A
Study with Special Reference to Consumers of Internet Services in Chennai City.
Advances in Management 7, 28.
[17]Hassan, M., Nayandoro, A., Atiquzzaman, M., 2000. Internet telephony: services,
technical challenges, and products. Communications Magazine, IEEE 38, 96–103.
[18]Zubey, M.L., Wagner, W., Otto, J.R., 2002. A conjoint analysis of voice over IP
attributes. Internet Research 12, 7–15.
[19]Perdue, J., 2014. VoIP Services Market is Growing at a CAGR of 9.7% from 2014
to 2020 [WWW Document]. LinkedIn Pulse. URL](https://image.slidesharecdn.com/vol15no5-september2015-171208072531/85/Vol-15-No-5-September-2015-33-320.jpg)
![International Journal of Computer Science and Business Informatics
IJCSBI.ORG
ISSN: 1694-2108 | Vol. 15, No. 5. SEPTEMBER 2015 31
https://www.linkedin.com/pulse/20140911043449-339157087-voip-services-
market-is-growing-at-a-cagr-of-9-7-from-2014-to-2020 (accessed 9.14.15).
[20]PTA, 2015. PTA Annual Report 2014 [WWW Document]. URL
http://www.pta.gov.pk/annual-reports/ptaannrep2013-14.pdf (accessed 9.14.15).
[21]Cherry, S., 2005. Seven myths about voice over IP. Spectrum, IEEE 42, 52–57.
[22]Srinagesh, P., Mitchell, B.M., 1999. An economic analysis of telephone number
portability. Competition, Regulation, and Convergence: Current Trends in
Telecommunications Policy Research 73.
[23]Varshney, U., Snow, A., McGivern, M., Howard, C., 2002. Voice over IP.
Communications of the ACM 45, 89–96.
[24]Kwak, S.-Y., Yoo, S.-H., 2012. Ex-ante evaluation of the consumers’ preference
for the 4th generation mobile communications service. Technological Forecasting
and Social Change 79, 1312–1318.
[25]Klein, A., Jakopin, N., 2014. Consumers’ willingness-to-pay for mobile
telecommunication service bundles. Telematics and Informatics 31, 410–421.
[26]Johnson, F.R., Lancsar, E., Marshall, D., Kilambi, V., Mühlbacher, A., Regier,
D.A., Bresnahan, B.W., Kanninen, B., Bridges, J.F., 2013. Constructing
experimental designs for discrete-choice experiments: report of the ISPOR
conjoint analysis experimental design good research practices task force. Value in
Health 16, 3–13.
[27]Singh, H.P., Singh, S., Singh, J., Khan, S.A., 2014. VoIP: State of art for global
connectivity—A critical review. Journal of Network and Computer Applications
37, 365–379.
[28]Ahmed, M., Litchfield, A.T., Ahmed, S., Mahmood, A., Meazi, M.E.H., 2014.
VoIP Performance Analysis over IPv4 and IPv6. International Journal of
Computer Network and Information Security (IJCNIS) 6, 43.
[29]Sharma, S., Malhotra, N.K., 2015. Examining Social Setting and Product
Reference via Conjoint Analysis An Empirical Study of Restaurant Patronage, in:
The 1980’s: A Decade of Marketing Challenges. Springer, pp. 59–63.
[30]Diamantopoulos, A., Schlegelmilch, B.B., DuPreez, J.P., 2015. Comparing
consumer preferences in two european countries: a partially-individualized
conjoint analysis, in: Proceedings of the 1994 Academy of Marketing Science
(AMS) Annual Conference. Springer, pp. 92–92.
This paper may be cited as:
Manzoor, A., 2015. A Conjoint Analysis of Customer Preferences for VoIP
Service in Pakistan, International Journal of Computer Science and
Business Informatics, Vol. 15, No. 4, pp. 22-31.](https://image.slidesharecdn.com/vol15no5-september2015-171208072531/85/Vol-15-No-5-September-2015-34-320.jpg)