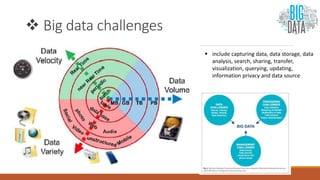
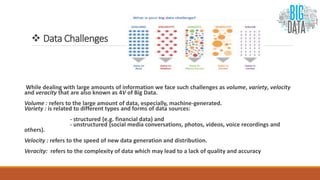
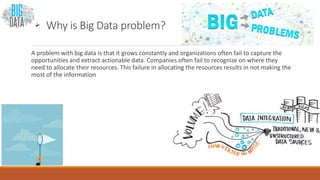
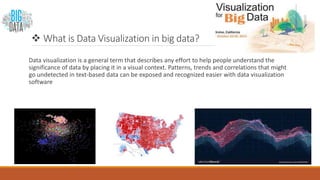
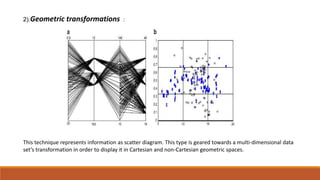
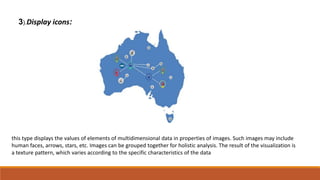
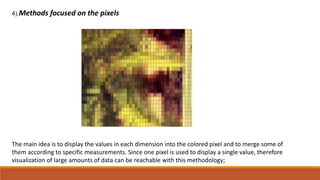
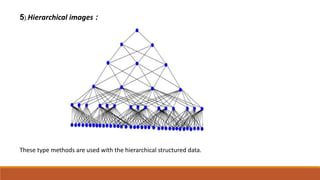
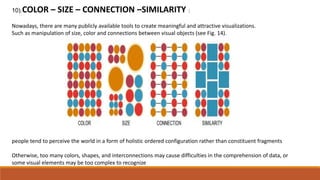
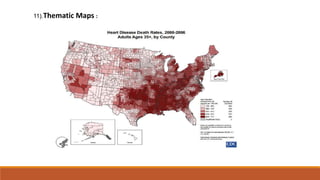
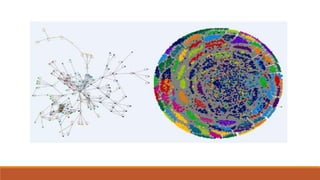
Big data involves analyzing large and complex datasets that cannot be processed by traditional methods. It faces challenges including data volume, variety, velocity, and veracity. Data visualization helps address these challenges by making patterns in the data easier to see. It allows faster understanding of data and trends. Effective visualization techniques depend on the type of data, and may include standard charts, geometric transformations, icons, pixels, hierarchies, tags, clusters, motion charts, dashboards, color/size/connections, maps, and text analysis.
Data has become an indispensable part of every economy, industry, organization, business
function and individual. Big Data is a term used to identify the datasets that whose size is
beyond the ability of typical database software tools to store, manage and analyze. The Big
Data introduce unique computational and statistical challenges, including scalability and
storage bottleneck, noise accumulation, spurious correlation and measurement errors. These
challenges are distinguished and require new computational and statistical paradigm. This
paper presents the literature review about the Big data Mining and the issues and challenges
with emphasis on the distinguished features of Big Data. It also discusses some methods to deal
with big data.
Creating Effective Data Visualizations in Excel 2016: Some BasicsShalin Hai-Jew
One of the mainstays of a modern software toolkit is Excel 2016, from Microsoft Office 2016. By reputation, Excel is considered a beginner’s tool that self-respecting data analysts would bypass, but Excel is fairly high-powered, can take up to 1.06 million rows of data per set, contains complex statistical analysis capabilities (without the need for scripting), and enables rich data visualizations. It has a number of rich add-ons to empower different analytical and data visualization functionalities. It works as a great bridging tool to more complex types of statistical analyses.
This session walks participants through some basic built-in data visualizations in Excel 2016, including pie charts and doughnuts, bar charts, tree maps and sunburst diagrams, cluster diagrams, spider (radar) charts, scattergraphs, and others. This session will cover how data structures and desired emphases will determine the options for particular data visualizations.
In this session, participants will
review how to load a data table,
read the general data in a data table (or worksheet),
process or clean the data as needed,
use the Recommended Charts feature,
decide which built-in data visualizations to use, and
consider how to add relevant data visualization elements (including data labels, background grids, axis labels, and titles) for a coherent and effective data visualization.
Also, participants will help co-build data visualizations from open-source and other datasets.
Introduction
Domain Expert
Goal identification and Data Understanding
Data Cleaning
Missing values
Noisy Data
Inconsistent Data
Data Integration
Data Transformation
Data Reduction
Feature Selection
Sampling Discretization
International Journal of Engineering Research and Applications (IJERA) is an open access online peer reviewed international journal that publishes research and review articles in the fields of Computer Science, Neural Networks, Electrical Engineering, Software Engineering, Information Technology, Mechanical Engineering, Chemical Engineering, Plastic Engineering, Food Technology, Textile Engineering, Nano Technology & science, Power Electronics, Electronics & Communication Engineering, Computational mathematics, Image processing, Civil Engineering, Structural Engineering, Environmental Engineering, VLSI Testing & Low Power VLSI Design etc.
Creating Effective Data Visualizations for Online Learning Shalin Hai-Jew
Virtually every type of online learning involves some type of data visualization. Some common data visualizations include timelines, process diagrams, linegraphs, bar charts, pie charts, treemap diagrams, dendrograms, cluster diagrams, geographical maps, network graphs, word clouds, word networks, scatter diagrams, scatterplot matrices, intensity matrices, decision trees, and others. Indeed, there is also data in screenshots, photos, drawings, videos, or other types of visuals. Online dashboards contain rich data visualizations to convey dynamic data. Some data, such as big data, may only be conveyed in visuals for human understanding and interpretation; in raw form, the meaning is obscured and elusive. Data visualizations highlight salient aspects of data, and they have to be aligned for particular multi-uses: (1) user awareness and understanding, (2) data analytics, and (3) decision-making. This session defines some best practices for informative and engaging data visualizations for online learning. Original real-world examples are provided from modern software programs.
Applying K-Means Clustering Algorithm to Discover Knowledge from Insurance Da...theijes
Data mining works to extract information known in advance from the enormous quantities of data which can lead to knowledge. It provides information that helps to make good decisions. The effectiveness of data mining in access to knowledge to achieve the goal of which is the discovery of the hidden facts contained in databases and through the use of multiple technologies. Clustering is organizing data into clusters or groups such that they have high intra-cluster similarity and low inter cluster similarity. This paper deals with K-means clustering algorithm which collect a number of data based on the characteristics and attributes of this data, and process the Clustering by reducing the distances between the data center. This algorithm is applied using open source tool called WEKA, with the Insurance dataset as its input
Big data is a prominent term which characterizes the improvement and availability of data in all three
formats like structure, unstructured and semi formats. Structure data is located in a fixed field of a record
or file and it is present in the relational data bases and spreadsheets whereas an unstructured data file
includes text and multimedia contents. The primary objective of this big data concept is to describe the
extreme volume of data sets i.e. both structured and unstructured. It is further defined with three “V”
dimensions namely Volume, Velocity and Variety, and two more “V” also added i.e. Value and Veracity.
Volume denotes the size of data, Velocity depends upon the speed of the data processing, Variety is
described with the types of the data, Value which derives the business value and Veracity describes about
the quality of the data and data understandability. Nowadays, big data has become unique and preferred
research areas in the field of computer science. Many open research problems are available in big data
and good solutions also been proposed by the researchers even though there is a need for development of
many new techniques and algorithms for big data analysis in order to get optimal solutions. In this paper,
a detailed study about big data, its basic concepts, history, applications, technique, research issues and
tools are discussed.
Big data is a prominent term which characterizes the improvement and availability of data in all three formats like structure, unstructured and semi formats. Structure data is located in a fixed field of a record or file and it is present in the relational data bases and spreadsheets whereas an unstructured data file includes text and multimedia contents. The primary objective of this big data concept is to describe the extreme volume of data sets i.e. both structured and unstructured. It is further defined with three “V” dimensions namely Volume, Velocity and Variety, and two more “V” also added i.e. Value and Veracity. Volume denotes the size of data, Velocity depends upon the speed of the data processing, Variety is described with the types of the data, Value which derives the business value and Veracity describes about the quality of the data and data understandability. Nowadays, big data has become unique and preferred research areas in the field of computer science. Many open research problems are available in big data and good solutions also been proposed by the researchers even though there is a need for development of many new techniques and algorithms for big data analysis in order to get optimal solutions. In this paper, a detailed study about big data, its basic concepts, history, applications, technique, research issues and tools are discussed.
Stacked Generalization of Random Forest and Decision Tree Techniques for Libr...IJEACS
The huge amount of library data stored in our modern research and statistic centers of organizations is springing up on daily bases. These databases grow exponentially in size with respect to time, it becomes exceptionally difficult to easily understand the behavior and interpret data with the relationships that exist between attributes. This exponential growth of data poses new organizational challenges like the conventional record management system infrastructure could no longer cope to give precise and detailed information about the behavior data over time. There is confusion and novel concern in selecting tools that can support and handle big data visualization that deals with multi-dimension. Viewing all related data at once in a database is a problem that has attracted the interest of data professionals with machine learning skills. This is a lingering issue in the data industry because the existing techniques cannot be used to remove or filter noise from relevant data and pad up missing values in order to get the required information. The aim is to develop a stacked generalization model that combines the functionality of random forest and decision tree to visualization library database visualization. In this paper, the random forest and decision tree techniques were employed to effectively visualize large amounts of school library data. The proposed system was implemented with a few lines of Python code to create visualizations that can help users at a glance understand and interpret the behavior of data and its relationships. The model was trained and tested to learn and extract hidden patterns of data with a cross-validation test. It combined the functionalities of both models to form a stacked generalization model that performed better than the individual techniques. The stacked model produced 95% followed by the RF which produced a 95% accuracy rate and 0.223600 RMSE error value in comparison with the DT which recorded an 80.00% success rate and 0.15990 RMSE value.
Characterizing and Processing of Big Data Using Data Mining TechniquesIJTET Journal
Abstract— Big data is a popular term used to describe the exponential growth and availability of data, both structured and unstructured. It concerns Large-Volume, Complex and growing data sets in both multiple and autonomous sources. Not only in science and engineering big data are now rapidly expanding in all domains like physical, bio logical etc...The main objective of this paper is to characterize the features of big data. Here the HACE theorem, that characterizes the features of the Big Data revolution, and proposes a Big Data processing model, from the data mining perspective, is used. The aggregation of mining, analysis, information sources, user interest modeling, privacy and security are involved in this model. To explore and extract the large volumes of data and useful information or knowledge respectively is the most fundamental challenge in Big Data. So we should have a tendency to analyze these problems and knowledge revolution.
Data sciences is the topnotch in our world now as it enables us to predict the future and behaviors of people and systems alike.
Hence, this course focuses on introducing the processing involved in data sciences.
Introduction to Data Analysis Course Notes.pdfGraceOkeke3
"Embark on a journey into data analysis with our Introduction to Data Analysis slides. Uncover the fundamentals and prerequisites for effective analysis, explore types of data, and discover essential tools and methodologies. Equip yourself with the skills to unlock valuable insights.
A Comparative Study of Various Data Mining Techniques: Statistics, Decision T...Editor IJCATR
In this paper we focus on some techniques for solving data mining tasks such as: Statistics, Decision Trees and Neural
Networks. The new approach has succeed in defining some new criteria for the evaluation process, and it has obtained valuable results
based on what the technique is, the environment of using each techniques, the advantages and disadvantages of each technique, the
consequences of choosing any of these techniques to extract hidden predictive information from large databases, and the methods of
implementation of each technique. Finally, the paper has presented some valuable recommendations in this field.
Frequent Item set Mining of Big Data for Social MediaIJERA Editor
Big data is a term for massive data sets having large, more varied and complex structure with the difficulties of storing, analyzing and visualizing for further processes or results. Bigdata includes data from email, documents, pictures, audio, video files, and other sources that do not fit into a relational database. This unstructured data brings enormous challenges to Bigdata.The process of research into massive amounts of data to reveal hidden patterns and secret correlations named as big data analytics. Therefore, big data implementations need to be analyzed and executed as accurately as possible. The proposed model structures the unstructured data from social media in a structured form so that data can be queried efficiently by using Hadoop MapReduce framework. The Bigdata mining is essential in order to extract value from massive amount of data. MapReduce is efficient method to deal with Big data than traditional techniques.The proposed Linguistic string matching Knuth-Morris-Pratt algorithm and K-Means clustering algorithm gives proper platform to extract value from massive amount of data and recommendation for user.Linguistic matching techniques such as Knuth–Morris–Pratt string matching algorithm are very useful in giving proper matching output to user query. The K-Means algorithm is one which works on clustering data using vector space model. It can be an appropriate method to produce recommendation for user.
Frequent Item set Mining of Big Data for Social MediaIJERA Editor
Big data is a term for massive data sets having large, more varied and complex structure with the difficulties of storing, analyzing and visualizing for further processes or results. Bigdata includes data from email, documents, pictures, audio, video files, and other sources that do not fit into a relational database. This unstructured data brings enormous challenges to Bigdata.The process of research into massive amounts of data to reveal hidden patterns and secret correlations named as big data analytics. Therefore, big data implementations need to be analyzed and executed as accurately as possible. The proposed model structures the unstructured data from social media in a structured form so that data can be queried efficiently by using Hadoop MapReduce framework. The Bigdata mining is essential in order to extract value from massive amount of data. MapReduce is efficient method to deal with Big data than traditional techniques.The proposed Linguistic string matching Knuth-Morris-Pratt algorithm and K-Means clustering algorithm gives proper platform to extract value from massive amount of data and recommendation for user.Linguistic matching techniques such as Knuth–Morris–Pratt string matching algorithm are very useful in giving proper matching output to user query. The K-Means algorithm is one which works on clustering data using vector space model. It can be an appropriate method to produce recommendation for user
Key Trends Shaping the Future of Infrastructure.pdfCheryl Hung
Keynote at DIGIT West Expo, Glasgow on 29 May 2024.
Cheryl Hung, ochery.com
Sr Director, Infrastructure Ecosystem, Arm.
The key trends across hardware, cloud and open-source; exploring how these areas are likely to mature and develop over the short and long-term, and then considering how organisations can position themselves to adapt and thrive.
Smart TV Buyer Insights Survey 2024 by 91mobiles.pdf91mobiles
91mobiles recently conducted a Smart TV Buyer Insights Survey in which we asked over 3,000 respondents about the TV they own, aspects they look at on a new TV, and their TV buying preferences.
Kubernetes & AI - Beauty and the Beast !?! @KCD Istanbul 2024Tobias Schneck
As AI technology is pushing into IT I was wondering myself, as an “infrastructure container kubernetes guy”, how get this fancy AI technology get managed from an infrastructure operational view? Is it possible to apply our lovely cloud native principals as well? What benefit’s both technologies could bring to each other?
Let me take this questions and provide you a short journey through existing deployment models and use cases for AI software. On practical examples, we discuss what cloud/on-premise strategy we may need for applying it to our own infrastructure to get it to work from an enterprise perspective. I want to give an overview about infrastructure requirements and technologies, what could be beneficial or limiting your AI use cases in an enterprise environment. An interactive Demo will give you some insides, what approaches I got already working for real.
Connector Corner: Automate dynamic content and events by pushing a buttonDianaGray10
Here is something new! In our next Connector Corner webinar, we will demonstrate how you can use a single workflow to:
Create a campaign using Mailchimp with merge tags/fields
Send an interactive Slack channel message (using buttons)
Have the message received by managers and peers along with a test email for review
But there’s more:
In a second workflow supporting the same use case, you’ll see:
Your campaign sent to target colleagues for approval
If the “Approve” button is clicked, a Jira/Zendesk ticket is created for the marketing design team
But—if the “Reject” button is pushed, colleagues will be alerted via Slack message
Join us to learn more about this new, human-in-the-loop capability, brought to you by Integration Service connectors.
And...
Speakers:
Akshay Agnihotri, Product Manager
Charlie Greenberg, Host
LF Energy Webinar: Electrical Grid Modelling and Simulation Through PowSyBl -...DanBrown980551
Do you want to learn how to model and simulate an electrical network from scratch in under an hour?
Then welcome to this PowSyBl workshop, hosted by Rte, the French Transmission System Operator (TSO)!
During the webinar, you will discover the PowSyBl ecosystem as well as handle and study an electrical network through an interactive Python notebook.
PowSyBl is an open source project hosted by LF Energy, which offers a comprehensive set of features for electrical grid modelling and simulation. Among other advanced features, PowSyBl provides:
- A fully editable and extendable library for grid component modelling;
- Visualization tools to display your network;
- Grid simulation tools, such as power flows, security analyses (with or without remedial actions) and sensitivity analyses;
The framework is mostly written in Java, with a Python binding so that Python developers can access PowSyBl functionalities as well.
What you will learn during the webinar:
- For beginners: discover PowSyBl's functionalities through a quick general presentation and the notebook, without needing any expert coding skills;
- For advanced developers: master the skills to efficiently apply PowSyBl functionalities to your real-world scenarios.
Accelerate your Kubernetes clusters with Varnish CachingThijs Feryn
A presentation about the usage and availability of Varnish on Kubernetes. This talk explores the capabilities of Varnish caching and shows how to use the Varnish Helm chart to deploy it to Kubernetes.
This presentation was delivered at K8SUG Singapore. See https://feryn.eu/presentations/accelerate-your-kubernetes-clusters-with-varnish-caching-k8sug-singapore-28-2024 for more details.
Dev Dives: Train smarter, not harder – active learning and UiPath LLMs for do...UiPathCommunity
💥 Speed, accuracy, and scaling – discover the superpowers of GenAI in action with UiPath Document Understanding and Communications Mining™:
See how to accelerate model training and optimize model performance with active learning
Learn about the latest enhancements to out-of-the-box document processing – with little to no training required
Get an exclusive demo of the new family of UiPath LLMs – GenAI models specialized for processing different types of documents and messages
This is a hands-on session specifically designed for automation developers and AI enthusiasts seeking to enhance their knowledge in leveraging the latest intelligent document processing capabilities offered by UiPath.
Speakers:
👨🏫 Andras Palfi, Senior Product Manager, UiPath
👩🏫 Lenka Dulovicova, Product Program Manager, UiPath
Epistemic Interaction - tuning interfaces to provide information for AI supportAlan Dix
Paper presented at SYNERGY workshop at AVI 2024, Genoa, Italy. 3rd June 2024
https://alandix.com/academic/papers/synergy2024-epistemic/
As machine learning integrates deeper into human-computer interactions, the concept of epistemic interaction emerges, aiming to refine these interactions to enhance system adaptability. This approach encourages minor, intentional adjustments in user behaviour to enrich the data available for system learning. This paper introduces epistemic interaction within the context of human-system communication, illustrating how deliberate interaction design can improve system understanding and adaptation. Through concrete examples, we demonstrate the potential of epistemic interaction to significantly advance human-computer interaction by leveraging intuitive human communication strategies to inform system design and functionality, offering a novel pathway for enriching user-system engagements.
GraphRAG is All You need? LLM & Knowledge GraphGuy Korland
Guy Korland, CEO and Co-founder of FalkorDB, will review two articles on the integration of language models with knowledge graphs.
1. Unifying Large Language Models and Knowledge Graphs: A Roadmap.
https://arxiv.org/abs/2306.08302
2. Microsoft Research's GraphRAG paper and a review paper on various uses of knowledge graphs:
https://www.microsoft.com/en-us/research/blog/graphrag-unlocking-llm-discovery-on-narrative-private-data/
Essentials of Automations: Optimizing FME Workflows with ParametersSafe Software
Are you looking to streamline your workflows and boost your projects’ efficiency? Do you find yourself searching for ways to add flexibility and control over your FME workflows? If so, you’re in the right place.
Join us for an insightful dive into the world of FME parameters, a critical element in optimizing workflow efficiency. This webinar marks the beginning of our three-part “Essentials of Automation” series. This first webinar is designed to equip you with the knowledge and skills to utilize parameters effectively: enhancing the flexibility, maintainability, and user control of your FME projects.
Here’s what you’ll gain:
- Essentials of FME Parameters: Understand the pivotal role of parameters, including Reader/Writer, Transformer, User, and FME Flow categories. Discover how they are the key to unlocking automation and optimization within your workflows.
- Practical Applications in FME Form: Delve into key user parameter types including choice, connections, and file URLs. Allow users to control how a workflow runs, making your workflows more reusable. Learn to import values and deliver the best user experience for your workflows while enhancing accuracy.
- Optimization Strategies in FME Flow: Explore the creation and strategic deployment of parameters in FME Flow, including the use of deployment and geometry parameters, to maximize workflow efficiency.
- Pro Tips for Success: Gain insights on parameterizing connections and leveraging new features like Conditional Visibility for clarity and simplicity.
We’ll wrap up with a glimpse into future webinars, followed by a Q&A session to address your specific questions surrounding this topic.
Don’t miss this opportunity to elevate your FME expertise and drive your projects to new heights of efficiency.
Generating a custom Ruby SDK for your web service or Rails API using Smithyg2nightmarescribd
Have you ever wanted a Ruby client API to communicate with your web service? Smithy is a protocol-agnostic language for defining services and SDKs. Smithy Ruby is an implementation of Smithy that generates a Ruby SDK using a Smithy model. In this talk, we will explore Smithy and Smithy Ruby to learn how to generate custom feature-rich SDKs that can communicate with any web service, such as a Rails JSON API.
UiPath Test Automation using UiPath Test Suite series, part 3DianaGray10
Welcome to UiPath Test Automation using UiPath Test Suite series part 3. In this session, we will cover desktop automation along with UI automation.
Topics covered:
UI automation Introduction,
UI automation Sample
Desktop automation flow
Pradeep Chinnala, Senior Consultant Automation Developer @WonderBotz and UiPath MVP
Deepak Rai, Automation Practice Lead, Boundaryless Group and UiPath MVP
GDG Cloud Southlake #33: Boule & Rebala: Effective AppSec in SDLC using Deplo...James Anderson
Effective Application Security in Software Delivery lifecycle using Deployment Firewall and DBOM
The modern software delivery process (or the CI/CD process) includes many tools, distributed teams, open-source code, and cloud platforms. Constant focus on speed to release software to market, along with the traditional slow and manual security checks has caused gaps in continuous security as an important piece in the software supply chain. Today organizations feel more susceptible to external and internal cyber threats due to the vast attack surface in their applications supply chain and the lack of end-to-end governance and risk management.
The software team must secure its software delivery process to avoid vulnerability and security breaches. This needs to be achieved with existing tool chains and without extensive rework of the delivery processes. This talk will present strategies and techniques for providing visibility into the true risk of the existing vulnerabilities, preventing the introduction of security issues in the software, resolving vulnerabilities in production environments quickly, and capturing the deployment bill of materials (DBOM).
Speakers:
Bob Boule
Robert Boule is a technology enthusiast with PASSION for technology and making things work along with a knack for helping others understand how things work. He comes with around 20 years of solution engineering experience in application security, software continuous delivery, and SaaS platforms. He is known for his dynamic presentations in CI/CD and application security integrated in software delivery lifecycle.
Gopinath Rebala
Gopinath Rebala is the CTO of OpsMx, where he has overall responsibility for the machine learning and data processing architectures for Secure Software Delivery. Gopi also has a strong connection with our customers, leading design and architecture for strategic implementations. Gopi is a frequent speaker and well-known leader in continuous delivery and integrating security into software delivery.
State of ICS and IoT Cyber Threat Landscape Report 2024 previewPrayukth K V
The IoT and OT threat landscape report has been prepared by the Threat Research Team at Sectrio using data from Sectrio, cyber threat intelligence farming facilities spread across over 85 cities around the world. In addition, Sectrio also runs AI-based advanced threat and payload engagement facilities that serve as sinks to attract and engage sophisticated threat actors, and newer malware including new variants and latent threats that are at an earlier stage of development.
The latest edition of the OT/ICS and IoT security Threat Landscape Report 2024 also covers:
State of global ICS asset and network exposure
Sectoral targets and attacks as well as the cost of ransom
Global APT activity, AI usage, actor and tactic profiles, and implications
Rise in volumes of AI-powered cyberattacks
Major cyber events in 2024
Malware and malicious payload trends
Cyberattack types and targets
Vulnerability exploit attempts on CVEs
Attacks on counties – USA
Expansion of bot farms – how, where, and why
In-depth analysis of the cyber threat landscape across North America, South America, Europe, APAC, and the Middle East
Why are attacks on smart factories rising?
Cyber risk predictions
Axis of attacks – Europe
Systemic attacks in the Middle East
Download the full report from here:
https://sectrio.com/resources/ot-threat-landscape-reports/sectrio-releases-ot-ics-and-iot-security-threat-landscape-report-2024/
JMeter webinar - integration with InfluxDB and GrafanaRTTS
Watch this recorded webinar about real-time monitoring of application performance. See how to integrate Apache JMeter, the open-source leader in performance testing, with InfluxDB, the open-source time-series database, and Grafana, the open-source analytics and visualization application.
In this webinar, we will review the benefits of leveraging InfluxDB and Grafana when executing load tests and demonstrate how these tools are used to visualize performance metrics.
Length: 30 minutes
Session Overview
-------------------------------------------
During this webinar, we will cover the following topics while demonstrating the integrations of JMeter, InfluxDB and Grafana:
- What out-of-the-box solutions are available for real-time monitoring JMeter tests?
- What are the benefits of integrating InfluxDB and Grafana into the load testing stack?
- Which features are provided by Grafana?
- Demonstration of InfluxDB and Grafana using a practice web application
To view the webinar recording, go to:
https://www.rttsweb.com/jmeter-integration-webinar
JMeter webinar - integration with InfluxDB and Grafana
Big data visualization state of the art
1.
2. "Big data" is a field that treats ways to analyze, systematically extract information from, or
otherwise deal with data sets that are too large or complex to be dealt with by traditional data-
processing application software. Data with many cases (rows) offer greater statistical power,
while data with higher complexity (more attributes or columns) may lead to a higher false
discovery rate
3. Big data challenges
include capturing data, data storage, data
analysis, search, sharing, transfer,
visualization, querying, updating,
information privacy and data source
4. Data Challenges
While dealing with large amounts of information we face such challenges as volume, variety, velocity
and veracity that are also known as 4V of Big Data.
Volume : refers to the large amount of data, especially, machine-generated.
Variety : is related to different types and forms of data sources:
- structured (e.g. financial data) and
- unstructured (social media conversations, photos, videos, voice recordings and
others).
Velocity : refers to the speed of new data generation and distribution.
Veracity: refers to the complexity of data which may lead to a lack of quality and accuracy
5. Why is Big Data problem?
A problem with big data is that it grows constantly and organizations often fail to capture the
opportunities and extract actionable data. Companies often fail to recognize on where they
need to allocate their resources. This failure in allocating the resources results in not making the
most of the information
6. What is Data Visualization in big data?
Data visualization is a general term that describes any effort to help people understand the
significance of data by placing it in a visual context. Patterns, trends and correlations that might
go undetected in text-based data can be exposed and recognized easier with data visualization
software
7. What are the benefits of data visualization?
o
Faster Action. The human brain tends to process visual information far more easily than written
information.
o
Communicate Findings in Constructive Ways.
o
Understand Connections Between Operations and Results.
o
Embrace Emerging Trends
o
Interact With Data
o
Create New Discussion
8. Why is data visualization important?
Meeting the need for speed.
Understanding the data
Addressing data quality
Dealing with outliers
Displaying meaningful results
9.
10.
11.
12.
13.
14. visualized representation of data is abstract and extremely limited by one’s perception capabilities and
requests (see Fig. 4).
So human perception capabilities are not sufficient embrace large amount of data
15. types of data to be visualized:
• Univariate data One dimensional arrays, time series, etc.
• Two-dimensional data Point two-dimensional graphs, geographical
coordinates, etc.
• Multidimensional data Financial indicators, results of experiments, etc.
• Texts and hypertexts Newspaper articles, web documents, etc.
• Hierarchical and links The structure subordination in the organization, e-mails,
documents and hyperlinks, etc.
• Algorithms and programs Information flows, debug operations, etc.
16. Types of visualization techniques:
1) 2D/3D standard figure:
May be implemented as bars, line graphs, various charts, etc. (see Fig. 5). The main drawback of this type is the
complexity of the acceptable visualization for complicated data structures.
17. (.2 Geometric transformations :
This technique represents information as scatter diagram. This type is geared towards a multi-dimensional data
set’s transformation in order to display it in Cartesian and non-Cartesian geometric spaces.
18. (.3 Display icons:
this type displays the values of elements of multidimensional data in properties of images. Such images may include
human faces, arrows, stars, etc. Images can be grouped together for holistic analysis. The result of the visualization is
a texture pattern, which varies according to the specific characteristics of the data
19. (.4 Methods focused on the pixels
The main idea is to display the values in each dimension into the colored pixel and to merge some of
them according to specific measurements. Since one pixel is used to display a single value, therefore
visualization of large amounts of data can be reachable with this methodology;
20. (.5 Hierarchical images :
These type methods are used with the hierarchical structured data.
21. (.6 Tag cloud:
Tag cloud is used in text analysis, with a weighting value dependent on the frequency of use (citation)
of a particular word or phrase. It consists of an accumulation of lexical items (words, symbols or
combination of the two). This tech-nique is commonly integrated with web sources to quickly
familiarize visitors with the content via key words.
22. (.7 Clustergram :
Clustergram is an imaging technique used in cluster analysis by means of representing the relation of
individual elements of the data as they change their number. Choosing the optimal number of clusters
is also an important component of cluster analysis.
23. (.8 Motion charts :
Motion charts allow effective exploration of large and multivariate data and interact with it utilizing
dynamic 2D bubble charts. The blobs (bubbles—central objects of this technique) can be controlled due
to variable mapping for which it is designed. For instance, motion charts graphical data tools are
provided by Google , amCharts and IBM Many Eyes.
24. (.9 Dashboard:
Dashboard enables the display of log files of various formats and filter data based on chosen data
ranges. Traditionally, dashboard consists of three layers: data (raw data), analysis (includes formulas
and imported data from data layer to tables) and presentation (graphical representation based on the
analysis layer).
25. (.10 COLOR – SIZE – CONNECTION –SIMILARITY :
Nowadays, there are many publicly available tools to create meaningful and attractive visualizations.
Such as manipulation of size, color and connections between visual objects (see Fig. 14).
people tend to perceive the world in a form of holistic ordered configuration rather than constituent fragments
Otherwise, too many colors, shapes, and interconnections may cause difficulties in the comprehension of data, or
some visual elements may be too complex to recognize
27. (.12 Text Analytics: Visualizing Natural Language
Text Annotation and Markup
Named entity recognition (NER)
Named entity recognition (NER) seeks to locate and classify atomic elements in text into predefined
categories such as the names of persons, organizations, locations, etc. The list of categories can be
extended to include disease names in the biomedical paradigm.
Quantities and Dates are often included in NER systems
28. Research indicates that NER systems developed for one domain do not typically perform
well on other domains.
Early work in NER systems in the 1990s was aimed primarily at extraction from
journalistic articles.
Attention then turned to processing of military dispatches and reports.
Since about 1998, there has been a great deal of interest in entity identification in the
molecular biology, bioinformatics, and medical natural language processing
communities.The most common entity of interest in that domain has been names of
genes and gene products.