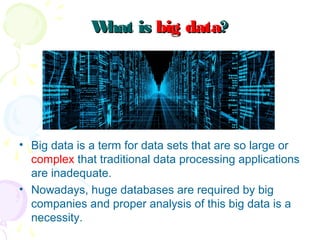
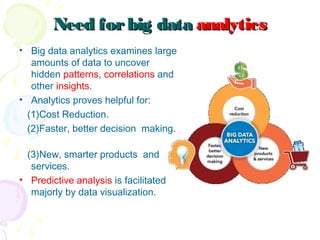
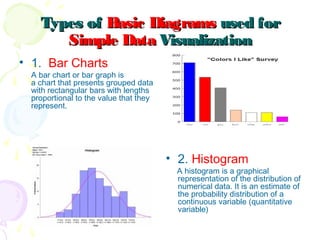
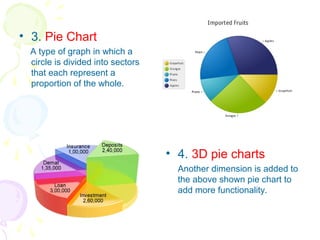
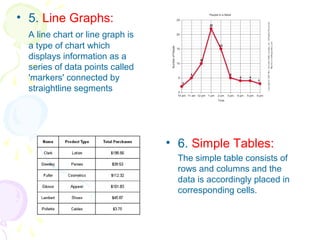
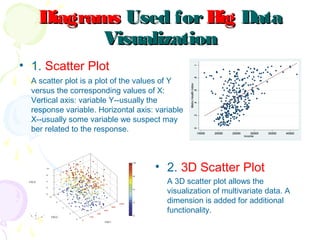
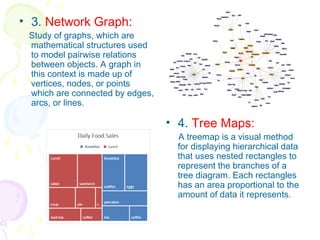
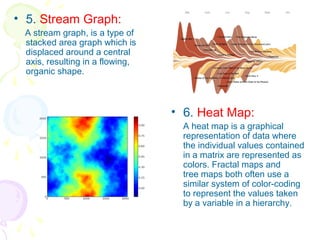
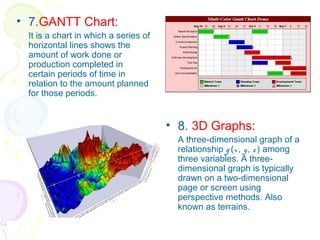
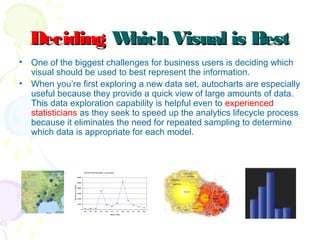
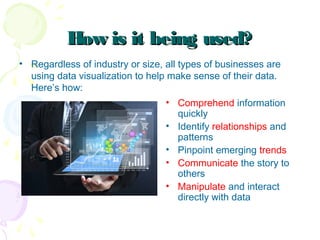
This document discusses visual analytics and big data visualization. It defines big data and explains the need for big data analytics to uncover patterns. Data visualization helps make sense of large datasets and facilitates predictive analysis. Different visualization techniques are described, including charts, graphs, and diagrams suited to simple and big data. Visualization acts as an interface between data storage and users. Characteristics of good visualization and tools for big data visualization are also outlined.
What isWhat isbig databig data??
• Big data is a term for data sets that are so large or
complex that traditional data processing applications
are inadequate.
• Nowadays, huge databases are required by big
companies and proper analysis of this big data is a
necessity.
3.
Need forbig dataNeedforbig data analyticsanalytics
• Big data analytics examines large
amounts of data to uncover
hidden patterns, correlations and
other insights.
• Analytics proves helpful for:
(1)Cost Reduction.
(2)Faster, better decision making.
(3)New, smarter products and
services.
• Predictive analysis is facilitated
majorly by data visualization.
4.
Big DataBig DataVisualizationVisualization
• Data visualization is the
presentation of data in a
pictorial or graphical
format.
• It enables decision makers
to see analytics presented
visually, so they can grasp
difficult concepts or identify
new patterns.
• With interactive visualization, you can use
technology to drill down into charts and graphs for
more detail, interactively changing what data you
see and how it’s processed.
5.
How It WorksHowIt Works
• First, We integrate all the data, ordered and unordered
and store it together.
• Then analytics algorithms are used for effective analysis
of this huge data.
• The results are then displayed using techniques that help
the user to understand the data better.
6.
Big Data Visualizationas anBig Data Visualization as an
InterfaceInterface
• Visualization is the interface
between the data storage
and the user.
• The long, core process of
detailed analysis of data
takes place in the
background and the sorted,
analysed data is displayed in
the best form to the user. No
details are exposed to the
users.
7.
Importance ofImportance ofVisual AnalyticsVisual Analytics forfor
Big DataBig Data
• Using charts or graphs to
visualize large complex
data is a lot easier than
poring over spreadsheets
or reports.
• Data visualization is a
quick, easy way to convey
concepts in a universal
manner – and you can
experiment with different
scenarios by making slight
adjustments
8.
HumanHuman PerceptionPerception &Better& Better
UnderstandingUnderstanding
• A human eye can distinguish differences in line length, shape
orientation, and color (hue) readily without significant processing
effort. These are referred to as pre-attentive attributes.
• Cognition refers to processes in human beings like perception,
attention, learning, memory, thought, concept formation, reading,
and problem solving.
• The basis of data visualization evolved because as a picture is
worth a thousand words, data displayed graphically allows for an
easier comprehension of the information.
9.
CharacteristicsCharacteristics of GoodofGood
VisualizationVisualization
• avoid distorting what the data has to
say.
• present many numbers in a small space.
• make large data sets coherent.
• encourage the eye to compare different
pieces of data.
• reveal the data at several levels of detail
• serve a reasonably clear purpose:
description, exploration, tabulation or
decoration
• be closely integrated with the statistical
and verbal descriptions of a data set.
10.
3V’s3V’s andand 3C’s3C’sof Big Dataof Big Data
VisualizationVisualization
• 3 V’s of Big Data:
(1)Variety
(2)Volume
(3)Velocity
• 3 C’s Of Visualization:
(1)Coherence
(2)Context
(3)Cognition
Types ofTypes ofBasicBasic DiagramsDiagrams used forused for
Simple DataSimple Data VisualizationVisualization
• 1. Bar Charts
A bar chart or bar graph is
a chart that presents grouped data
with rectangular bars with lengths
proportional to the value that they
represent.
• 2. Histogram
A histogram is a graphical
representation of the distribution of
numerical data. It is an estimate of
the probability distribution of a
continuous variable (quantitative
variable)
13.
• 3. PieChart
A type of graph in which a
circle is divided into sectors
that each represent a
proportion of the whole.
• 4. 3D pie charts
Another dimension is added to
the above shown pie chart to
add more functionality.
14.
• 5. LineGraphs:
A line chart or line graph is
a type of chart which
displays information as a
series of data points called
'markers' connected by
straightline segments
• 6. Simple Tables:
The simple table consists of
rows and columns and the
data is accordingly placed in
corresponding cells.
15.
DiagramsDiagrams Used forUsedfor BigBig DataData
VisualizationVisualization
• 1. Scatter Plot
A scatter plot is a plot of the values of Y
versus the corresponding values of X:
Vertical axis: variable Y--usually the
response variable. Horizontal axis: variable
X--usually some variable we suspect may
ber related to the response.
• 2. 3D Scatter Plot
A 3D scatter plot allows the
visualization of multivariate data. A
dimension is added for additional
functionality.
16.
• 3. NetworkGraph:
Study of graphs, which are
mathematical structures used
to model pairwise relations
between objects. A graph in
this context is made up of
vertices, nodes, or points
which are connected by edges,
arcs, or lines.
• 4. Tree Maps:
A treemap is a visual method
for displaying hierarchical data
that uses nested rectangles to
represent the branches of a
tree diagram. Each rectangles
has an area proportional to the
amount of data it represents.
17.
• 5. StreamGraph:
A stream graph, is a type of
stacked area graph which is
displaced around a central
axis, resulting in a flowing,
organic shape.
• 6. Heat Map:
A heat map is a graphical
representation of data where
the individual values contained
in a matrix are represented as
colors. Fractal maps and
tree maps both often use a
similar system of color-coding
to represent the values taken
by a variable in a hierarchy.
18.
• 7.GANTT Chart:
Itis a chart in which a series of
horizontal lines shows the
amount of work done or
production completed in
certain periods of time in
relation to the amount planned
for those periods.
• 8. 3D Graphs:
A three-dimensional graph of a
relationship g (x, y, z ) among
three variables. A three-
dimensional graph is typically
drawn on a two-dimensional
page or screen using
perspective methods. Also
known as terrains.
19.
DecidingDeciding Which Visualis BestWhich Visual is Best
• One of the biggest challenges for business users is deciding which
visual should be used to best represent the information.
• When you’re first exploring a new data set, autocharts are especially
useful because they provide a quick view of large amounts of data.
This data exploration capability is helpful even to experienced
statisticians as they seek to speed up the analytics lifecycle process
because it eliminates the need for repeated sampling to determine
which data is appropriate for each model.
20.
How is itbeing used?How is it being used?
• Regardless of industry or size, all types of businesses are
using data visualization to help make sense of their data.
Here’s how:
• Comprehend information
quickly
• Identify relationships and
patterns
• Pinpoint emerging trends
• Communicate the story to
others
• Manipulate and interact
directly with data
Thinking fortheThinking fortheFutureFuture
• Data visualization is entering a new era. Emerging sources of
intelligence & theoretical developments in multidimensional
imaging are reshaping the potential value that analytics and
insights can provide, with visualization playing a key role. The
principles of effective data visualization won’t change. However,
next-gen technologies and evolving cognitive frameworks are
opening new horizons, moving data visualization from art to
science.
23.
ReferencesReferences
• [1] S.Y. Kung , “Visualization of Big Data”,
Cognitive Informatics & Cognitive Computing (ICCI*CC)
, pages. 447-449, 6-8 July 2015.
DOI: 10.1109/ICCI-CC.2015.7259428
• [2] I. Herman , G. Melancon ; M. S. Marshall,
“Graph Visualization and navigation” IEEE
Transactions on Visualization and Computer
Graphics (Volume:6 , Issue:1), Pages 24-43,
August 2002.
DOI: 10.1109/2945.841119
• [3] Deepa Gupta, Sameera Siddiqui; “Big data
Implementation and Visualization”, Advances in
Engineering and Technology Research (ICAETR),
2014 International Conference ,
pages-1-10, issue no. 2347-9337, July 2014.
DOI: 10.1109/ICAETR.2014.7012883