This document presents a study comparing 3D walkthroughs created using a game engine to photo stitching techniques for developing virtual tours. The study aims to demonstrate that a 3D walkthrough of a university facility created in Unreal Engine 4 provides advantages over a photo stitching approach. These advantages include improved realism, interactivity, and ease of updating the virtual tour when the real environment changes. Background research on related virtual tour projects and the limitations of photo stitching techniques is also provided.
![A Case Study on the Advantages of 3D
Walkthroughs over Photo Stitching Techniques
Kieran Latham(1)
, William Hurst(1)
, Nathan Shone (1)
, Abdennour El Rhalibi (1)
, Zhigeng Pan(2)
(1) Department of Computer Science
Liverpool John Moores University
Byrom Street
Liverpool, L3 3AF, UK
K.Latham@2013.ljmu.ac.uk, {W.Hurst, N.Shone,
A.Elrhalibi}@ljmu.ac.uk
(2) Digital Media and Interaction(DMI) Research Centre,
Hangzhou Normal University,
China
zgpan@cad.zju.edu.cn
Abstract—Virtual tours and interactive walkthroughs enable a
more in-depth platform for communicating information. Many current
techniques employ the use of Photo Stitching to accomplish this.
However, over the last decade advancements in computing power and
the accessibility of game engines, meant that developing rich 3D
content for virtual tours is more possiblethan ever before. As such, the
purpose of this paper is to present a study into the advantages of
developing an interactive 3D virtual tour of student facilities, using the
Unreal Development 4 Game Engine, for educational establishments.
The project aims to demonstrate a comparison between the use of
Photo Stitching and 3D Modelled interactive walkthrough for
developing rich visual environments. The research reveals that the
approach in this paper can improve educational facilities prominence
within universities, and contains many advantages over Photo
Stitching techniques.
Index Terms— Virtual Tour, 3D Modelling, Animation,
Education
1. INTRODUCTION
The use of visualisation and virtual reality can change the way
in which we see and interpret data in the world. The methods,
in which data is interacted with, can be essential for
comprehending information. Using 3D technologies simplifies
this process.It assists with understanding environments around
us and is used as a distribution metric for sharing information
readily with others.The current uses of3D technology for data
processing are diverse; ranging from visualising big data sets to
performing computer network modelling [1]. Virtual tours are
proven to have the ability to be applied to a number of
applications outside of video games (the industry that has taken
advantage of this technology for many years) such as tourism,
education and military. The applications are varied. However,
one commonality remains. The technology can be used for the
knowledge sharing process.A complex dataset,or a real-world
environment, can be understood and shared with others, once
visualisation techniques are applied [1, 2].
The growing use of 3D technology to create walkthroughs
and digitalise museums is an example of this. Information
access and knowledge transfer are more widely accessible to
anyone with an Internet connection. Existing projects, such as
CyArk, are an illustration of this [3]. They endeavour to
preserve heritage data for future generations by developing an
online 3D library of world cultural heritage sites. Other similar
techniques are used by museums to share information with the
wider online world. Projects, such as ARTtube, which profile
European museums, digitalise collections using Photo Stitching
to provide the global scientific community with access to data
gathered [4].
However, current digital ‘walkthroughs’ extend beyond
information sharing. In recent years, various museums exploit
the use of information and communication technologies to
enhance visitor experiences. With the emergence of innovative
virtual reality devices,such as the Oculus Rift [5] and Microsoft
HoloLens [6], it could be conceived that the uses of 3D
immersive technology are receiving.
It is this feature that this paper transfers over to the creation
of a tool for the visualisation of education establishment
facilities. The techniques presented take advantage of the latest
advances in software and hardware; particularly the
accessibility ofgame engine and 3D modelling software. In this
paper, the focus is on the development of a serious game, which
can be used to educate and train individuals about 3D
environments. The aim is to create a knowledge sharing tool,
which digitalises university facilities and makes them more
accessible to the wider audience.
Virtual reality technology combines the interaction between
digital data with the users’ view of the real world. The user is
completely immersed in an artificial environment. As such,the
research presented in this paper consists of four parts. Firstly, a
literature review into a related research on serious games,
gaming in education and the use of virtual tours is presented in
Section 2. Secondly a case study into current related 3D
walkthroughs is highlighted in Section 3. Thirdly, an approach
for the production of 2D and 3D assets is put forward in Section
4. Finally, the development and evaluation of the interactive
virtual tour, within a high level game engine, which allows the
userto explore and interact with the environment, is detailed in
Section 5.](https://image.slidesharecdn.com/3cd64fb1-2ec7-4fee-bad1-18ca0ddae4c4-161025140048/85/ICVRV_161-170-1-320.jpg)
![2. BACKGROUND
With the rising enthusiasm for the use of virtual reality
technologies in academia, there has been an increase in research
and case studies. In this section, related research projects are
discussed and used as guidance for the creation of the tool
presented in this paper.
A. Related Projects
The improved graphical capabilities of modern devices have
significantly increased the popularity of 3D and virtual tours.
Such solutions often offer significant benefits such as ease-of-
use, wider dissemination potential and greater accessibility.
Naturally, as a relatively infantile area, there are many
emerging and ongoing research projects.Hence, in this section,
we will examine some of the most current and pertinent
research in this area.
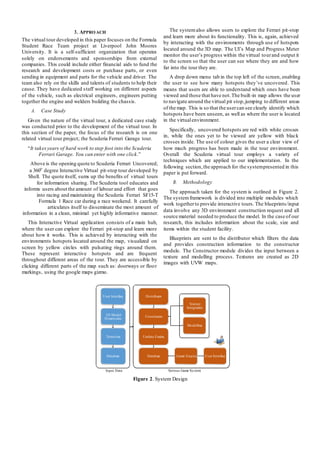
Bonacini [7] presents a 360-degree tour of the Paolo Orsi
Syracuse Archaeological Museum, which is based upon
Google’s Indoor Street view. It outlines the improved quality
of Google’s techniques forindoor tours,which offer significant
improvements to the quality of the virtual tour by preventing
collimation and image blurring. Similarly, Fineschi et al. [8]
propose a 3D tour of the Santa Maria Della Scala Museum
using the Oculus Rift virtual reality headset. This solution
involved the 360-degree capture of images from the museum
environment, which were combined into panoramic views and
a 3D visitor path throughout the museumwas overlaid onto this.
Gonzalez-Delgado et al. [9] also propose a virtual 3D tour,
focusing on paleontological heritage. Using geo-informatic
tools, they created virtual tours of three geo- referenced sites
supported by multi-thematic geospatialinformation. They used
various data sources such as digitalterrain data and orthophotos
data to create different thematic layers of satellite images of the
area.
A project aimed at University tours is that proposed by
Cosido et al. [10] whereby they created a prototype virtual geo-
referenced tour with high precision positioning and geometry
of objects and buildings. They utilize photogrammetry
(obtaining measurements from images) and differential GPS
data to obtain highly accurate three- dimensional measurements
and coordinates. Their motivation behind the work is to allow
access to artefacts held in non- public locations and build a
digitized archive so that in the eventuality of a building being
damaged, it can be accurately reconstructed.
The work by Noordin et al. [11] bears some resemblance to
the direction of the work outlined in this paper. They propose a
3D walkthrough virtual tourism application that can combine
both 3D modelling and marker based augmented reality to
overlay virtual 3D elements within the real environment.
There are also other elements of ongoing supplementary
research, such as that by Zhang et al. [12], which is looking at
using big data analytics to construct virtual tour schemas using
image clustering of popular tour photos. There is also
ongoing research examining the different ways in which to
provide improved user experiences, for example, the work by
Alletto et al. investigates the use of wearable cameras to
provide a first person perspective [13]. Additionally, studies
like those conducted by Chen and Mo [14] demonstrate the
wide-ranging use of 3D tour solutions. In their study, they
evaluate the use of a 3D tour as a training tool for new tour
guides, with promising results.
B. Digital Photo Stitching
Most of the existing virtual tour solutions found during our
literature review, involve the photographing of an environment
to produce still 2D images, which are then assembled to form a
pseudo-3D virtualised environment. This means that every part
of the environment needs to be photographed,which is a time -
consuming task. Also, it requires high levels of accuracy in the
photographs taken (e.g. positioning and height) to ensure
smooth transitioning between images, without blurring or
distortion. Although 2D images can provide a perfectly
adequate virtual tour, they have a number of inherent
limitations. Firstly, they lack a sense of realism, in that you
cannot sense perspective, depth, texture and often scale, which
can detract from the user experience and immersion into the
environment. Secondly, the level of interactivity available in
such approaches is often limited (such as clickable hotspotsand
modal boxes); hence, there is a need to provide extended
interactive capabilities (e.g. ability to rotate artefacts through
360 degrees). Finally, exhibits and tourist attractions are often
revised or restructured to ensure a continually engaging
experience. However, this can cause problems when it comes to
updating the virtual tours, as the whole environment will need
to be re- photographed and re-processed.
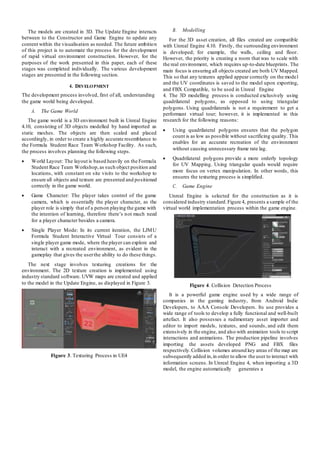
C. Digital Content Creation and Tools
There are many types of digital content creation tools which
provide different methods of creating digital content and
application. The tools can be divided into 2D, 3D, game engines
and multimedia development platform, and some of the
common digital creation content tools, in particular 3D tools,
Flash, Unity 3D and UE4 are introduced below.
3D Tools - Digital content creation tools for 3D include
Autodesk3D Studio Max, Cinema 4D and AutodeskMaya for
3D modelling, animation and rendering. The tools are used to
create 3D meshes as well as animations in 3D space. They are
also used to render graphics and animations. Autodesk
Mudbox, ZBrush and the free tool Blender are common tools
for sculpting 3D meshes as well as texture painting. There are
specialist tools for texture creation and texture.
Flash – Flash is a powerful tool that enables the creation and
animation of videos, games, websites and applications that can
combine all of these together. Multimedia is at the heart of
Flash meaning it is encouraged that many different types of
media are combined into one application. The multimedia
application can then be enhanced with the use of ActionScript;
coding to make objects animate or convert](https://image.slidesharecdn.com/3cd64fb1-2ec7-4fee-bad1-18ca0ddae4c4-161025140048/85/ICVRV_161-170-2-320.jpg)
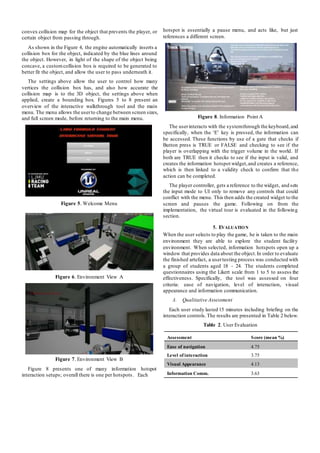
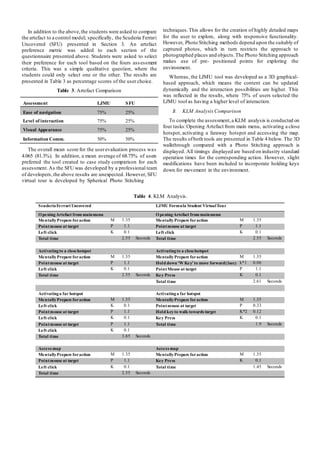
![Table 5. KLM Analysis.
SFU Total OperationTime 11.5 3D Tool Total Operation Time 8.51
Average task time 2.875 Average task time 2.1275
Table 5 displays the overall mean average task time for the
SFU Photo Sketch environment compared to the LJMU 3D
walkthrough. Using Table 4 as a reference point, it is possible
to calculate and compare individual tasks. For example,
accessing activating a close hotspot, the calculations are as
follows:
more detail, and the controller will provide a more
ergonomic method of control for the users.
Acknowledgments: The last author’s research work is
supported by national projects with grant no: 61332017
and 2015BAK04B00.
𝑆𝐹𝑈 = M + 𝑃 +K
LJM 𝑈 = M + (K∗ 𝑛)+ K
Scuderia Ferrari Uncovered is more efficient by 0.06
seconds. This due to a modified calculation within LJMU
Virtual Tour which calculates key press by the time it is held
down. Within the SFU environment, hotspots are activated by
clicking them on the screen; whereas LJMU Virtual Tour
requires the user to ‘walk’ up to themand interact.
Activating a far hotspot is calculated as follows:
𝑆𝐹𝑈 = M + K + P + K + P + K
LJMU = M + (P * n) + (K * n) + K
In this case, the LJMU 3D walkthrough is more efficient by
a 1.95 margin. This is due to users having to click and drag the
screen multiple times in Scuderia to be able to interact with a
hotspot.Within the 3Dmodelled environment, the useronly has
to walk over for an interaction. Overall, the total task times in
seconds for the artefacts were: 11.5 for Scuderia, and 8.51 for
LJMU, which average times being 2.875 and 2.1275
respectively.
6. CONCLUSIONAND FUTURE WORK
Specific considerations for the advancement of this research
include the following:
Console Support: One fact I discovered through testing,
was that a majority of users had access to a gaming
console,as well as a PC, the issue with PC is that each PC
is different hardware wise, and has differing responses to
my application, whereas a console version would work on
any console,and can reach more people effectively, so this
is an area of interest.
Online Multiplayer: As the student facility is a team
project, the virtual touris intended for use at open days and
fresher fairs. Therefore, the first consideration is that it will
be incorporated into an online mode for users to group up
and explore, with assigned moderators in-game to help
inform and enhance the experience of the user.
Racing Sim: Due to the nature of the team, and the
development made on the simulator by researchers, it is
possible to create a 3D simulation based on the actual car,
which could be imported into Unreal Engine, and create a
racing mini-game to demonstrate driver training.
Controller and VR support: Both these aspects are
considered for a future implementation process. The use of
VR will allow users to look around in depth, taking in
REFERENCES
[1] S. Okajima., & Y. Okada, Treecube 3D-ViSOM: Combinational
Visualization Tool for Browsing3DMultimedia Data,11thInternational
Conference on Information Visualization, IV '07, pp 40- 45, 2007
[2] H. Xu., W. Yu., L. Wei., N. Zhang., et al., An interactive system for
heterogeneous 3D volumetric data visualization, 5th International
Conference on Computer Science and Education (ICCSE), pp 24-27,
2010
[3] D. Walsh, WorldHeritage in Google Earth: 3D Models Across the Globe,
Available at [http://www.cyark.org/news/world-heritage-in- google-
earth-3d-models-across-the-globe], Accessed, June 2016
[4] Arttube, Videos About Art and Design, Available at
[http://www.arttube.nl/en?gclid=CKG3hufqvc0CFcsp0wodCGgMxQ],
Accessed June 2016
[5] W. Woodard.,& S. Sukittanon., Interactive virtual buildingwalkthrough
using Oculus Rift andMicrosoft Kinect, SoutheastCon, pp 1-3, 2015
[6] L. Avila., &M. Bailey.,Augment Your Reality, IEEEComputerGraphics
and Applications (Volume:36, Issue: 1), pp 6-7, 2016.
[7] Bonacini, E., The Paolo Orsi Syracuse Archaeological Museum pilot
project, in 2015 11th International Conference on Signal-image
technology & Internet-based Systems, Bangkok, Thailand, 2015
[8] Fineschi, A. & Pozzebon,A., A 3D Virtual Tour ofthe SantaMariaDella
Scala Museum Complex in Siena, Italy, basedon the use of Oculus Rift
HMD, in 2015 International Conference on3D Imaging(IC3D), Liege,
2015
[9] Gonzalez-Delgado, J. A., Martinez-Grana, A. M., Civis, J., Sierro, F. J.,
Goy, J. L., Dabrio, C. J., Ruiz, F.,Gonzalez-Regalado,M/ l/ & Abad, M.,
Virtual 3D tour of the Neogene paleontological heritage of Huelva
(Guadalquivir Basin, Spain), EnvironEarthSci, vol.73,no.8, pp. 4609-
4618, 2014.
[10] Cosido, O.,Teran,L.,Lopez, O. R.,Sarachaga, M.,Campi, M., Catuogno,
R., Gutierrez, N. G. & Latorre, E. M., 3D Tour through University
Spaces for the Management andDisseminationof the Cultural Heritage
of the UniversityofCantabria, in 2015Digital Heritage, Granada,2015.
[11] Noordin,M.,Ismail, I. &Yahya, M., Virtual Tourism Application through
3D Walkthrough: Flor De La Mar, in 7th International Conference on
Information Technology (ICIT), Seville, 2015.
[12] Zhang, D., Zheng, R. & Yang, G., Image Clusters Based3D Virtual Tour
Schema, in 5th International Conference on Software Engineering and
Service Science (ICSESS), Beijing, 2014.
[13] Alletto, S., Abati, D., Serra, G. & Cucchiara, R., ExploringArchitectural
Details Through a Wearable Egocentric Vision Device, Sensors, vol.
16, no. 2, 2016
[14] Chen, F, & Mo, H., Users’ Perspectives onandLearningEffectiveness of
Tour-Guide Training Courses With 3D Tourist Sites, Journal of
Teachingin Travel & Tourism, vol. 13, no. 4, pp. 374-390, 2013.
[15] C. Silenzi., Software Engineering in Ferrari F1, 37th IEEE International
Conference on Software Engineering, vol. 1, pp 1, 2015](https://image.slidesharecdn.com/3cd64fb1-2ec7-4fee-bad1-18ca0ddae4c4-161025140048/85/ICVRV_161-170-8-320.jpg)


