Download to read offline
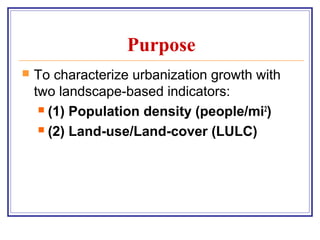
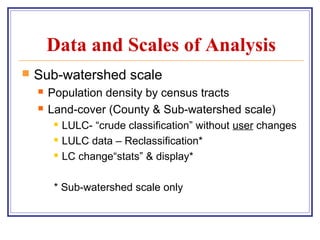

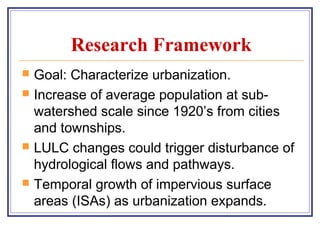
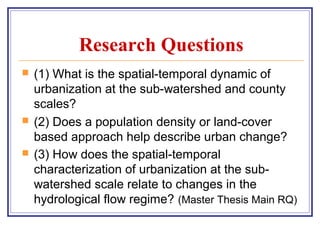
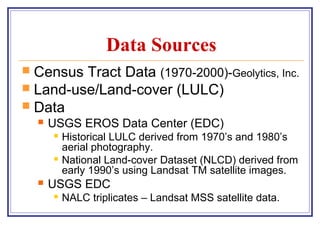


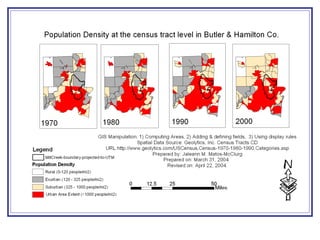
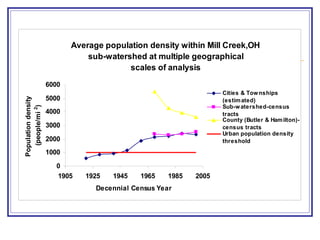
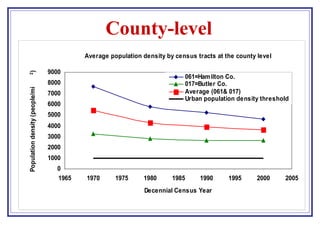
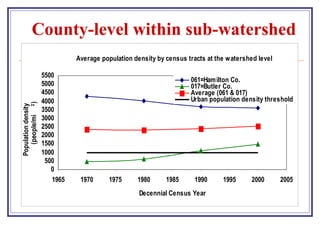

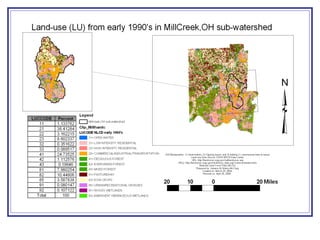


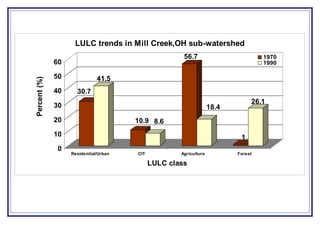
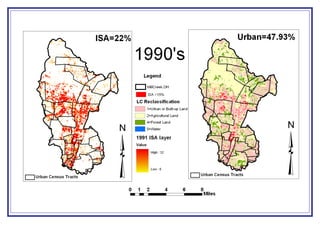

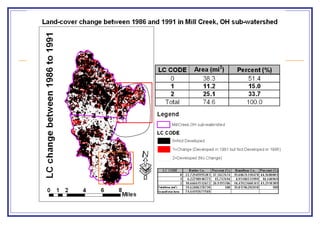
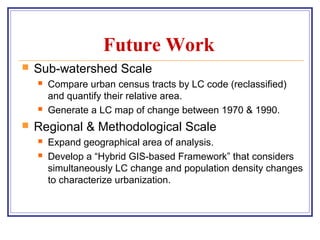


The document outlines a GIS-based study focusing on urbanization in the Mill Creek area of Ohio, analyzing population density and land-use/land-cover changes at the sub-watershed scale. It presents research questions related to the dynamics of urban change and its impact on hydrological flows, supported by various data sources and GIS data manipulation techniques. Future work aims to expand the geographical analysis and develop a hybrid framework to integrate land cover change with population density changes.


![[DSC Europe 25] Bojan Djuricic - Predictive Design Process.pdf](https://cdn.slidesharecdn.com/ss_thumbnails/5awdrbedqdek3gqu2ezy-4-the-predictive-design-bojan-djuricic-260120105856-6c399e9b-thumbnail.jpg?width=640&height=640&fit=bounds)


![[DSC Europe 25] Elena Menshikova - AI-Powered Operational Excellence: Revolut...](https://cdn.slidesharecdn.com/ss_thumbnails/es6nholbqy3zaao2c2yd-2-elena-menshikova-data-ai-in-decision-making-260115093812-4fba8b38-thumbnail.jpg?width=640&height=640&fit=bounds)

