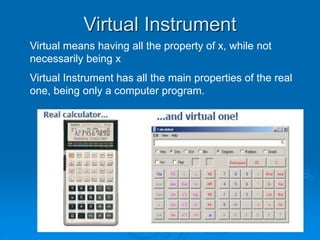
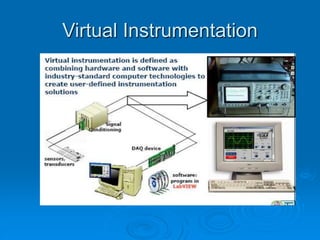
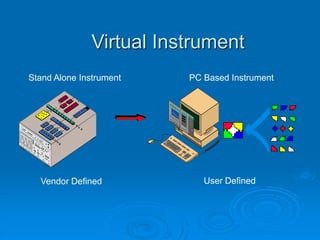
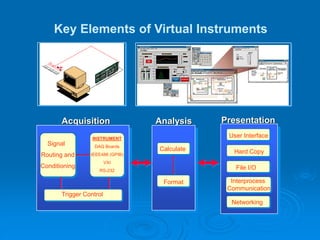
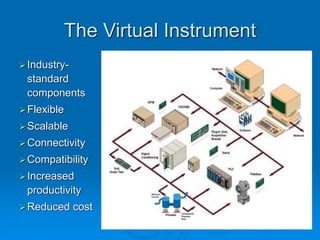
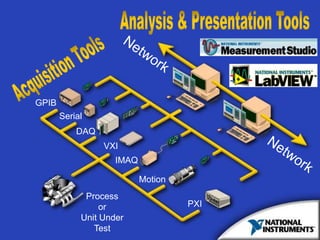
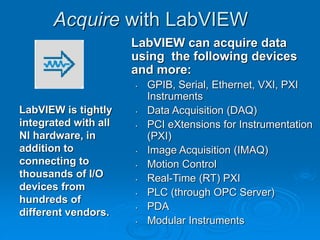
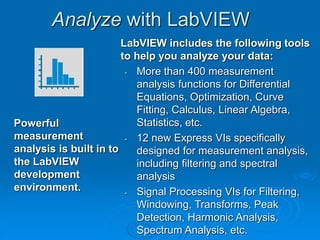
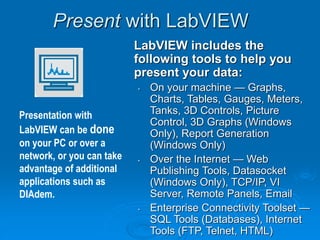
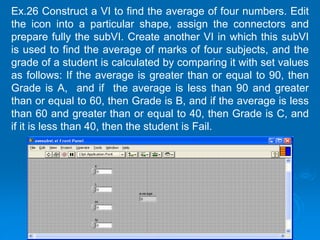
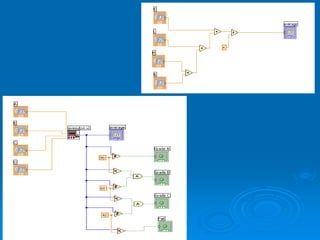
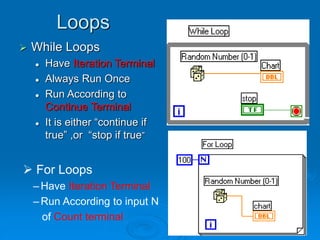
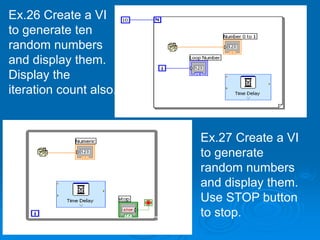
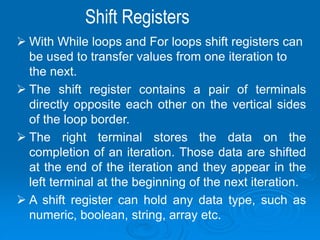
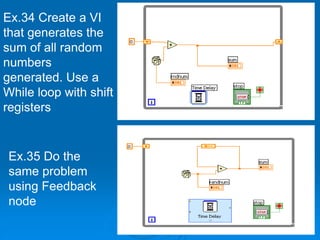
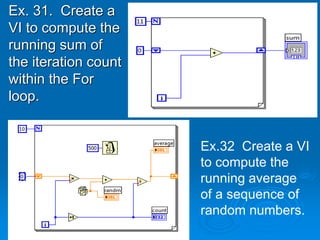
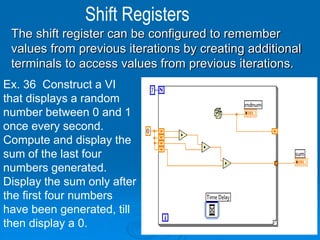
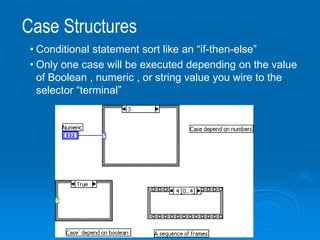
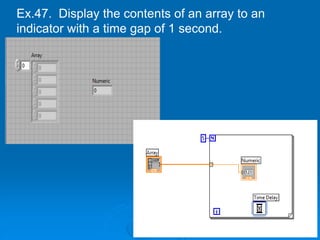
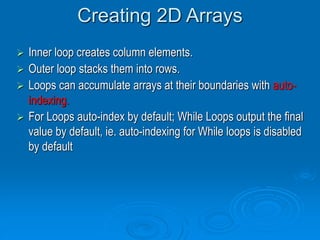
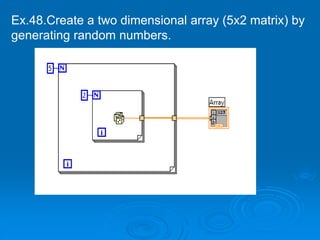
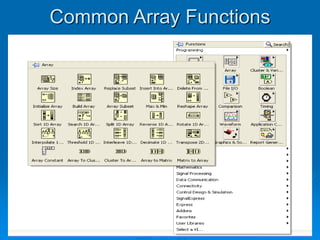
Virtual Instrumentation &
LabVIEW
An Introduction
Dr. (Mrs.) Lini Mathew
Associate Professor
Electrical Engineering Department
NITTTR, Chandigarh
Virtual Instrument
Virtual means having all the property of x, while not
necessarily being x
Virtual Instrument has all the main properties of the real
one, being only a computer program.
Virtual Instrumentation
Industry Standard Computers
equipped with
User Friendly Application Software,
Cost Effective Hardware and
Driver Software
that Together Perform the
Functions of Traditional Instruments
Virtual Instrument
P
R
O
C
E
S
S
O
R
B
U
S
C
o
n
d
it io
n
in
g
T
im
in
g
A / D
D
/ A
D
I/ O
T I/ O
D
I S
P
L
A
Y
A
N
D
C
O
N
T
R
O
L
4 8 8
P O
R
T
µ
P
M
a
t h
M
E M
O
R
Y
µ
P
R
O
M
P R O C E S S O R
B U S
C
o
n
d
it io
n
in
g
T im
in g
A
/
D
D
/ A
D
I/ O
T
I/ O
4 8 8
P O R T
µP
M a th
M E M O R Y
µ P
R O M
C
o
n
t
r
o
l
P
a
n
e
l
F
l o
w
P
r
e
s
s
u
r
e
A
l a
r
m
C
o
n
d
i t
i o
n
s
S
T
O
P
T
e
m
p
e
r
a
t
u
r
e
Stand Alone Instrument PC Based Instrument
Vendor Defined User Defined
Key Elements of Virtual Instruments
Acquisition Presentation
Analysis
Signal
Routing and
Conditioning
INSTRUMENT
DAQ Boards
IEEE488 (GPIB)
VXI
RS-232
Trigger Control
Format
Calculate
User Interface
Hard Copy
File I/O
Interprocess
Communication
Networking
The Virtual Instrument
Industry-
standard
components
Flexible
Scalable
Connectivity
Compatibility
Increased
productivity
Reduced cost
GPIB
Serial
DAQ
Process
or
Unit Under
Test
VXI
IMAQ
Motion
PXI
Acquire with LabVIEW
LabVIEW can acquire data
using the following devices
and more:
• GPIB, Serial, Ethernet, VXI, PXI
Instruments
• Data Acquisition (DAQ)
• PCI eXtensions for Instrumentation
(PXI)
• Image Acquisition (IMAQ)
• Motion Control
• Real-Time (RT) PXI
• PLC (through OPC Server)
• PDA
• Modular Instruments
LabVIEW is tightly
integrated with all
NI hardware, in
addition to
connecting to
thousands of I/O
devices from
hundreds of
different vendors.
Analyze with LabVIEW
LabVIEW includes the following tools
to help you analyze your data:
• More than 400 measurement
analysis functions for Differential
Equations, Optimization, Curve
Fitting, Calculus, Linear Algebra,
Statistics, etc.
• 12 new Express VIs specifically
designed for measurement analysis,
including filtering and spectral
analysis
• Signal Processing VIs for Filtering,
Windowing, Transforms, Peak
Detection, Harmonic Analysis,
Spectrum Analysis, etc.
Powerful
measurement
analysis is built in to
the LabVIEW
development
environment.
Present with LabVIEW
LabVIEW includes the
following tools to help you
present your data:
• On your machine — Graphs,
Charts, Tables, Gauges, Meters,
Tanks, 3D Controls, Picture
Control, 3D Graphs (Windows
Only), Report Generation
(Windows Only)
• Over the Internet — Web
Publishing Tools, Datasocket
(Windows Only), TCP/IP, VI
Server, Remote Panels, Email
• Enterprise Connectivity Toolset —
SQL Tools (Databases), Internet
Tools (FTP, Telnet, HTML)
Presentation with
LabVIEW can be done
on your PC or over a
network, or you can take
advantage of additional
applications such as
DIAdem.
What is LabVIEW?
LabVIEW – Laboratory Virtual
Instrumentation Engineering Workbench
 A graphical development environment (“G”)
 A dataflow language
 Has native multi-threaded parallel execution
 A hardware communication/control platform
 Can target real-time and embedded
hardware
LabVIEW Programs are called
Virtual Instruments (VI)
Front Panel
 Controls -- Inputs
 Indicators -- Outputs
Block Diagram
 Accompanying
“program” for front
panel
 Components “wired”
together
VI Front Panel
Front Panel
Toolbar
Graph
Legend
Boolean
Control
Waveform
Graph
Icon
Plot
Legend
Scale
Legend
VI Block Diagram
Numeric Constant
Thermometer
Terminal
Call to
subVI
While Loop
Knob
Terminal
Stop Button
Terminal
Stop Loop
Terminal
Temperature
Graph
Controls and Functions Palettes
Controls Palette
(Front Panel Window)
Functions Palette
(Block Diagram Window)
Operating Tool
Positioning/Resizing Tool
Labeling Tool
Wiring Tool
Shortcut Menu Tool
• Floating Palette
• Used to operate and modify front panel
and block diagram objects.
Scrolling Tool
Breakpoint Tool
Probe Tool
Color Copy Tool
Coloring Tool
Tools Palette
Automatic Selection Tool
Control
Terminals
Block Diagram Window
Front Panel Window
Indicator
Terminals
Creating a VI
Create a VI to add and subtract
two numbers
Creating a VI
nodes
control terminals
Connecting wire
Indicator
terminals
 Nodes are objects on the block diagram
that have inputs and/or outputs and
perform operations when a VI runs.
 They are analogous to statements,
operators, functions, and subroutines in
text-based programming languages.
Types of Nodes
• functions
• subVIs
• structures
Nodes
Functions are built-in execution elements,
comparable to an operator, function, or
statement.
SubVIs are VIs used on the block diagram of
another VI, comparable to subroutines.
Structures are process control elements,
such as Sequence structures, Case structures,
For Loops, or While Loops.
The Add and Subtract nodes in the previous
block diagram are function nodes
Nodes
Ex. 1. Create a VI to add two
numbers
Ex. 2. Create a VI program to
find the speed when
distance and time is given
Ex. 3. Create a VI to calculate
frequency (F) using time
period (T)
Ex. 4. Create a simple VI
which consists of a
knob and a waveform chart
Ex. 5. Create a simple VI which consists of a
dial and a thermometer
Ex.6 Create a VI to add two numbers
and compute the sine of the result
Mathematics  Elementary & Special Functions
Trigonometric Functions  Sine
Ex.6 Create a VI to add two numbers
and compute the sine of the result
Ex.7 Create a VI to calculate the
power of any number
Mathematics  Elementary & Special Functions
 Exponential Functions  Power of x
Ex.8 Create a VI to input five numbers and
find the average. Use the compound
arithmetic function
Ex.8 Create a VI which performs all the following
functions (i) Add two input numbers and display the
result (ii) Multiply the same two input numbers and
display the result (iii) Compare those same numbers
and turn ON an LED if they are equal.
• Block diagram executes
dependent on the flow of data;
block diagram does NOT
execute left to right
• Node executes when data is
available to ALL input terminals
• Nodes supply data to all output
terminals when done
Dataflow Programming
Debugging Techniques
• Finding Errors
• Execution Highlighting
• Probe
Click on broken Run button
Window showing error appears
Click on Execution Highlighting button; data
flow is animated using bubbles. Values are
displayed on wires.
Right-click on wire to display probe and it
shows data as it flows through wire segment
You can also select Probe tool from Tools
palette and click on wire
TYPES OF FUNCTIONS
 Functions: fundamental operating
elements of LabVIEW, no front panel or
block diagram (yellow)
 Standard VIs: modularized VIs customized
by wiring
 Express VIs: interactive VIs with
configurable dialog page (blue border)
Express VI
Ex.17 Create a VI
where a sinusoidal
signal can be
simulated and shown
through a waveform
graph. Suitable
controls may be
provided to change
the amplitude and
frequency of the
signal.
Express VI
Ex.19 Create a
VI to simulate a
noise filled
sinusoidal signal
and filter it.
Display both the
waveforms on
one graph.
Ex.20 Construct a
VI to accept five
numeric inputs, add
them up and
display the result
on a gauge, and
light up a round
light if the sum of
the input numbers
is less than 18.0.
The light should
light up in green
and the gauge dial
should be yellow.
Ex.22 Create a dial
control that goes
from 0 to 2, with
three LED displays:
one green, one
yellow, and one
red. Have the VI
turn the LED green
when the dial is on
0, yellow when the
dial is on1, and red
when the dial is on
2.
Ex.22 Create a
front panel that has
8 LED indicators
and a numeric
control. The
problem is to turn
on the 8 LEDs into
a binary (base 2)
representation for
any number given.
SubVI
 A SubVI is a VI that can be
used within another VI
 Advantages
 Modular
 Easier to debug
 Don’t have to recreate code
 Require less memory
avergesubvi
Icon and Connector
 An icon represents a VI in
other block diagrams
 A connector shows available
terminals for data transfer
Icon
Connector
Terminals
Ex.26 Construct a VI to find the average of four numbers. Edit
the icon into a particular shape, assign the connectors and
prepare fully the subVI. Create another VI in which this subVI
is used to find the average of marks of four subjects, and the
grade of a student is calculated by comparing it with set values
as follows: If the average is greater than or equal to 90, then
Grade is A, and if the average is less than 90 and greater
than or equal to 60, then Grade is B, and if the average is less
than 60 and greater than or equal to 40, then Grade is C, and
if it is less than 40, then the student is Fail.
Steps to Create a SubVI
 Create the Icon
 Create the Connector
 Assign Terminals
 Save the VI
 Insert the VI into a Top Level VI
SubVI
Create the Icon
 Right-click on the icon in the block diagram
or front panel
SubVI
Create the Connector
 Right-click on the icon pane in the front
panel only
SubVI
Assign Terminals
SubVI
Save the VI
 Choose an Easy to Remember Location
 Organize by Functionality
Save Similar VIs into one directory
 Organize by Application
Save all VIs Used for a Specific Application into one
directory or library file
SubVI
Insert the subVI into a Top Level VI
Accessing user-made subVIs
Functions --> Select a VI
OR
Drag icon onto target diagram
SubVI
Loops
 While Loops
 Have Iteration Terminal
 Always Run Once
 Run According to
Continue Terminal
 It is either “continue if
true” ,or “stop if true”
 For Loops
– Have Iteration Terminal
– Run According to input N
of Count terminal
Ex.26 Create a VI
to generate ten
random numbers
and display them.
Display the
iteration count also.
Ex.27 Create a VI
to generate
random numbers
and display them.
Use STOP button
to stop.
Ex. 28 Create a VI to add two numbers. The
program ends by using a STOP button.
Ex. 29 Create a VI to display all numbers less
than or equal to a given number and then
stop
Ex. 30 Create a VI to generate random
numbers and display them. If the value of
the number is greater than 0.5 then the loop
stops.
Shift Registers
 With While loops and For loops shift registers can
be used to transfer values from one iteration to
the next.
 The shift register contains a pair of terminals
directly opposite each other on the vertical sides
of the loop border.
 The right terminal stores the data on the
completion of an iteration. Those data are shifted
at the end of the iteration and they appear in the
left terminal at the beginning of the next iteration.
 A shift register can hold any data type, such as
numeric, boolean, string, array etc.
Ex.34 Create a VI
that generates the
sum of all random
numbers
generated. Use a
While loop with shift
registers
Ex.35 Do the
same problem
using Feedback
node
Ex. 31. Create a
VI to compute the
running sum of
the iteration count
within the For
loop.
Ex.32 Create a VI
to compute the
running average
of a sequence of
random numbers.
The shift register can be configured to remember
values from previous iterations by creating additional
terminals to access values from previous iterations.
Shift Registers
Ex. 36 Construct a VI
that displays a random
number between 0 and 1
once every second.
Compute and display the
sum of the last four
numbers generated.
Display the sum only after
the first four numbers
have been generated, till
then display a 0.
Case Structures
• Conditional statement sort like an “if-then-else”
• Only one case will be executed depending on the value
of Boolean , numeric , or string value you wire to the
selector “terminal”
Case Structures
 Enclose nodes or drag them inside the structure
 Stacked like a deck of cards, only one case visible
Ex.37 Build a VI that computes the ratio of two numbers. If the
denominator is zero, the VI outputs infinity to the front panel and
causes the system to make a beep sound. If the denominator is
not zero, the ratio is computed and displayed on the front panel.
Use CASE structure.
Formula Nodes
 Implement complicated equations
 Variables created at border
 Variable names are case sensitive
 Each statement must terminate with a semicolon (;)
 Context Help Window shows available functions
Note semicolon
formunode1, formunode12
Ex.39 Build a VI that computes the value of the equation
y = x – e*sinx by using a formula node. Compare the results by
computing the value using numeric functions
Ex.40 Build a VI that computes the ratio of two numbers by using
a formula node. If the denominator is zero, the VI outputs infinity
to the front panel and if the denominator is not zero, the ratio is
computed and displayed on the front panel.
Ex.40 Build a VI that computes the ratio of two numbers by using
a formula node. If the denominator is zero, the VI outputs infinity
to the front panel and if the denominator is not zero, the ratio is
computed and displayed on the front panel.
Ex. 41. Build a VI to compute y = mx + c using formula node,
where m and c are constants and x varies from 0 to 29. Put
a delay also which helps to view the values slowly.
Ex. 42. Develop a VI to convert temperature in degree
Celsius to degree Fahrenheit by means of the expression
F = 9/5 C+32. Use formula node.
Ex.43. Create a VI to write a code in the formula node and
get the output according to it. The value of x is generated
and varied from 1 to 10. The code is :
If (x>=5) y=1, z=2;
Else y=0, z=0
Use also the conditional branching statement in the
formula node and compare the results.
y=(x>=5)?1:0
z=(x>=5)?2:0
Arrays
 Collections of data elements of the same type.
 One or more dimensions, up to 231 -1 elements per dimension
 Elements accessed by their index; first element is index 0
 Arrays can be of numeric, boolean, string and cluster data
types
Ex. 46. Create an
array of 4 numbers by
generating random
numbers.
Ex.47. Display the contents of an array to an
indicator with a time gap of 1 second.
Creating 2D Arrays
 Inner loop creates column elements.
 Outer loop stacks them into rows.
 Loops can accumulate arrays at their boundaries with auto-
indexing.
 For Loops auto-index by default; While Loops output the final
value by default, ie. auto-indexing for While loops is disabled
by default
Ex.48.Create a two dimensional array (5x2 matrix) by
generating random numbers.
Common Array Functions
Ex.50. Create a VI to initialize an array with a
particular element, specify the size of the array also.
52. Create a 3x2 matrix. Append a scalar number, a
2x3 matrix and another 2x2 matrix to the initial matrix,
so that you obtain an 8x3 matrix.
Clusters
 Cluster is a data structure that groups data of
different types ( Numeric , Boolean etc.)
 It is analogous to structures in C.
 Bundling several data elements into clusters
eliminates wire clutter on the block diagram
 It also reduces the number of connector pane
terminals that subVIs need by passing several
values to one terminal.
 Cluster elements have a logical order .
Clusters
 The main cluster operations are:
 Bundle
 Unbundle
 Bundle by name
 unbundle by name
 The bundle function assembles individual
components into a single new cluster and
allows you to replace elements in an existing
order.
 The unbundle function splits the cluster into its
individual elements
Clusters
 When it is required to operate on a few elements
and not the entire cluster elements , the bundle by
name function is used.
 They are referenced by names rather than by
position.
 The unbundle by name function returns the cluster
elements whose names are specified.
 Error clusters tell you why and where errors
occur.
Ex.63 Build a VI to create a new cluster using
bundle function from three inputs: a floating point
real number, an integer, and an array of numbers
generated by a For loop.
Ex.65 Build a VI to unbundle the elements of a
cluster. The cluster has four elements: a numeric
control, a toggle switch, a string indicator, and a
knob control. Each element should indicate the
values in its own individual indicator outside the
cluster.
Charts and Graphs
 Waveform Charts interactively plot data,
appending new data to old so that you can see the
current value in the context of previous data, as
the new data become available.
 Waveform Graphs plot pre-generated arrays of
values.
 The graph also accepts several data types such
as arrays, dynamic data type etc.
 They display data typically acquired at a constant
rate
Charts and Graphs
 X Y Graphs display data acquired at a non-
constant rate and data for multi valued functions.
 X Y Graphs are Cartesian graphing objects that
plots multi valued functions with a varying time
base
 Can display Nyquist planes, Nichols planes, s
planes and z planes.
Charts and Graphs
Build a VI that generates 50 random numbers and
plot it on a waveform chart and also on a waveform
graph. Use For Loop
Build a VI to plot a unit circle by using sine and
cosine function. Use Express XY graph
Compute the equation y = x2 + 2x + 5 for x
ranging from 1 to 10 in steps of 0.2 and plot them
on a suitable waveform . Use XY graph
Ex.65. The logistic difference equation
xk+1 = r xk (1-xk) where k = 0,1,2……., r is the rate of
population growth and x0 is the given initial value, has
been used as a model to study population growth
patterns. The model has been scaled so that the values
of the population vary between 0 and 1, where 0
represents extinction and 1 represents the maximum
conceivable population. Build a VI using a formula node
containing the logistic difference equation as y=rx(1-x)
and calculate 30 values and plot on a waveform graph.
Let x0 be 0.02. If the populations falls below zero, set it
to exactly zero ie. population is extinct. Write your
conclusion by changing the values of r (rate of growth),
(i) for value of 1<r<3 (ii) 3<r<4 (iii) for r>4.
Strings
 A string is a sequence of displayable or non displayable
characters (ASCII)
 There are many built in functions in LabVIEW to help in
manipulating strings
Strings
Ex.69. Create a VI to find the length of a
string.
Ex.70. Create a VI to concatenate three
strings and make a single string.
Ex.71. Create a VI to cut apart a part of a
string, by specifying the point at which it is
to be cut and the length to be cut.
Ex.72. Create a VI for the following string
operations (i) to convert a string to
uppercase characters (ii) to convert a
string to lowercase characters (iii) to rotate
a string (iv) to reserve a string.
Ex.73. Create a VI that concatenates a
message string, a numeric and a unit
string, eg., “Set to 10.24 volts” by
specifying formats.

Virtual Instrumentation & LabVIEW-lini.ppt

  • 1.
    Virtual Instrumentation & LabVIEW AnIntroduction Dr. (Mrs.) Lini Mathew Associate Professor Electrical Engineering Department NITTTR, Chandigarh
  • 2.
    Virtual Instrument Virtual meanshaving all the property of x, while not necessarily being x Virtual Instrument has all the main properties of the real one, being only a computer program.
  • 3.
  • 4.
    Virtual Instrumentation Industry StandardComputers equipped with User Friendly Application Software, Cost Effective Hardware and Driver Software that Together Perform the Functions of Traditional Instruments
  • 5.
    Virtual Instrument P R O C E S S O R B U S C o n d it io n in g T im in g A/ D D / A D I/ O T I/ O D I S P L A Y A N D C O N T R O L 4 8 8 P O R T µ P M a t h M E M O R Y µ P R O M P R O C E S S O R B U S C o n d it io n in g T im in g A / D D / A D I/ O T I/ O 4 8 8 P O R T µP M a th M E M O R Y µ P R O M C o n t r o l P a n e l F l o w P r e s s u r e A l a r m C o n d i t i o n s S T O P T e m p e r a t u r e Stand Alone Instrument PC Based Instrument Vendor Defined User Defined
  • 6.
    Key Elements ofVirtual Instruments Acquisition Presentation Analysis Signal Routing and Conditioning INSTRUMENT DAQ Boards IEEE488 (GPIB) VXI RS-232 Trigger Control Format Calculate User Interface Hard Copy File I/O Interprocess Communication Networking
  • 7.
  • 8.
  • 9.
    Acquire with LabVIEW LabVIEWcan acquire data using the following devices and more: • GPIB, Serial, Ethernet, VXI, PXI Instruments • Data Acquisition (DAQ) • PCI eXtensions for Instrumentation (PXI) • Image Acquisition (IMAQ) • Motion Control • Real-Time (RT) PXI • PLC (through OPC Server) • PDA • Modular Instruments LabVIEW is tightly integrated with all NI hardware, in addition to connecting to thousands of I/O devices from hundreds of different vendors.
  • 10.
    Analyze with LabVIEW LabVIEWincludes the following tools to help you analyze your data: • More than 400 measurement analysis functions for Differential Equations, Optimization, Curve Fitting, Calculus, Linear Algebra, Statistics, etc. • 12 new Express VIs specifically designed for measurement analysis, including filtering and spectral analysis • Signal Processing VIs for Filtering, Windowing, Transforms, Peak Detection, Harmonic Analysis, Spectrum Analysis, etc. Powerful measurement analysis is built in to the LabVIEW development environment.
  • 11.
    Present with LabVIEW LabVIEWincludes the following tools to help you present your data: • On your machine — Graphs, Charts, Tables, Gauges, Meters, Tanks, 3D Controls, Picture Control, 3D Graphs (Windows Only), Report Generation (Windows Only) • Over the Internet — Web Publishing Tools, Datasocket (Windows Only), TCP/IP, VI Server, Remote Panels, Email • Enterprise Connectivity Toolset — SQL Tools (Databases), Internet Tools (FTP, Telnet, HTML) Presentation with LabVIEW can be done on your PC or over a network, or you can take advantage of additional applications such as DIAdem.
  • 12.
    What is LabVIEW? LabVIEW– Laboratory Virtual Instrumentation Engineering Workbench  A graphical development environment (“G”)  A dataflow language  Has native multi-threaded parallel execution  A hardware communication/control platform  Can target real-time and embedded hardware
  • 13.
    LabVIEW Programs arecalled Virtual Instruments (VI) Front Panel  Controls -- Inputs  Indicators -- Outputs Block Diagram  Accompanying “program” for front panel  Components “wired” together
  • 14.
    VI Front Panel FrontPanel Toolbar Graph Legend Boolean Control Waveform Graph Icon Plot Legend Scale Legend
  • 15.
    VI Block Diagram NumericConstant Thermometer Terminal Call to subVI While Loop Knob Terminal Stop Button Terminal Stop Loop Terminal Temperature Graph
  • 16.
    Controls and FunctionsPalettes Controls Palette (Front Panel Window) Functions Palette (Block Diagram Window)
  • 17.
    Operating Tool Positioning/Resizing Tool LabelingTool Wiring Tool Shortcut Menu Tool • Floating Palette • Used to operate and modify front panel and block diagram objects. Scrolling Tool Breakpoint Tool Probe Tool Color Copy Tool Coloring Tool Tools Palette Automatic Selection Tool
  • 18.
    Control Terminals Block Diagram Window FrontPanel Window Indicator Terminals Creating a VI Create a VI to add and subtract two numbers
  • 19.
    Creating a VI nodes controlterminals Connecting wire Indicator terminals
  • 20.
     Nodes areobjects on the block diagram that have inputs and/or outputs and perform operations when a VI runs.  They are analogous to statements, operators, functions, and subroutines in text-based programming languages. Types of Nodes • functions • subVIs • structures Nodes
  • 21.
    Functions are built-inexecution elements, comparable to an operator, function, or statement. SubVIs are VIs used on the block diagram of another VI, comparable to subroutines. Structures are process control elements, such as Sequence structures, Case structures, For Loops, or While Loops. The Add and Subtract nodes in the previous block diagram are function nodes Nodes
  • 22.
    Ex. 1. Createa VI to add two numbers
  • 25.
    Ex. 2. Createa VI program to find the speed when distance and time is given
  • 26.
    Ex. 3. Createa VI to calculate frequency (F) using time period (T)
  • 27.
    Ex. 4. Createa simple VI which consists of a knob and a waveform chart
  • 28.
    Ex. 5. Createa simple VI which consists of a dial and a thermometer
  • 29.
    Ex.6 Create aVI to add two numbers and compute the sine of the result Mathematics  Elementary & Special Functions Trigonometric Functions  Sine
  • 30.
    Ex.6 Create aVI to add two numbers and compute the sine of the result
  • 31.
    Ex.7 Create aVI to calculate the power of any number Mathematics  Elementary & Special Functions  Exponential Functions  Power of x
  • 32.
    Ex.8 Create aVI to input five numbers and find the average. Use the compound arithmetic function
  • 33.
    Ex.8 Create aVI which performs all the following functions (i) Add two input numbers and display the result (ii) Multiply the same two input numbers and display the result (iii) Compare those same numbers and turn ON an LED if they are equal.
  • 34.
    • Block diagramexecutes dependent on the flow of data; block diagram does NOT execute left to right • Node executes when data is available to ALL input terminals • Nodes supply data to all output terminals when done Dataflow Programming
  • 35.
    Debugging Techniques • FindingErrors • Execution Highlighting • Probe Click on broken Run button Window showing error appears Click on Execution Highlighting button; data flow is animated using bubbles. Values are displayed on wires. Right-click on wire to display probe and it shows data as it flows through wire segment You can also select Probe tool from Tools palette and click on wire
  • 36.
    TYPES OF FUNCTIONS Functions: fundamental operating elements of LabVIEW, no front panel or block diagram (yellow)  Standard VIs: modularized VIs customized by wiring  Express VIs: interactive VIs with configurable dialog page (blue border)
  • 37.
  • 38.
    Ex.17 Create aVI where a sinusoidal signal can be simulated and shown through a waveform graph. Suitable controls may be provided to change the amplitude and frequency of the signal. Express VI
  • 39.
    Ex.19 Create a VIto simulate a noise filled sinusoidal signal and filter it. Display both the waveforms on one graph.
  • 40.
    Ex.20 Construct a VIto accept five numeric inputs, add them up and display the result on a gauge, and light up a round light if the sum of the input numbers is less than 18.0. The light should light up in green and the gauge dial should be yellow.
  • 41.
    Ex.22 Create adial control that goes from 0 to 2, with three LED displays: one green, one yellow, and one red. Have the VI turn the LED green when the dial is on 0, yellow when the dial is on1, and red when the dial is on 2.
  • 42.
    Ex.22 Create a frontpanel that has 8 LED indicators and a numeric control. The problem is to turn on the 8 LEDs into a binary (base 2) representation for any number given.
  • 43.
    SubVI  A SubVIis a VI that can be used within another VI  Advantages  Modular  Easier to debug  Don’t have to recreate code  Require less memory avergesubvi
  • 44.
    Icon and Connector An icon represents a VI in other block diagrams  A connector shows available terminals for data transfer Icon Connector Terminals
  • 45.
    Ex.26 Construct aVI to find the average of four numbers. Edit the icon into a particular shape, assign the connectors and prepare fully the subVI. Create another VI in which this subVI is used to find the average of marks of four subjects, and the grade of a student is calculated by comparing it with set values as follows: If the average is greater than or equal to 90, then Grade is A, and if the average is less than 90 and greater than or equal to 60, then Grade is B, and if the average is less than 60 and greater than or equal to 40, then Grade is C, and if it is less than 40, then the student is Fail.
  • 47.
    Steps to Createa SubVI  Create the Icon  Create the Connector  Assign Terminals  Save the VI  Insert the VI into a Top Level VI SubVI
  • 48.
    Create the Icon Right-click on the icon in the block diagram or front panel SubVI
  • 49.
    Create the Connector Right-click on the icon pane in the front panel only SubVI
  • 50.
  • 51.
    Save the VI Choose an Easy to Remember Location  Organize by Functionality Save Similar VIs into one directory  Organize by Application Save all VIs Used for a Specific Application into one directory or library file SubVI
  • 52.
    Insert the subVIinto a Top Level VI Accessing user-made subVIs Functions --> Select a VI OR Drag icon onto target diagram SubVI
  • 53.
    Loops  While Loops Have Iteration Terminal  Always Run Once  Run According to Continue Terminal  It is either “continue if true” ,or “stop if true”  For Loops – Have Iteration Terminal – Run According to input N of Count terminal
  • 54.
    Ex.26 Create aVI to generate ten random numbers and display them. Display the iteration count also. Ex.27 Create a VI to generate random numbers and display them. Use STOP button to stop.
  • 55.
    Ex. 28 Createa VI to add two numbers. The program ends by using a STOP button. Ex. 29 Create a VI to display all numbers less than or equal to a given number and then stop Ex. 30 Create a VI to generate random numbers and display them. If the value of the number is greater than 0.5 then the loop stops.
  • 56.
    Shift Registers  WithWhile loops and For loops shift registers can be used to transfer values from one iteration to the next.  The shift register contains a pair of terminals directly opposite each other on the vertical sides of the loop border.  The right terminal stores the data on the completion of an iteration. Those data are shifted at the end of the iteration and they appear in the left terminal at the beginning of the next iteration.  A shift register can hold any data type, such as numeric, boolean, string, array etc.
  • 57.
    Ex.34 Create aVI that generates the sum of all random numbers generated. Use a While loop with shift registers Ex.35 Do the same problem using Feedback node
  • 58.
    Ex. 31. Createa VI to compute the running sum of the iteration count within the For loop. Ex.32 Create a VI to compute the running average of a sequence of random numbers.
  • 59.
    The shift registercan be configured to remember values from previous iterations by creating additional terminals to access values from previous iterations. Shift Registers Ex. 36 Construct a VI that displays a random number between 0 and 1 once every second. Compute and display the sum of the last four numbers generated. Display the sum only after the first four numbers have been generated, till then display a 0.
  • 60.
    Case Structures • Conditionalstatement sort like an “if-then-else” • Only one case will be executed depending on the value of Boolean , numeric , or string value you wire to the selector “terminal”
  • 61.
    Case Structures  Enclosenodes or drag them inside the structure  Stacked like a deck of cards, only one case visible
  • 62.
    Ex.37 Build aVI that computes the ratio of two numbers. If the denominator is zero, the VI outputs infinity to the front panel and causes the system to make a beep sound. If the denominator is not zero, the ratio is computed and displayed on the front panel. Use CASE structure.
  • 63.
    Formula Nodes  Implementcomplicated equations  Variables created at border  Variable names are case sensitive  Each statement must terminate with a semicolon (;)  Context Help Window shows available functions Note semicolon formunode1, formunode12
  • 64.
    Ex.39 Build aVI that computes the value of the equation y = x – e*sinx by using a formula node. Compare the results by computing the value using numeric functions
  • 65.
    Ex.40 Build aVI that computes the ratio of two numbers by using a formula node. If the denominator is zero, the VI outputs infinity to the front panel and if the denominator is not zero, the ratio is computed and displayed on the front panel.
  • 66.
    Ex.40 Build aVI that computes the ratio of two numbers by using a formula node. If the denominator is zero, the VI outputs infinity to the front panel and if the denominator is not zero, the ratio is computed and displayed on the front panel.
  • 67.
    Ex. 41. Builda VI to compute y = mx + c using formula node, where m and c are constants and x varies from 0 to 29. Put a delay also which helps to view the values slowly. Ex. 42. Develop a VI to convert temperature in degree Celsius to degree Fahrenheit by means of the expression F = 9/5 C+32. Use formula node. Ex.43. Create a VI to write a code in the formula node and get the output according to it. The value of x is generated and varied from 1 to 10. The code is : If (x>=5) y=1, z=2; Else y=0, z=0 Use also the conditional branching statement in the formula node and compare the results. y=(x>=5)?1:0 z=(x>=5)?2:0
  • 68.
    Arrays  Collections ofdata elements of the same type.  One or more dimensions, up to 231 -1 elements per dimension  Elements accessed by their index; first element is index 0  Arrays can be of numeric, boolean, string and cluster data types Ex. 46. Create an array of 4 numbers by generating random numbers.
  • 69.
    Ex.47. Display thecontents of an array to an indicator with a time gap of 1 second.
  • 70.
    Creating 2D Arrays Inner loop creates column elements.  Outer loop stacks them into rows.  Loops can accumulate arrays at their boundaries with auto- indexing.  For Loops auto-index by default; While Loops output the final value by default, ie. auto-indexing for While loops is disabled by default
  • 71.
    Ex.48.Create a twodimensional array (5x2 matrix) by generating random numbers.
  • 72.
  • 73.
    Ex.50. Create aVI to initialize an array with a particular element, specify the size of the array also.
  • 74.
    52. Create a3x2 matrix. Append a scalar number, a 2x3 matrix and another 2x2 matrix to the initial matrix, so that you obtain an 8x3 matrix.
  • 75.
    Clusters  Cluster isa data structure that groups data of different types ( Numeric , Boolean etc.)  It is analogous to structures in C.  Bundling several data elements into clusters eliminates wire clutter on the block diagram  It also reduces the number of connector pane terminals that subVIs need by passing several values to one terminal.  Cluster elements have a logical order .
  • 76.
    Clusters  The maincluster operations are:  Bundle  Unbundle  Bundle by name  unbundle by name  The bundle function assembles individual components into a single new cluster and allows you to replace elements in an existing order.  The unbundle function splits the cluster into its individual elements
  • 77.
    Clusters  When itis required to operate on a few elements and not the entire cluster elements , the bundle by name function is used.  They are referenced by names rather than by position.  The unbundle by name function returns the cluster elements whose names are specified.  Error clusters tell you why and where errors occur.
  • 78.
    Ex.63 Build aVI to create a new cluster using bundle function from three inputs: a floating point real number, an integer, and an array of numbers generated by a For loop. Ex.65 Build a VI to unbundle the elements of a cluster. The cluster has four elements: a numeric control, a toggle switch, a string indicator, and a knob control. Each element should indicate the values in its own individual indicator outside the cluster.
  • 79.
    Charts and Graphs Waveform Charts interactively plot data, appending new data to old so that you can see the current value in the context of previous data, as the new data become available.  Waveform Graphs plot pre-generated arrays of values.  The graph also accepts several data types such as arrays, dynamic data type etc.  They display data typically acquired at a constant rate
  • 80.
    Charts and Graphs X Y Graphs display data acquired at a non- constant rate and data for multi valued functions.  X Y Graphs are Cartesian graphing objects that plots multi valued functions with a varying time base  Can display Nyquist planes, Nichols planes, s planes and z planes.
  • 81.
    Charts and Graphs Builda VI that generates 50 random numbers and plot it on a waveform chart and also on a waveform graph. Use For Loop Build a VI to plot a unit circle by using sine and cosine function. Use Express XY graph Compute the equation y = x2 + 2x + 5 for x ranging from 1 to 10 in steps of 0.2 and plot them on a suitable waveform . Use XY graph
  • 82.
    Ex.65. The logisticdifference equation xk+1 = r xk (1-xk) where k = 0,1,2……., r is the rate of population growth and x0 is the given initial value, has been used as a model to study population growth patterns. The model has been scaled so that the values of the population vary between 0 and 1, where 0 represents extinction and 1 represents the maximum conceivable population. Build a VI using a formula node containing the logistic difference equation as y=rx(1-x) and calculate 30 values and plot on a waveform graph. Let x0 be 0.02. If the populations falls below zero, set it to exactly zero ie. population is extinct. Write your conclusion by changing the values of r (rate of growth), (i) for value of 1<r<3 (ii) 3<r<4 (iii) for r>4.
  • 83.
    Strings  A stringis a sequence of displayable or non displayable characters (ASCII)  There are many built in functions in LabVIEW to help in manipulating strings
  • 84.
    Strings Ex.69. Create aVI to find the length of a string. Ex.70. Create a VI to concatenate three strings and make a single string.
  • 85.
    Ex.71. Create aVI to cut apart a part of a string, by specifying the point at which it is to be cut and the length to be cut. Ex.72. Create a VI for the following string operations (i) to convert a string to uppercase characters (ii) to convert a string to lowercase characters (iii) to rotate a string (iv) to reserve a string.
  • 86.
    Ex.73. Create aVI that concatenates a message string, a numeric and a unit string, eg., “Set to 10.24 volts” by specifying formats.