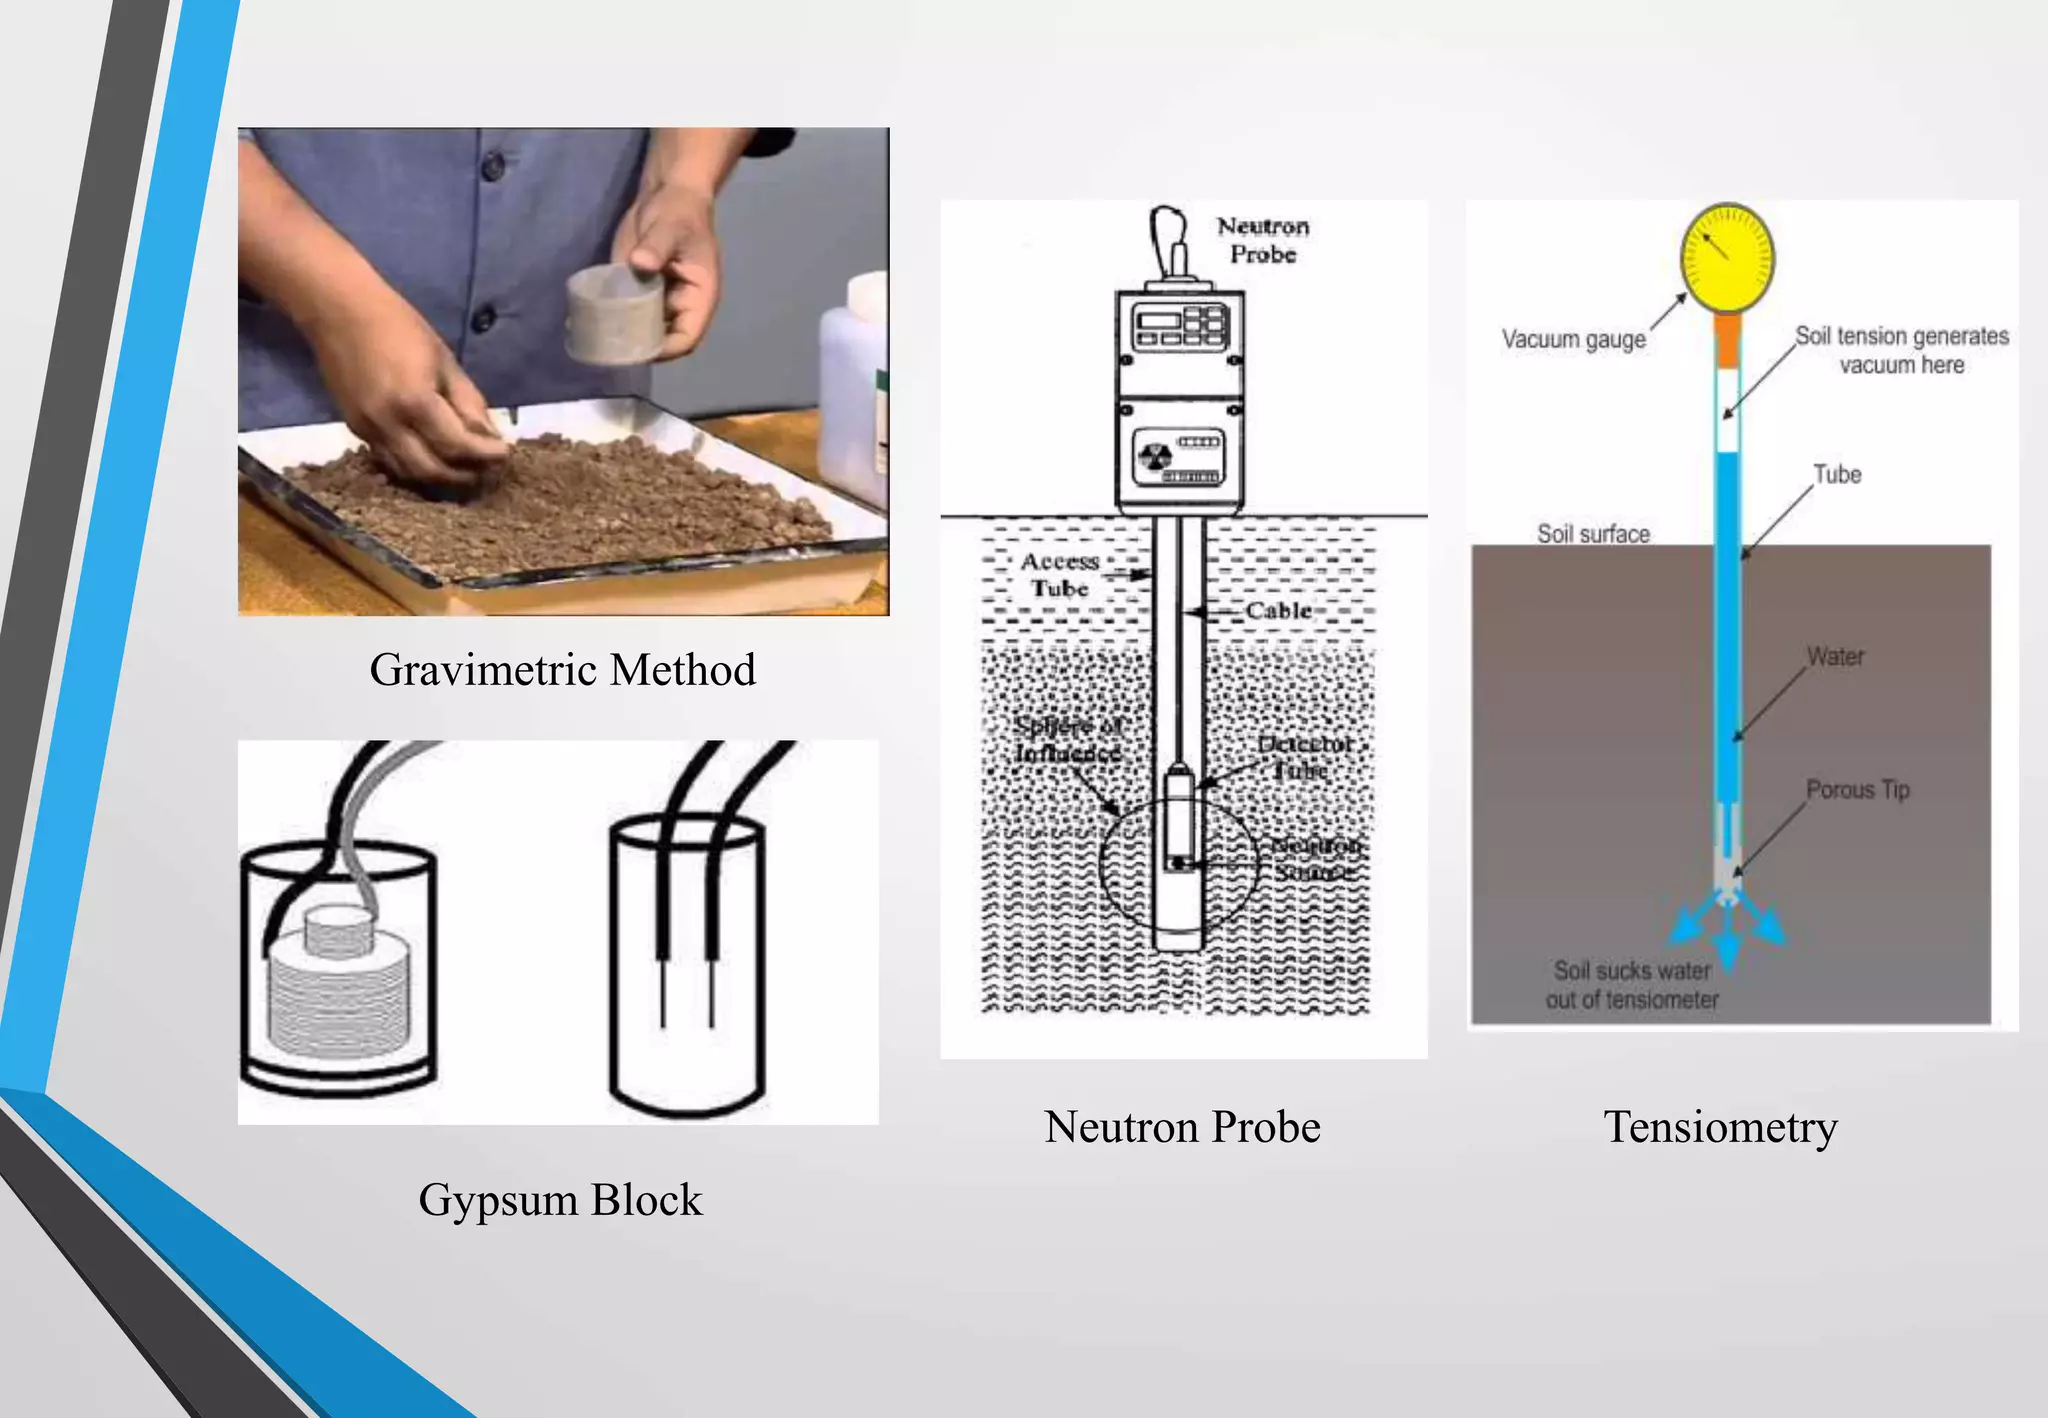
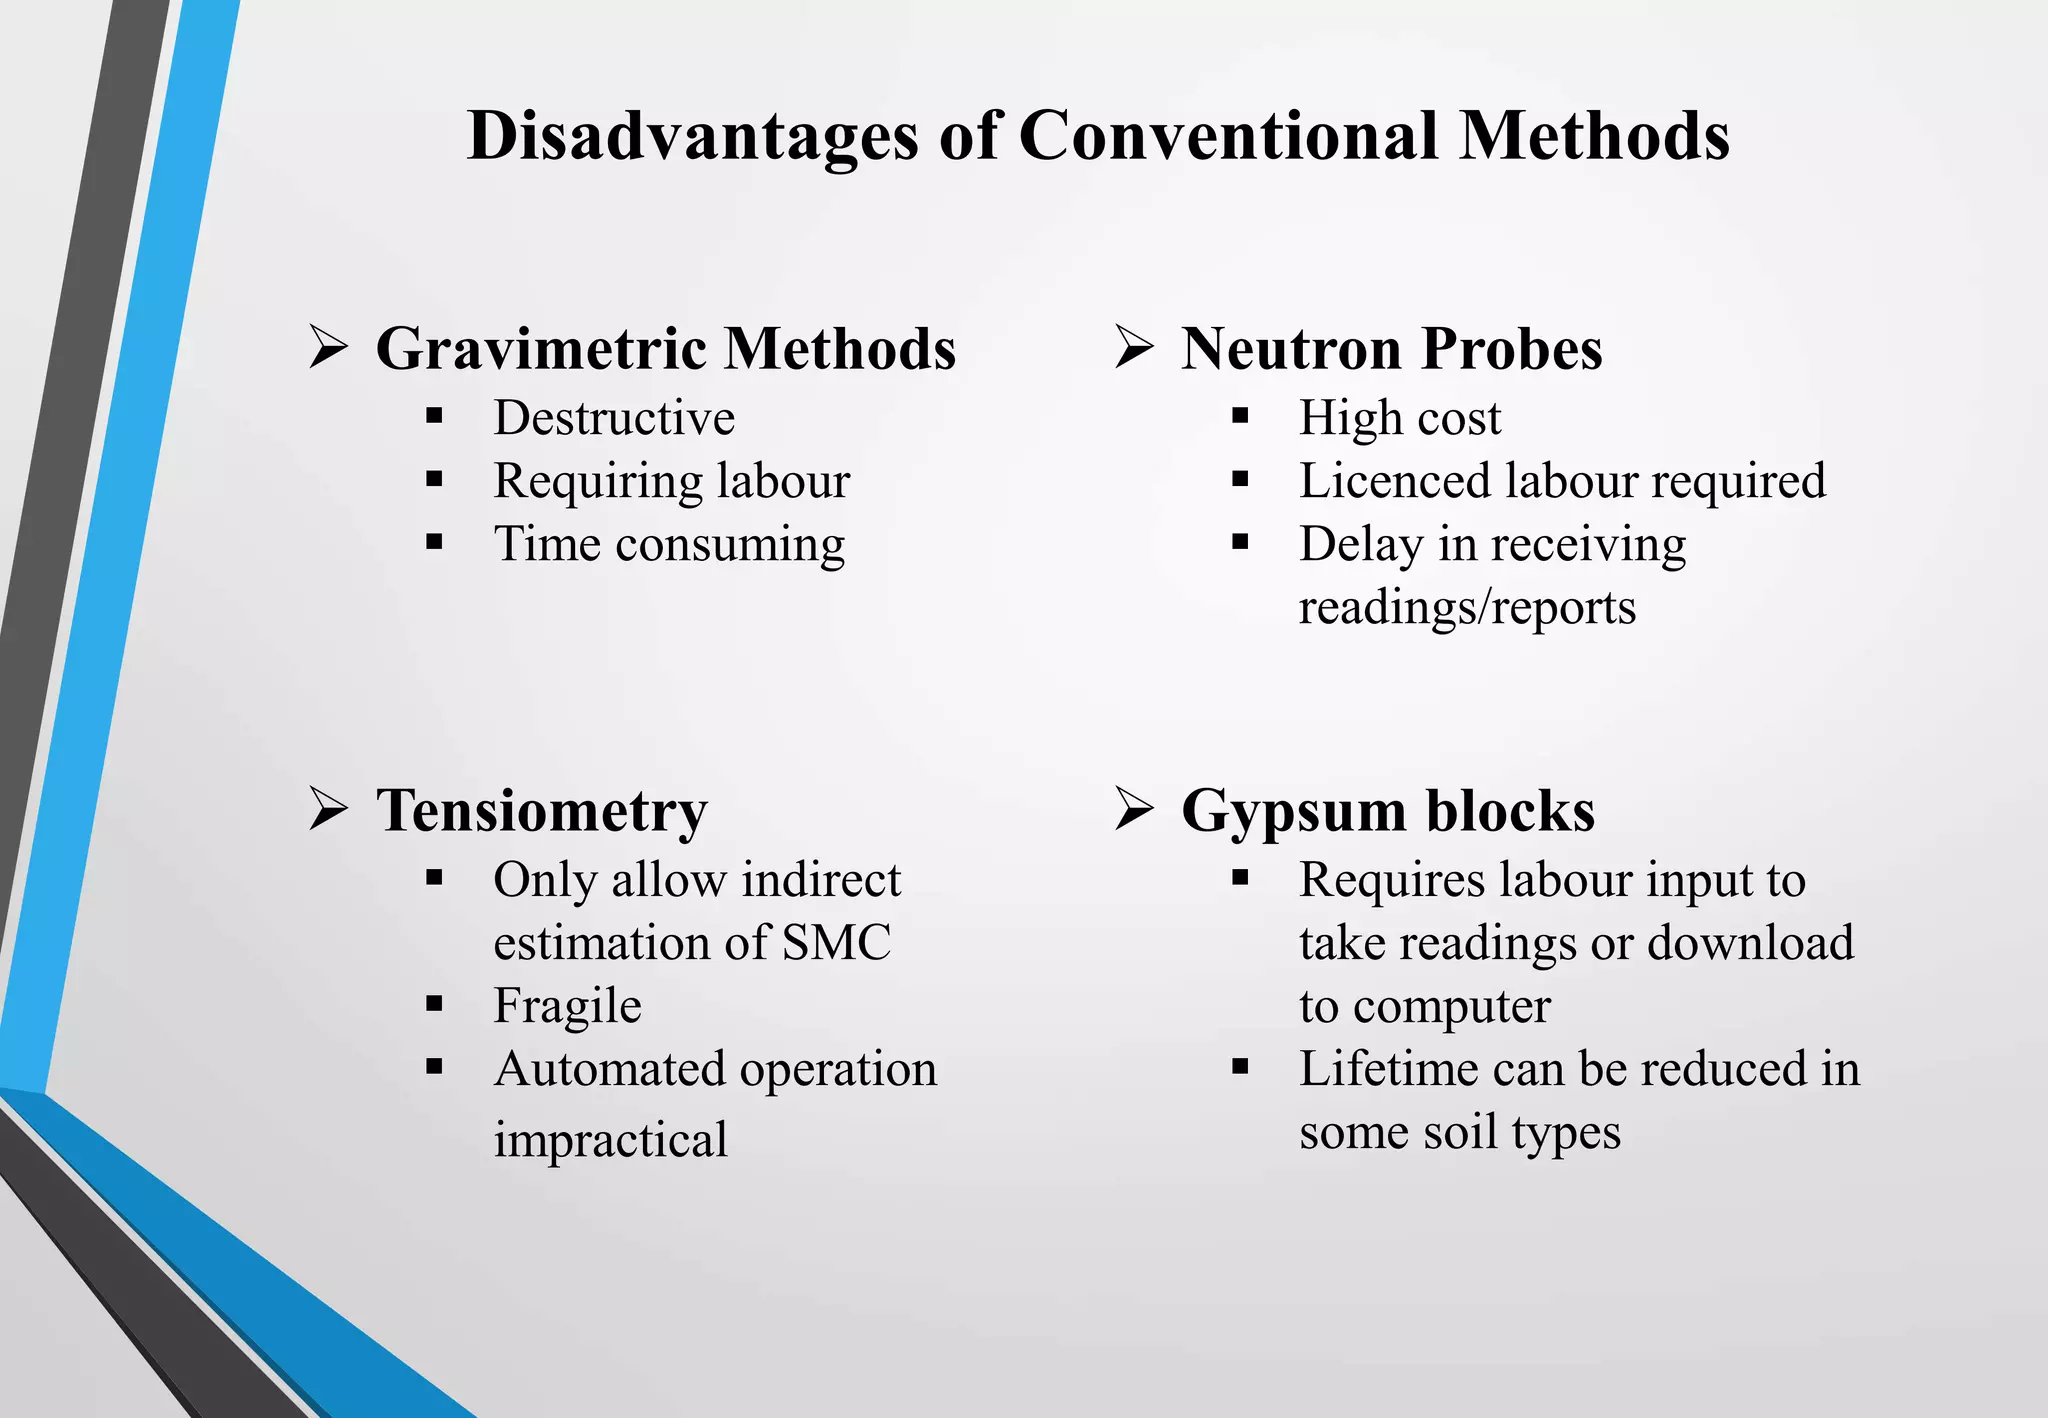
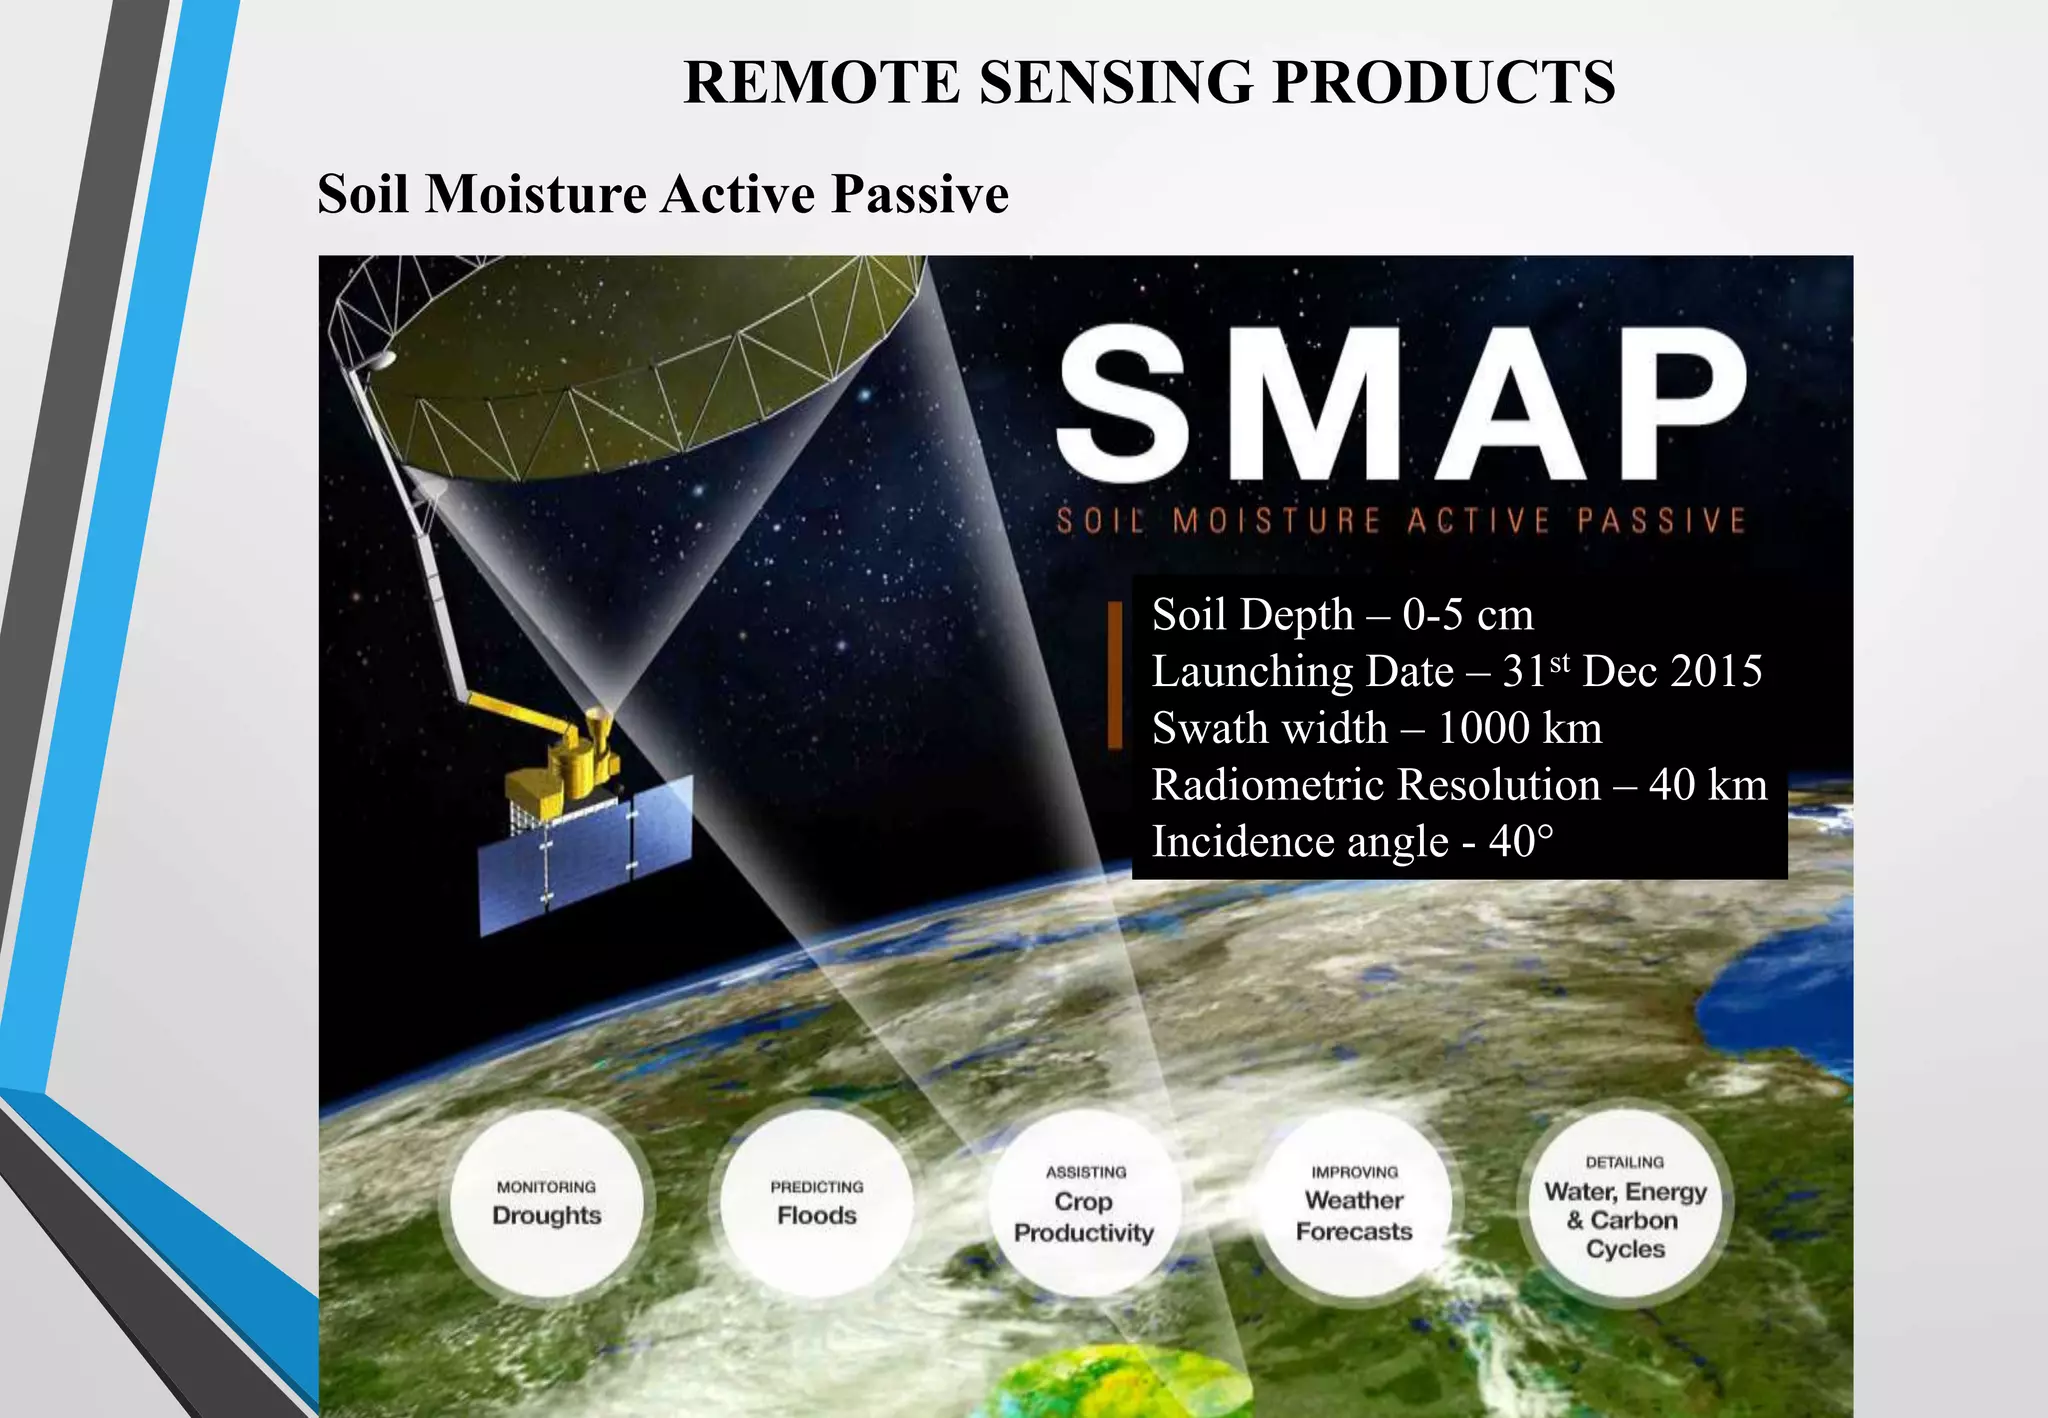
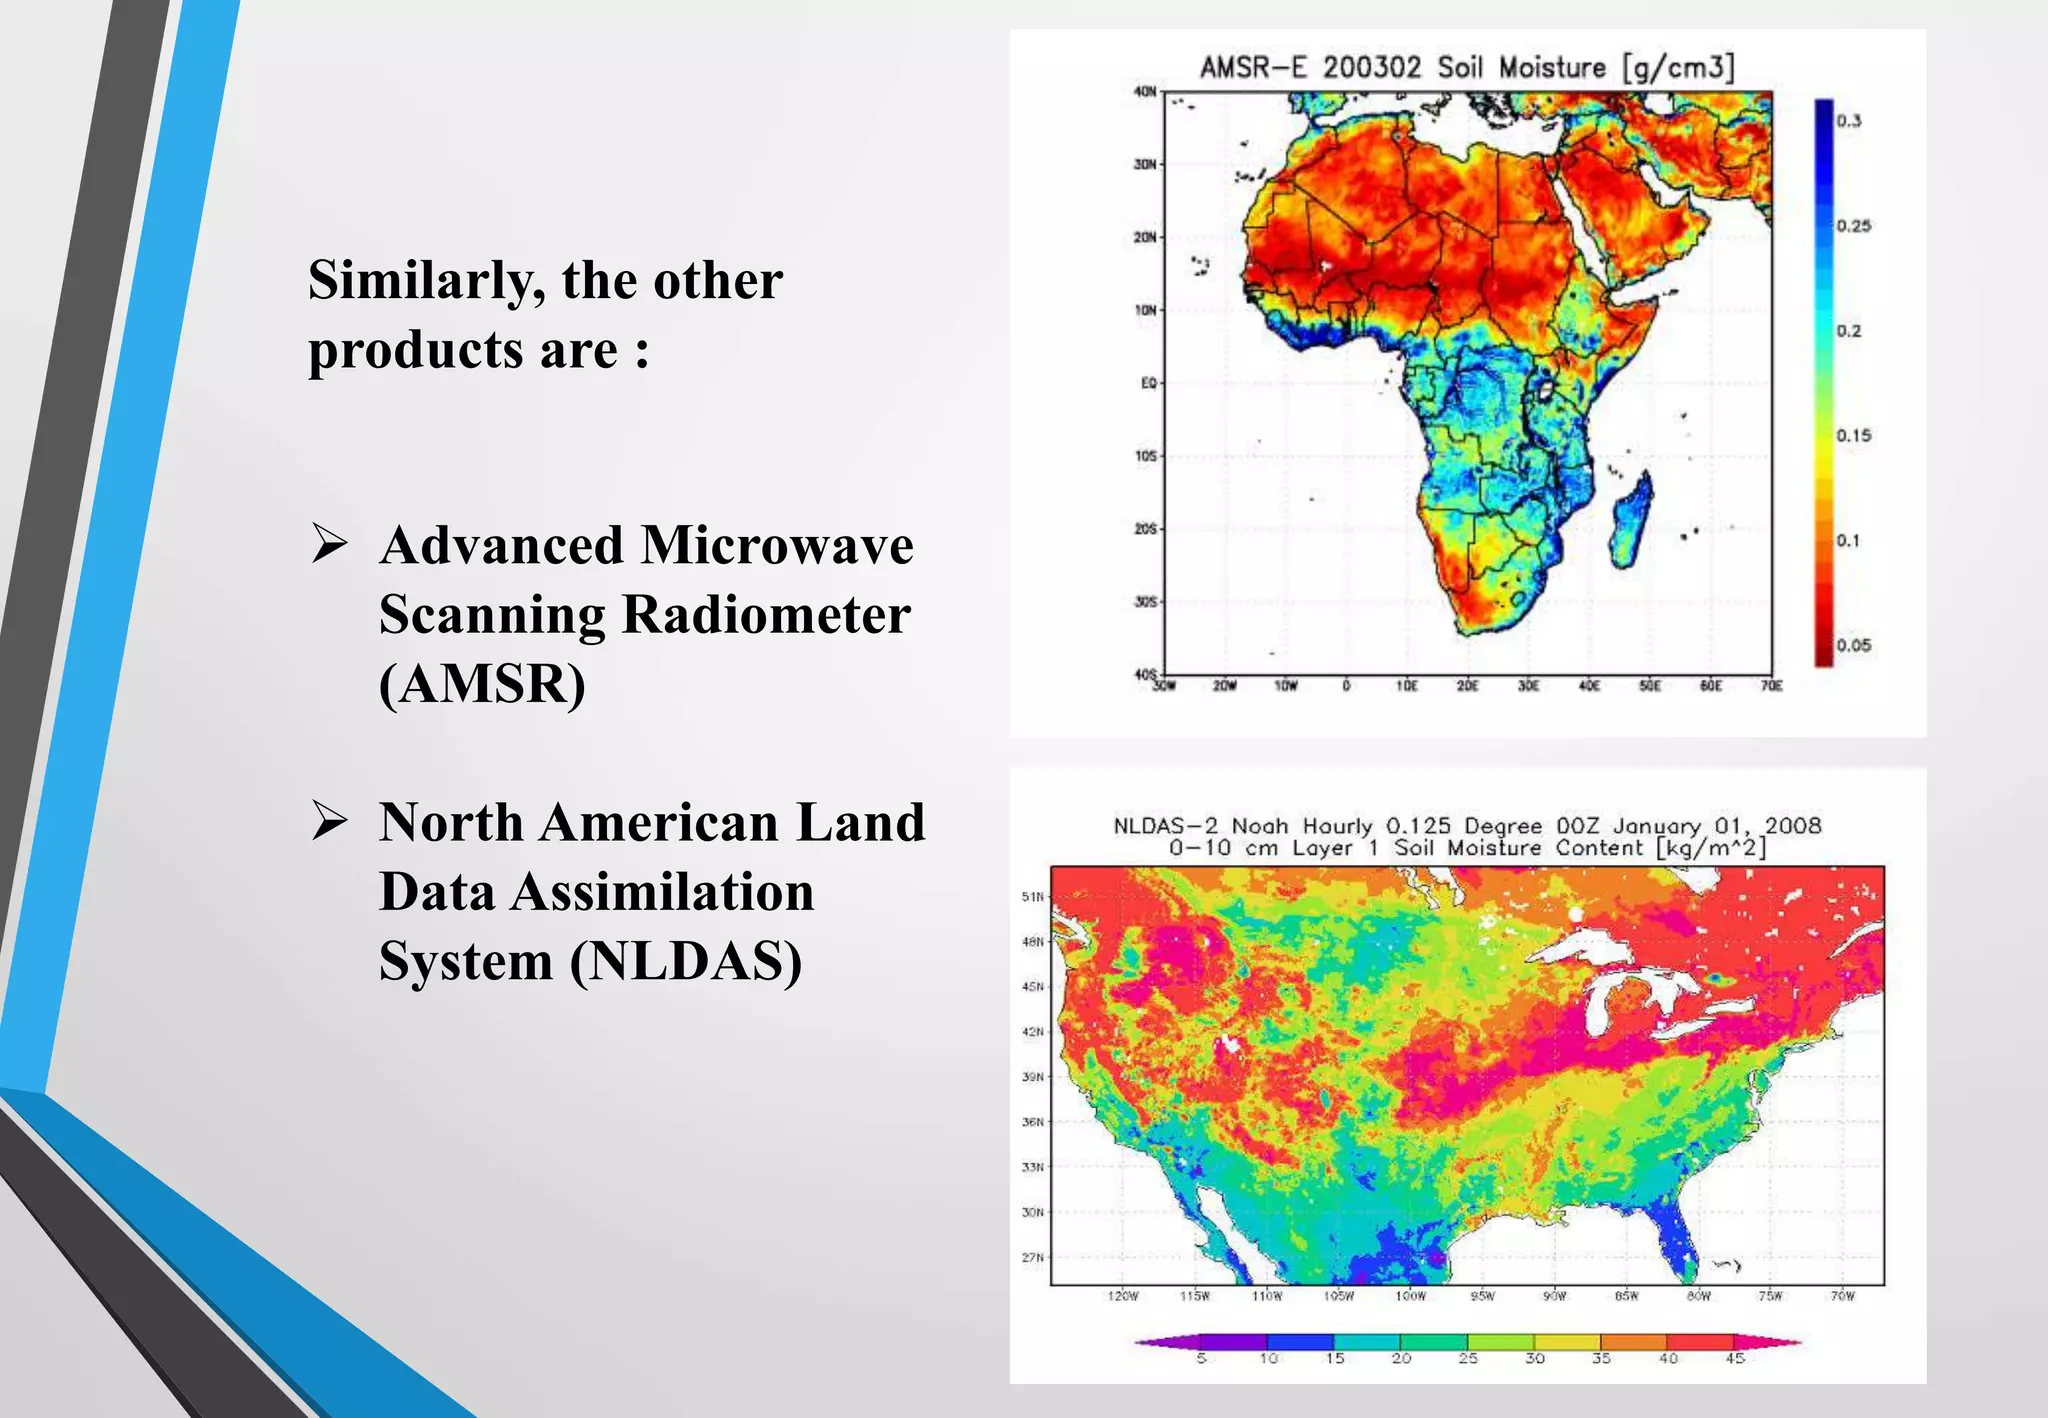
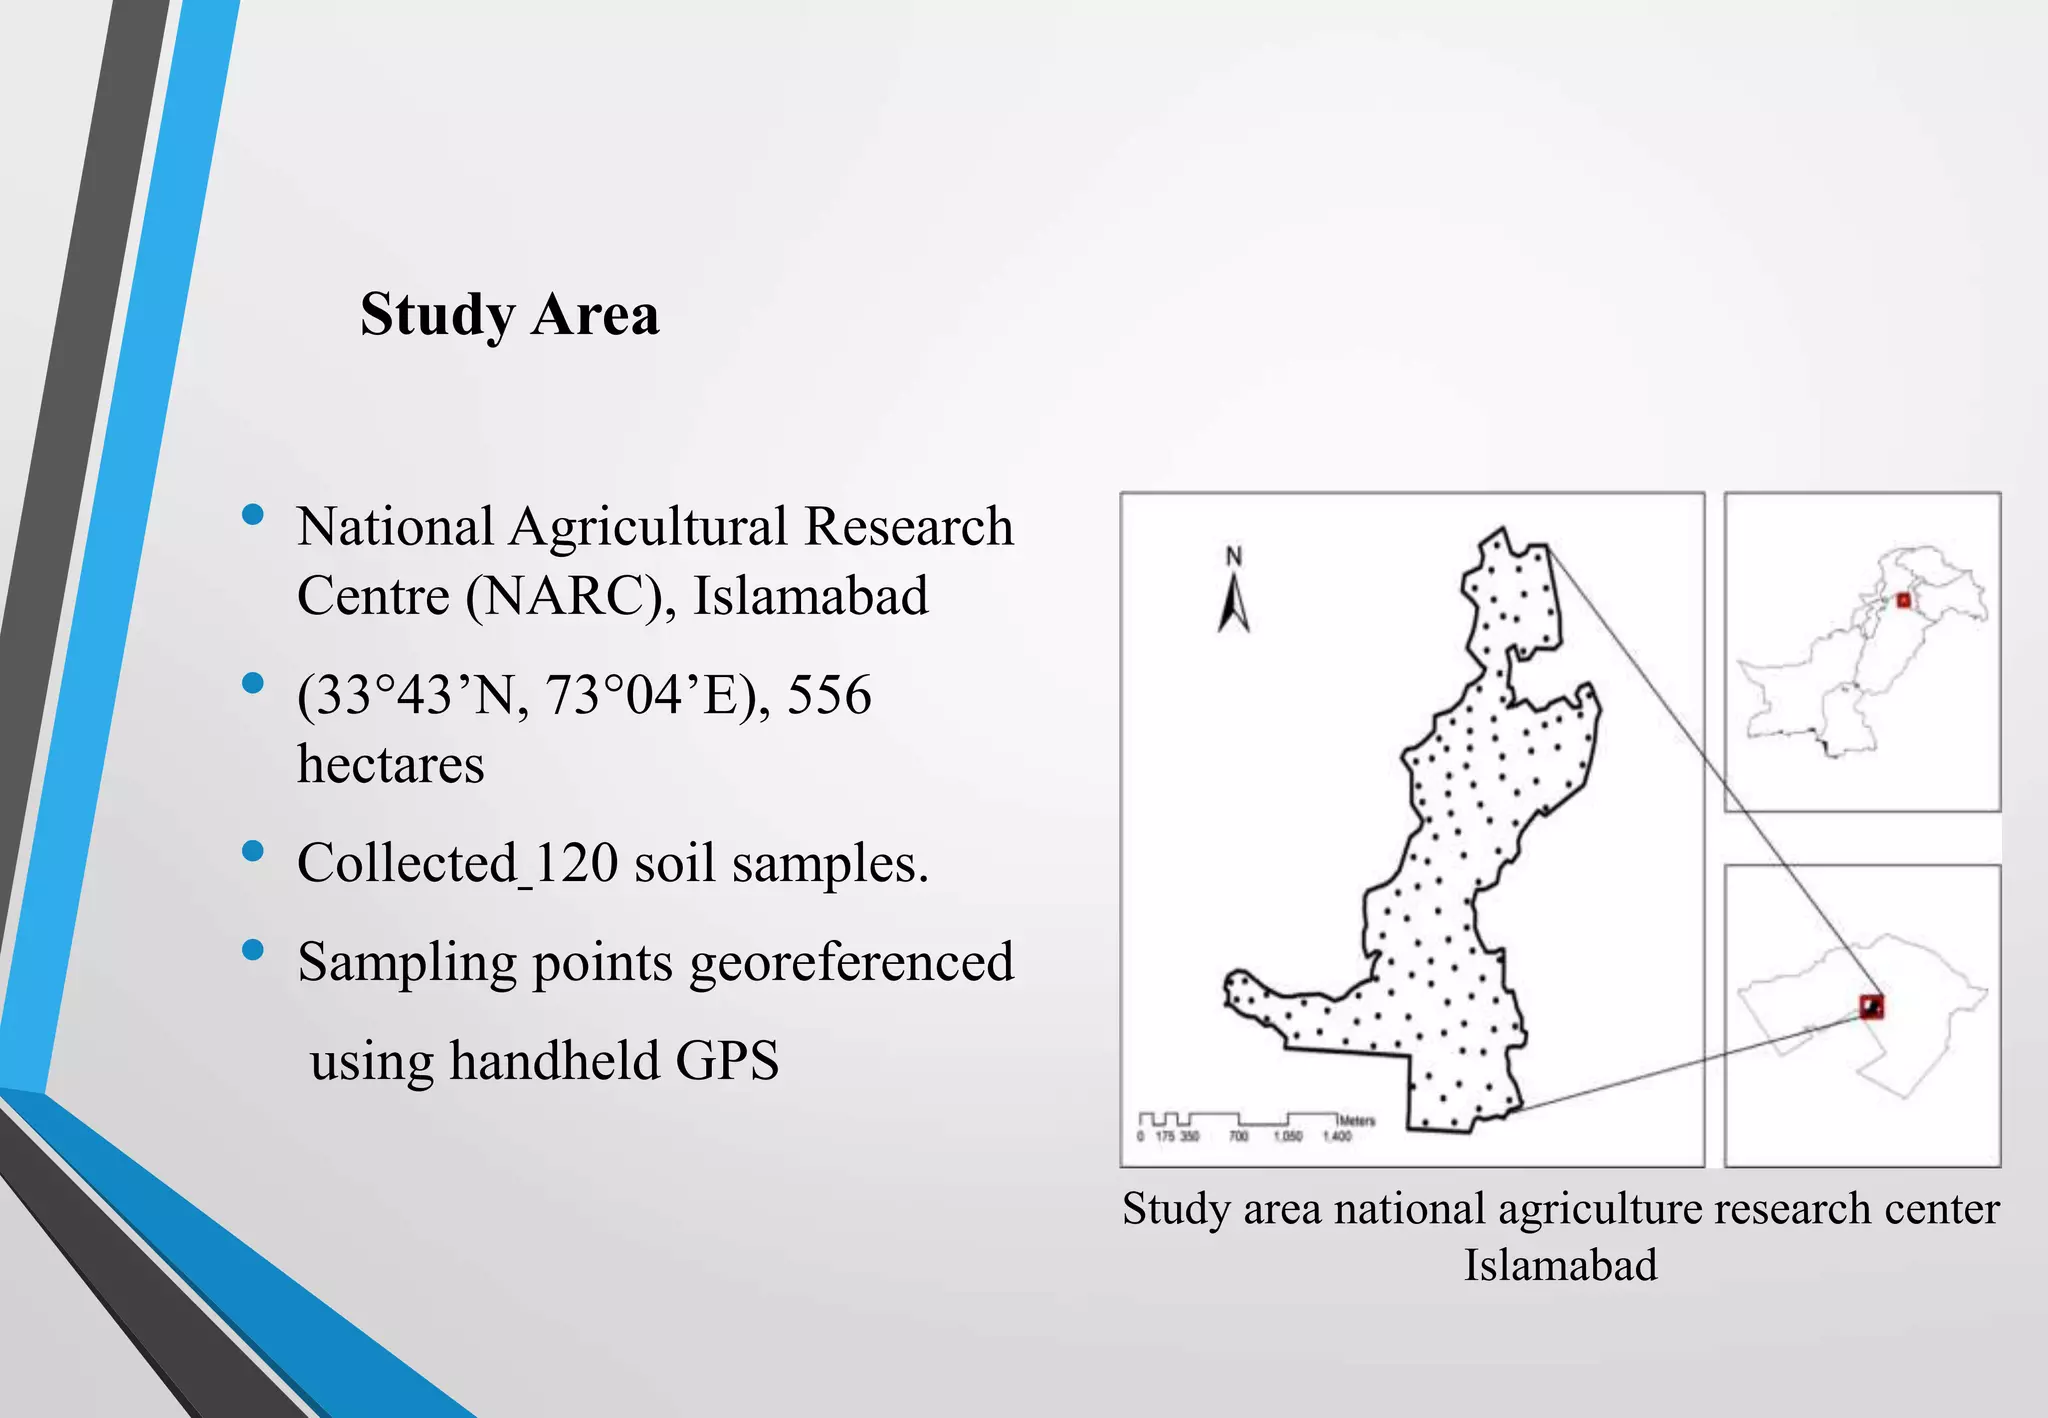
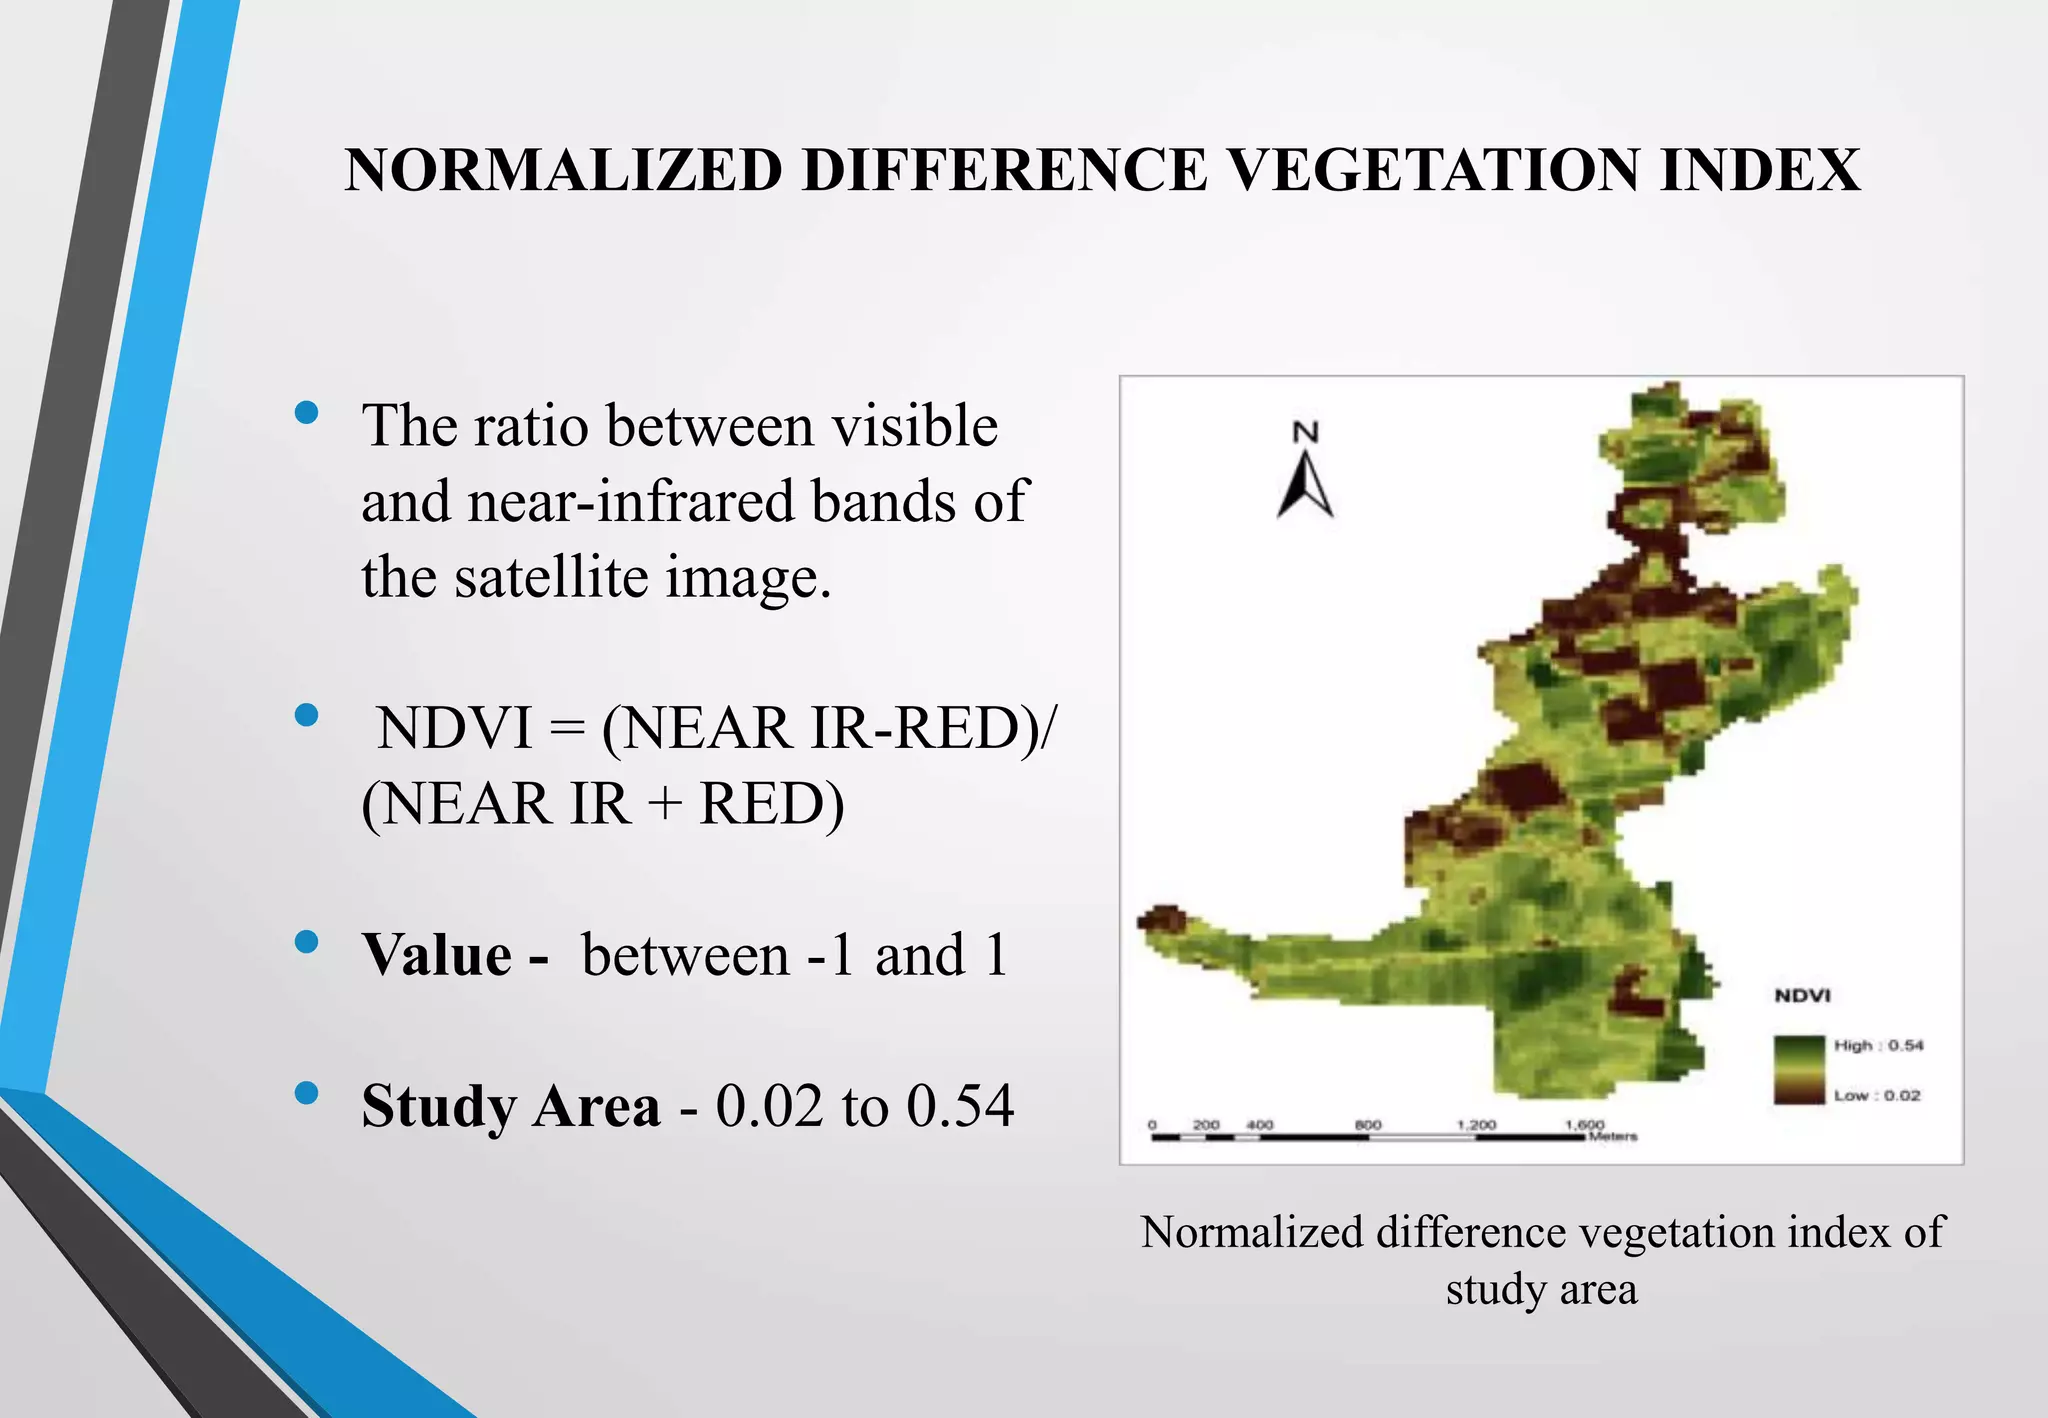
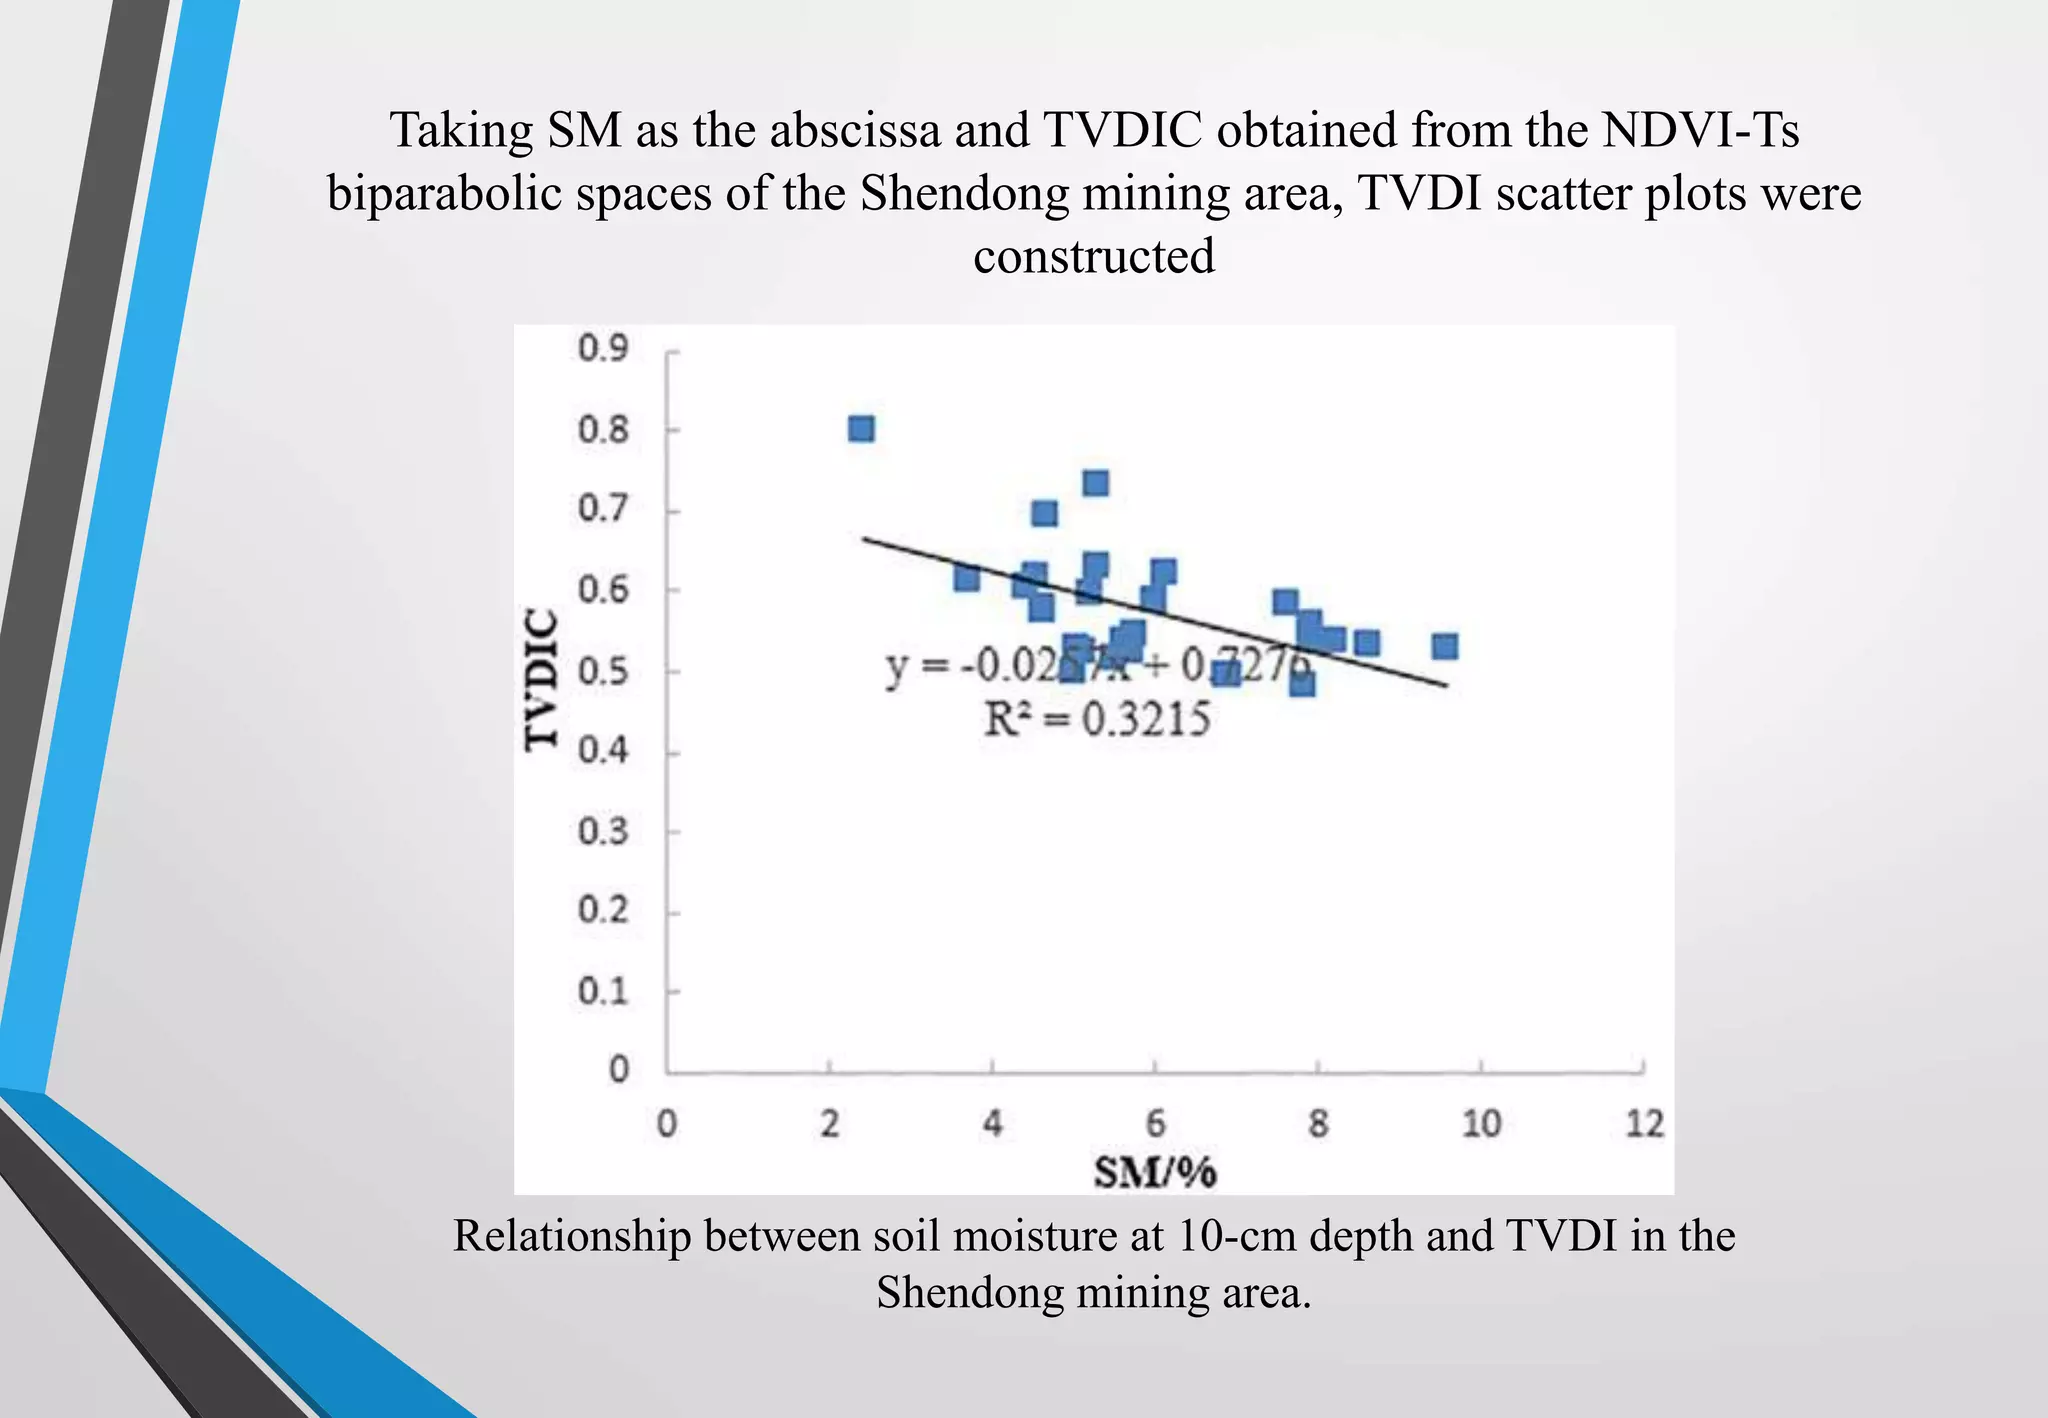
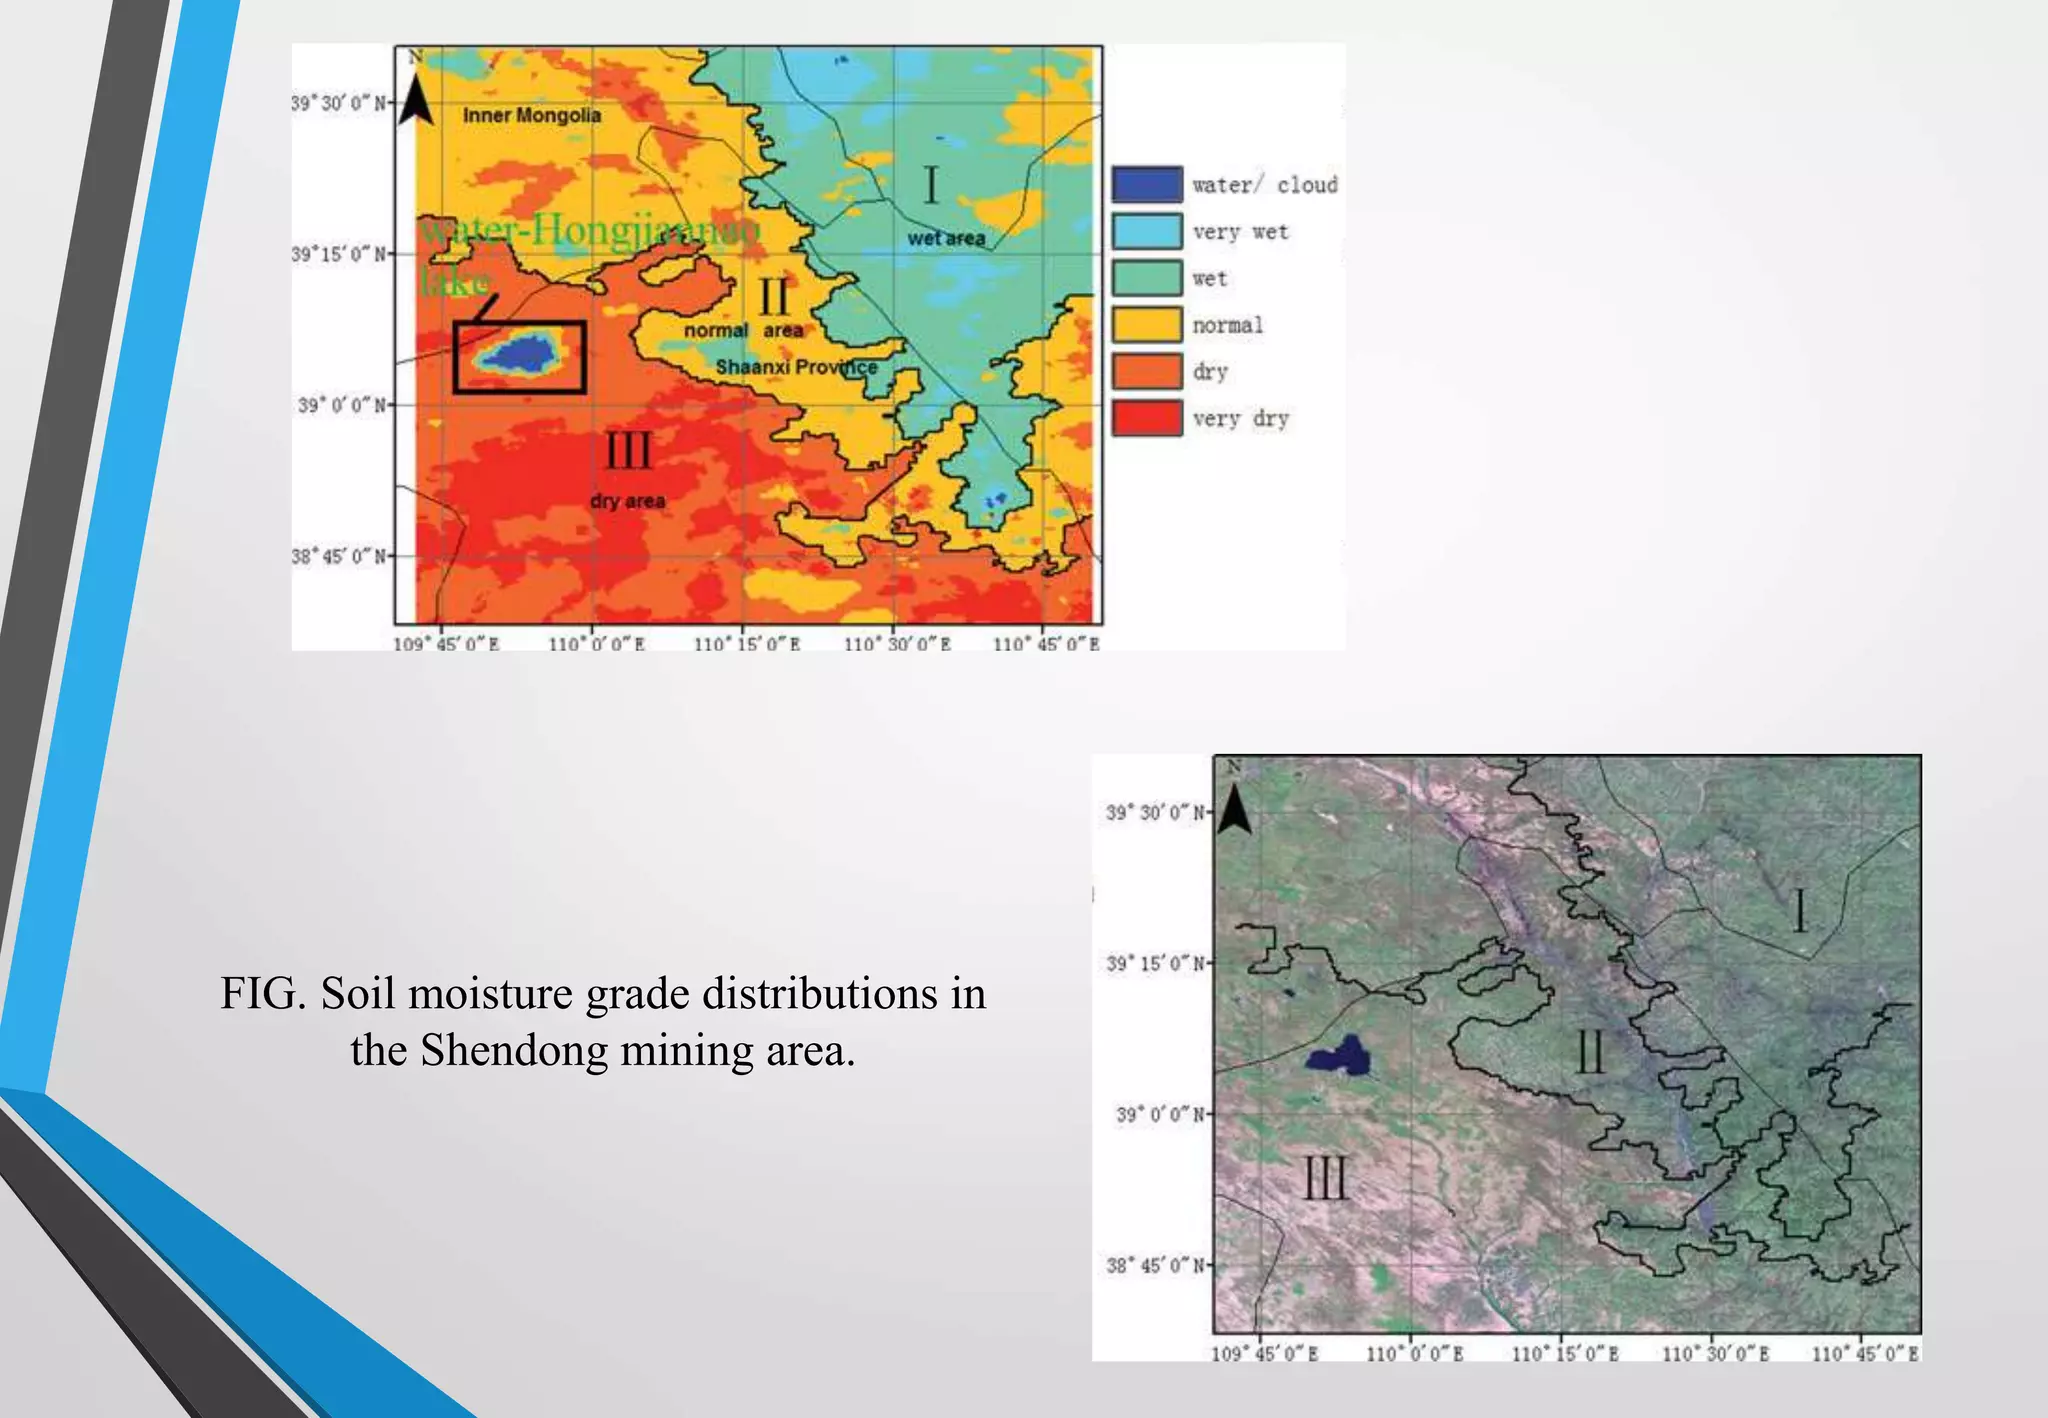
SPATIALANALYSIS FOR RESOURCE MANAGEMENT
Topic :-
RS AND GIS IN SOIL MOISTURE ASSESSMENT
Presented By :-
1) Pratik Jiwane
2) Uzma Shaikh
3) Shubham Ugile
4) Vishnu U Krishnan
Guided By :-
Dr. Y. B. Katpatal
WATER RECOURCE ENGINEERING DEPARTMENT
OUTLINE
o Soil moisture
o Importance of soil moisture
o Methods used for soil moisture assessment
o Why Remote Sensing and GIS?
o Remote sensing products
o Case study 1
o Case study 2
o References
 Water contained in soil is called soil moisture. The water is held
within the soil pores.
 Soil moisture is the water that is held in the spaces between soil
particles.
 Surface soil moisture – upto depth of 10 cm
 Root zone soil moisture – upto depth of 200 cm.
 Soil moisture information is an important parameter for:
 Crop production estimation,
 Irrigation scheduling/crop water stress assessment,
 Water resources inventory/water supply planning,
 Hydrological processes modeling.
SOIL MOISTURE
 Meteorology
 Evapotranspiration - partitioning of available
energy into sensible and latent heat exchange
 Hydrology
 Rainfall Runoff - infiltration rate; water supply
 Agriculture
 Crop Yield - pre-planting moisture; irrigation
scheduling; insects & diseases; de-nitrification.
 Sediment Transport - runoff producing zones
 Climate Studies
Importance of Soil Moisture
METHODS USED FOR SOIL MOISTURE
ASSESSMENT
1) Conventional Methods
2) Remote Sensing & GIS Methods
1) Conventional Methods
 Gravimetric Methods
 Tensiometry
 Neutron Probes
 Gypsum blocks
Gravimetric Method
Neutron Probe Tensiometry
Gypsum Block
Disadvantages of Conventional Methods
 Gravimetric Methods
 Destructive
 Requiring labour
 Time consuming
 Tensiometry
 Only allow indirect
estimation of SMC
 Fragile
 Automated operation
impractical
 Neutron Probes
 High cost
 Licenced labour required
 Delay in receiving
readings/reports
 Gypsum blocks
 Requires labour input to
take readings or download
to computer
 Lifetime can be reduced in
some soil types
2) Remote Sensing & GIS Methods
 Visible & near IR – Reflected Solar
 Reflected solar energy is measured (0.4 – 1.7 mm)
 Relationship between Reflectance and SM Depends
on reflectance of dry soil, roughness, colour,
illumination, organic matter, soil texture.
 Thermal IR – Surface Temperature
 Variations in soil moisture have a strong influence on
the thermal properties of the soil, which is an intrinsic
factor of soil surface temperature change.
 Active Microwave – Backscattering
 Active microwave remote sensing observations
of backscattering have the potential to measure
moisture content in a near-surface layer of soil.
 Passive Microwave – Microwave
 Microwave remote sensing provides a unique
capability for soil moisture estimation by
measuring the electromagnetic radiation in the
microwave region.
 The fundamental basis of microwave remote
sensing for soil moisture is the large contrast
between the dielectric properties of water and
soil particles
Why Remote Sensing and GIS?
 Rapid data collection over large areas on a repetitive
basis.
 They provide the spatial and temporal distribution of
soil moisture coverage.
 Easy data acquisition at different scales and
resolutions.
 The images are analysed in the laboratory thus
reducing the amount of field work.
 These methods do not disturb the object or area of
interest.
 Map revision at medium to small scales is economical
and faster.
REMOTE SENSING PRODUCTS
Soil Moisture Active Passive
Soil Depth – 0-5 cm
Launching Date – 31st Dec 2015
Swath width – 1000 km
Radiometric Resolution – 40 km
Incidence angle - 40°
Global Land Data Assimilation System (GLDAS)
 Spatial Resolution -0.25°
 Collecting soil moisture
since 2000
 Soil moisture is mapped
monthly in mm
Gravity Recovery and Climate Experiment (GRACE)
 Launching Date -
March 2002
 Inclination - 89°
 Orbital period – 91 min
 Decommission – 31st
Oct 2017
Soil Moisture and Ocean Salinity (SMOS)
ESA - European space agency
 Launching Date – 2nd
Nov 2009
 Spatial Resolution – 35-
50 km
 Orbital period – 100
min
Similarly, the other
products are :
 Advanced Microwave
Scanning Radiometer
(AMSR)
 North American Land
Data Assimilation
System (NLDAS)
CASE STUDY 1
“Estimation of soil moisture using multispectral Remote
Sensing techniques”
Author - Syed Muhammad Zubair Younis , Javed Iqbal, 2015
The Egyptian Journal of Remote Sensing and Space
Sciences
• National Agricultural Research
Centre (NARC), Islamabad
• (3343’N, 7304’E), 556
hectares
• Collected 120 soil samples.
• Sampling points georeferenced
using handheld GPS
Study Area
Study area national agriculture research center
Islamabad
NORMALIZED DIFFERENCE VEGETATION INDEX
• The ratio between visible
and near-infrared bands of
the satellite image.
• NDVI = (NEAR IR-RED)/
(NEAR IR + RED)
• Value - between -1 and 1
• Study Area - 0.02 to 0.54
Normalized difference vegetation index of
study area
• The surface atmosphere interaction energy fluxes between
ground and the atmosphere convert DNs to top-of-the-
atmosphere (ToA) radiance values
• Where
L = ToA spectral radiance,
ML =band-specific multiplicative rescaling factor,
AL = band-specific additive rescaling factor,
Qcal = quantized and calibrated standard product
pixel values (DN).
L = (ML *Qcal)+ AL
LAND SURFACE TEMPERATURE
• Convert the ToA radiance values to ToA
• Brightness temperature in Kelvin.
• Where,
T =brightness temperature (K), L =spectral radiance
K1=band-specific thermal conversion constant
K2 =band-specific thermal conversion constant
T =K2/(ln (K1/L+1))
Land surface temperature of study area (°C).
• The variotion between LST & NDVI is plotted
Where,
Ts= land surface temperature of any pixel
Tsmin =minimum land surface temperature
Tsmax= maximum land surface temperature
• It shows a relationship of decreasing temperature with
increasing vegetation and vice versa
TEMPERATURE VEGETATION DRYNESS INDEX
TVDI = (Ts-Tsmin)/ (Tsmax-Tsmin)
• The value of the TVDI ranges from 0 to 1.
• A larger TVDI means that Ts is closer to the dry edge and
that the dryness condition is more serious.
• By contrast, a smaller TVDI means that Ts is closer to the
wet edge and the soil condition is moisture.
Definition of the TVDI in a simplified triangular NDVI-Ts
space (after Sandholt et al. 2002).
Land surface temperature and normalized difference
vegetation distribution of sample points.
• TVDI value decreases the physically measured moisture
increases and vice versa
• LST was more responsive, the
drought information can be
better revealed
Correlation between remotely sensed soil moisture and
lab soil moisture
Temperature vegetation dryness index of study
area
• A strong correlation was found between LST & NDVI
& formation of TVDI surface by using regression analysis.
• This method take less time & application in large scale
CONCLUSION
CASE STUDY 2
“Biparabolic NDVI-Ts Space and Soil Moisture Remote
Sensing in an Arid and Semi arid Area”
Author - Ying Liu, Lixin Wu & Hui Yue, 2015
Canadian Journal of Remote Sensing
Study Area
 The Shendong mining area,
 Located at Southeastern portion of the ordos plateau,
 This mining area is one of the major coal production
centres in china and belongs to arid and semiarid desert
mining area.
 110 18’ 30” E, 39 11’ 30” N.
Map of the experimental area.
The climate is characterized by low precipitation , uneven seasonal
distribution, strong evaporation, and scarcity of surface water resources.
 Normalized difference vegetation index (NDVI) and
land surface temperature (Ts) data fromthe
multitemporal Moderate Resolution Imaging
Spectroradiometer (MODIS) were used to analyze the
NDVI-Ts space.
 Based on NDVI-Ts space ,TVDI is obtained.
 Data on relative soil moisture to compare with TVDI
were obtained in 2 ways: field sample
Definition of TVDI in the biparabolic NDVI Ts space
Biparabolic NDVI-Ts Space Method
• The principle of the biparabolic NDVI-Ts space is that the
surface temperature of sunlit bare surface with partial
cover is higher than that of sunlit water.
• The result is a rising trend in the dry edge when the NDVI
< 0.15.
• The dry edge of the NDVI-Ts has been found to be useful
in estimating land surface soil moisture and fractional
vegetation cover.
Scatter plot of dry and wet edges in the NDVI-Ts space in the Shendong
mining area: (a) biparabolic NDVI-Ts space; (b) triangular NDVI-Ts space.
The Shendong mining area was taken as the experimental site. Figure shows a
scatter plot of the dry and wet edges in the NDVI-Ts space for the experimental
area.
Where
a1, b1, c1 and a2 b2 c2 are the fitting coefficients of dry and
wet edges
TVDI = (Ts-Tsmin)/ (Tsmax-Tsmin)
• The fitting equations for the dry and wet edges in
biparabolic NDVI-Ts space are as follows:
Tsmax = a1 × NDVI2 + b1 × NDVI + c1
Tsmin = a2 × NDVI2+ b2 × NDVI + c2
Relationship between soil moisture at 10-cm depth and TVDI in the
Shendong mining area.
Taking SM as the abscissa and TVDIC obtained from the NDVI-Ts
biparabolic spaces of the Shendong mining area, TVDI scatter plots were
constructed
(i) Very wet (0 < TVDI ≤ 0.2);
(ii) Wet (0.2 < TVDI ≤ 0.4);
(iii) Normal (0.4 < TVDI ≤ 0.6);
(iv) Dry (0.6 < TVDI ≤ 0.8);
(v) Very dry (0.8 < TVDI ≤ 1).
Soil moisture was classified into 5 categories:
FIG. Soil moisture grade distributions in
the Shendong mining area.
 When comparing TVDI with field-measured soil
moisture data, the correlation between 10- cm-depth soil
moisture and TVDI obtained from the biparabolic
NDVI-Ts space was slightly better than with TDVI
obtained from the triangular space.
 Therefore, the area with NDVI < 0.15 should be
included in the biparabolic NDVI-Ts space and should
not be omitted, and water bodies can also be recognized
by the biparabolic NDVI-Ts space.
CONCLUSION
REFERENCES
 Ying Liu, Lixin Wu & Hui Yue, 2015,
“Biparabolic NDVI-Ts Space and Soil Moisture Remote Sensing in an Arid and
Semi arid Area”
Canadian Journal of Remote Sensing
ISSN: 0703-8992 (Print) 1712-7971 (Online) Journal homepage:
http://www.tandfonline.com/loi/ujrs20
 Syed Muhammad Zubair Younis , Javed Iqbal, 2015
“Estimation of soil moisture using multispectral and FTIR techniques”
The Egyptian Journal of Remote Sensing and Space
Sciences
National Authority for Remote Sensing and Space Sciences
 https://www.jpl.nasa.gov/news/news.php?feature=6777
SOIL MOISTURE ASSESSMENT BY REMOTE SENSING AND GIS

SOIL MOISTURE ASSESSMENT BY REMOTE SENSING AND GIS

  • 1.
    SPATIALANALYSIS FOR RESOURCEMANAGEMENT Topic :- RS AND GIS IN SOIL MOISTURE ASSESSMENT Presented By :- 1) Pratik Jiwane 2) Uzma Shaikh 3) Shubham Ugile 4) Vishnu U Krishnan Guided By :- Dr. Y. B. Katpatal WATER RECOURCE ENGINEERING DEPARTMENT
  • 2.
    OUTLINE o Soil moisture oImportance of soil moisture o Methods used for soil moisture assessment o Why Remote Sensing and GIS? o Remote sensing products o Case study 1 o Case study 2 o References
  • 3.
     Water containedin soil is called soil moisture. The water is held within the soil pores.  Soil moisture is the water that is held in the spaces between soil particles.  Surface soil moisture – upto depth of 10 cm  Root zone soil moisture – upto depth of 200 cm.  Soil moisture information is an important parameter for:  Crop production estimation,  Irrigation scheduling/crop water stress assessment,  Water resources inventory/water supply planning,  Hydrological processes modeling. SOIL MOISTURE
  • 5.
     Meteorology  Evapotranspiration- partitioning of available energy into sensible and latent heat exchange  Hydrology  Rainfall Runoff - infiltration rate; water supply  Agriculture  Crop Yield - pre-planting moisture; irrigation scheduling; insects & diseases; de-nitrification.  Sediment Transport - runoff producing zones  Climate Studies Importance of Soil Moisture
  • 6.
    METHODS USED FORSOIL MOISTURE ASSESSMENT 1) Conventional Methods 2) Remote Sensing & GIS Methods
  • 7.
    1) Conventional Methods Gravimetric Methods  Tensiometry  Neutron Probes  Gypsum blocks
  • 8.
    Gravimetric Method Neutron ProbeTensiometry Gypsum Block
  • 9.
    Disadvantages of ConventionalMethods  Gravimetric Methods  Destructive  Requiring labour  Time consuming  Tensiometry  Only allow indirect estimation of SMC  Fragile  Automated operation impractical  Neutron Probes  High cost  Licenced labour required  Delay in receiving readings/reports  Gypsum blocks  Requires labour input to take readings or download to computer  Lifetime can be reduced in some soil types
  • 10.
    2) Remote Sensing& GIS Methods  Visible & near IR – Reflected Solar  Reflected solar energy is measured (0.4 – 1.7 mm)  Relationship between Reflectance and SM Depends on reflectance of dry soil, roughness, colour, illumination, organic matter, soil texture.  Thermal IR – Surface Temperature  Variations in soil moisture have a strong influence on the thermal properties of the soil, which is an intrinsic factor of soil surface temperature change.
  • 11.
     Active Microwave– Backscattering  Active microwave remote sensing observations of backscattering have the potential to measure moisture content in a near-surface layer of soil.  Passive Microwave – Microwave  Microwave remote sensing provides a unique capability for soil moisture estimation by measuring the electromagnetic radiation in the microwave region.  The fundamental basis of microwave remote sensing for soil moisture is the large contrast between the dielectric properties of water and soil particles
  • 12.
    Why Remote Sensingand GIS?  Rapid data collection over large areas on a repetitive basis.  They provide the spatial and temporal distribution of soil moisture coverage.  Easy data acquisition at different scales and resolutions.  The images are analysed in the laboratory thus reducing the amount of field work.  These methods do not disturb the object or area of interest.  Map revision at medium to small scales is economical and faster.
  • 13.
    REMOTE SENSING PRODUCTS SoilMoisture Active Passive Soil Depth – 0-5 cm Launching Date – 31st Dec 2015 Swath width – 1000 km Radiometric Resolution – 40 km Incidence angle - 40°
  • 15.
    Global Land DataAssimilation System (GLDAS)  Spatial Resolution -0.25°  Collecting soil moisture since 2000  Soil moisture is mapped monthly in mm
  • 16.
    Gravity Recovery andClimate Experiment (GRACE)  Launching Date - March 2002  Inclination - 89°  Orbital period – 91 min  Decommission – 31st Oct 2017
  • 17.
    Soil Moisture andOcean Salinity (SMOS) ESA - European space agency  Launching Date – 2nd Nov 2009  Spatial Resolution – 35- 50 km  Orbital period – 100 min
  • 18.
    Similarly, the other productsare :  Advanced Microwave Scanning Radiometer (AMSR)  North American Land Data Assimilation System (NLDAS)
  • 19.
    CASE STUDY 1 “Estimationof soil moisture using multispectral Remote Sensing techniques” Author - Syed Muhammad Zubair Younis , Javed Iqbal, 2015 The Egyptian Journal of Remote Sensing and Space Sciences
  • 20.
    • National AgriculturalResearch Centre (NARC), Islamabad • (3343’N, 7304’E), 556 hectares • Collected 120 soil samples. • Sampling points georeferenced using handheld GPS Study Area Study area national agriculture research center Islamabad
  • 21.
    NORMALIZED DIFFERENCE VEGETATIONINDEX • The ratio between visible and near-infrared bands of the satellite image. • NDVI = (NEAR IR-RED)/ (NEAR IR + RED) • Value - between -1 and 1 • Study Area - 0.02 to 0.54 Normalized difference vegetation index of study area
  • 22.
    • The surfaceatmosphere interaction energy fluxes between ground and the atmosphere convert DNs to top-of-the- atmosphere (ToA) radiance values • Where L = ToA spectral radiance, ML =band-specific multiplicative rescaling factor, AL = band-specific additive rescaling factor, Qcal = quantized and calibrated standard product pixel values (DN). L = (ML *Qcal)+ AL LAND SURFACE TEMPERATURE
  • 23.
    • Convert theToA radiance values to ToA • Brightness temperature in Kelvin. • Where, T =brightness temperature (K), L =spectral radiance K1=band-specific thermal conversion constant K2 =band-specific thermal conversion constant T =K2/(ln (K1/L+1))
  • 24.
    Land surface temperatureof study area (°C).
  • 25.
    • The variotionbetween LST & NDVI is plotted Where, Ts= land surface temperature of any pixel Tsmin =minimum land surface temperature Tsmax= maximum land surface temperature • It shows a relationship of decreasing temperature with increasing vegetation and vice versa TEMPERATURE VEGETATION DRYNESS INDEX TVDI = (Ts-Tsmin)/ (Tsmax-Tsmin)
  • 26.
    • The valueof the TVDI ranges from 0 to 1. • A larger TVDI means that Ts is closer to the dry edge and that the dryness condition is more serious. • By contrast, a smaller TVDI means that Ts is closer to the wet edge and the soil condition is moisture.
  • 27.
    Definition of theTVDI in a simplified triangular NDVI-Ts space (after Sandholt et al. 2002).
  • 28.
    Land surface temperatureand normalized difference vegetation distribution of sample points.
  • 29.
    • TVDI valuedecreases the physically measured moisture increases and vice versa • LST was more responsive, the drought information can be better revealed Correlation between remotely sensed soil moisture and lab soil moisture Temperature vegetation dryness index of study area
  • 30.
    • A strongcorrelation was found between LST & NDVI & formation of TVDI surface by using regression analysis. • This method take less time & application in large scale CONCLUSION
  • 31.
    CASE STUDY 2 “BiparabolicNDVI-Ts Space and Soil Moisture Remote Sensing in an Arid and Semi arid Area” Author - Ying Liu, Lixin Wu & Hui Yue, 2015 Canadian Journal of Remote Sensing
  • 32.
    Study Area  TheShendong mining area,  Located at Southeastern portion of the ordos plateau,  This mining area is one of the major coal production centres in china and belongs to arid and semiarid desert mining area.  110 18’ 30” E, 39 11’ 30” N.
  • 33.
    Map of theexperimental area. The climate is characterized by low precipitation , uneven seasonal distribution, strong evaporation, and scarcity of surface water resources.
  • 34.
     Normalized differencevegetation index (NDVI) and land surface temperature (Ts) data fromthe multitemporal Moderate Resolution Imaging Spectroradiometer (MODIS) were used to analyze the NDVI-Ts space.  Based on NDVI-Ts space ,TVDI is obtained.  Data on relative soil moisture to compare with TVDI were obtained in 2 ways: field sample
  • 35.
    Definition of TVDIin the biparabolic NDVI Ts space
  • 36.
    Biparabolic NDVI-Ts SpaceMethod • The principle of the biparabolic NDVI-Ts space is that the surface temperature of sunlit bare surface with partial cover is higher than that of sunlit water. • The result is a rising trend in the dry edge when the NDVI < 0.15. • The dry edge of the NDVI-Ts has been found to be useful in estimating land surface soil moisture and fractional vegetation cover.
  • 37.
    Scatter plot ofdry and wet edges in the NDVI-Ts space in the Shendong mining area: (a) biparabolic NDVI-Ts space; (b) triangular NDVI-Ts space. The Shendong mining area was taken as the experimental site. Figure shows a scatter plot of the dry and wet edges in the NDVI-Ts space for the experimental area.
  • 38.
    Where a1, b1, c1and a2 b2 c2 are the fitting coefficients of dry and wet edges TVDI = (Ts-Tsmin)/ (Tsmax-Tsmin) • The fitting equations for the dry and wet edges in biparabolic NDVI-Ts space are as follows: Tsmax = a1 × NDVI2 + b1 × NDVI + c1 Tsmin = a2 × NDVI2+ b2 × NDVI + c2
  • 39.
    Relationship between soilmoisture at 10-cm depth and TVDI in the Shendong mining area. Taking SM as the abscissa and TVDIC obtained from the NDVI-Ts biparabolic spaces of the Shendong mining area, TVDI scatter plots were constructed
  • 40.
    (i) Very wet(0 < TVDI ≤ 0.2); (ii) Wet (0.2 < TVDI ≤ 0.4); (iii) Normal (0.4 < TVDI ≤ 0.6); (iv) Dry (0.6 < TVDI ≤ 0.8); (v) Very dry (0.8 < TVDI ≤ 1). Soil moisture was classified into 5 categories:
  • 41.
    FIG. Soil moisturegrade distributions in the Shendong mining area.
  • 42.
     When comparingTVDI with field-measured soil moisture data, the correlation between 10- cm-depth soil moisture and TVDI obtained from the biparabolic NDVI-Ts space was slightly better than with TDVI obtained from the triangular space.  Therefore, the area with NDVI < 0.15 should be included in the biparabolic NDVI-Ts space and should not be omitted, and water bodies can also be recognized by the biparabolic NDVI-Ts space. CONCLUSION
  • 43.
    REFERENCES  Ying Liu,Lixin Wu & Hui Yue, 2015, “Biparabolic NDVI-Ts Space and Soil Moisture Remote Sensing in an Arid and Semi arid Area” Canadian Journal of Remote Sensing ISSN: 0703-8992 (Print) 1712-7971 (Online) Journal homepage: http://www.tandfonline.com/loi/ujrs20  Syed Muhammad Zubair Younis , Javed Iqbal, 2015 “Estimation of soil moisture using multispectral and FTIR techniques” The Egyptian Journal of Remote Sensing and Space Sciences National Authority for Remote Sensing and Space Sciences  https://www.jpl.nasa.gov/news/news.php?feature=6777

Editor's Notes

  • #16 Owned and operated by nasa Soil moisture is mapped monthly in mm
  • #18 European space agency
  • #26 The values of both were rounded to two decimals and exported to dbf files. They were plotted against each other in excel sheet to identify the regression lines defining the upper and lower edges of the triangle
  • #30 strong negative correlation between TVDI and actual soil moisture.
  • #37 Values of NDVI below 0.15 were often eliminated in the linear fitting of the dry edge because these values represent areas that are not covered by vegetation