U.S. Bus Rapid Transit: 10 High-Quality Features and the Value Chain of Firms That Provide Them
•
4 likes•5,066 views

Bus rapid transit (BRT) is increasingly being considered in cities across the United States as a reliable and cost-effective public transit mode. A large part of the appeal of BRT is its flexibility, offering a choice of system features that can be adapted to each community’s needs and constraints. As more U.S. cities look to BRT, they will need to understand the value chain that provides the vehicles, technology, services and financing needed to create a high-quality BRT system.

Recommended
More Related Content
What's hot
What's hot (20)
Viewers also liked
Viewers also liked (20)
Similar to U.S. Bus Rapid Transit: 10 High-Quality Features and the Value Chain of Firms That Provide Them
Similar to U.S. Bus Rapid Transit: 10 High-Quality Features and the Value Chain of Firms That Provide Them (20)
More from The Rockefeller Foundation
More from The Rockefeller Foundation (20)
Recently uploaded
Recently uploaded (20)
U.S. Bus Rapid Transit: 10 High-Quality Features and the Value Chain of Firms That Provide Them
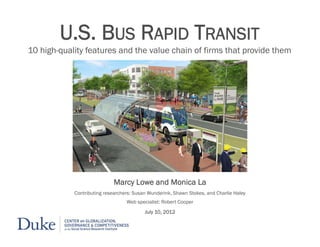
- 1. U.S. BUS RAPID TRANSIT 10 high-quality features and the value chain of firms that provide them Marcy Lowe and Monica La Contributing researchers: Susan Wunderink, Shawn Stokes, and Charlie Haley Web specialist: Robert Cooper July 10, 2012
- 2. This research was prepared with generous support from The Rockefeller Foundation. Acknowledgments – The authors are grateful for valuable information and feedback from all participants in the working meeting held at Duke University on March 8, 2012. Many thanks also to Frances Hooper, Michael Replogle, Jason Hellendrung and Martin Zogran. For valuable comments on later drafts, we would like to thank Cliff Henke, Brendon Hemily, Alan Wulkan, Annie Weinstock, and Benjamin de la Pena. None of the opinions or comments expressed in this report are endorsed by the companies mentioned or individuals interviewed. Errors of fact or interpretation remain exclusively with the authors. We welcome comments and suggestions. The lead author can be contacted at marcy.lowe@duke.edu Free copies of this report and the accompanying interactive visualization tool are available at the CGGC website, http://www.cggc.duke.edu/ Cover image by Sasaki Associates, Inc. © July 10, 2012. Center on Globalization, Governance & Competitiveness, Duke University
- 3. List of Abbreviations A&E Architectural and Engineering AC Transit Alameda-Contra Costa Transit District AGC Associated General Contractors of America APC Automated Passenger Counters APTA American Public Transportation Association AVL Automatic Vehicle Location AWEA American Wind Energy Association BRT Bus Rapid Transit CAD Computer Aided Dispatch CCTV Closed-circuit television camera CGGC Center on Globalization, Governance & Competitiveness CM Construction Manager CMAQ Congestion Mitigation and Air Quality Improvement CMGC Construction Manager General Contractor CNG Compressed Natural Gas CTAA Community Transportation Association of America CTS Center for Transportation Studies DB Design-Build DBB Design Bid Build DBE Disadvantaged Enterprise DIF Development Impact Fee DOT Department of Transportation DSR Debt Service Reserve FGIC Financial Guaranty Insurance Company FHWA Federal Highway Administration FMOC Financial Management Oversight Contractors FSA Financial Security Assurance Inc. FSP Full Service Professional FTA Federal Transit Administration GCRTA Greater Cleveland Regional Transit Authority GEC General Engineering Consultant ITDP Institute for Transportation and Development Policy ITS Intelligent Transportation Systems ITSA Intelligent Transportation Society of America (ITSA) KCATA Kansas City Area Transportation Authority LRT Light Rail Transit LTD Lane Transit District MBIA Municipal Bond Investors Assurance Corporation MBTA Massachusetts Bay Transportation Authority MPO Metropolitan Planning Organization NBRTI National BRT Institute NEPA National Environmental Policy Act NOx Nitrogen Oxides OEM Original Equipment Manufacturer PM Particulate Matter PMC Project Management Consultant PMOC Project Management Oversight Contractors PPP Public-Private Partnership REIT Real Estate Investment Trust RFP Request for Proposal RPO Rural Planning Organization RTC Regional Transportation Commission SME Small and Medium Enterprise STP Surface Transportation Program SWF Sovereign Wealth Fund TIF Tax Increment Financing TIFIA Transportation Infrastructure and Finance Innovation TOD Transit-Oriented Development TSP Transit Signal Priority TUF Transport Utility Fee TVM Ticket Vending Machine VAA Vehicle Assist and Automation VMT Vehicle Miles Traveled
- 4. CONTENTS 4 III. BRT Value Chain IV. Potential for a BRT Business Constituency I. Executive Summary V. Conclusion II. Creating High-Quality BRT in the United States VI. Appendix
- 5. Section I. 5 III. BRT Value Chain IV. Potential for a BRT Business Constituency I. Executive Summary V. Conclusion II. Creating High-Quality BRT in the United States VI. Appendix Key Findings
- 6. Key Findings 6 Bus rapid transit (BRT) is increasingly being considered in cities across the United States as a reliable and cost-effective public transit mode. A large part of the appeal of BRT is its flexibility, offering a choice of system features that can be adapted to each community’s needs and constraints. As more U.S. cities look to BRT, they will need to understand the value chain that provides the vehicles, technology, services and financing needed to create a high-quality BRT system. Key Findings: At least 390 firms across the value chain serve markets directly relevant to BRT. The BRT value chain is essentially a public transit value chain. The Center on Globalization, Governance, and Competiveness (CGGC) database of firms excludes those not directly relevant to BRT. In addition, of the total 390 firms identified, half have already supplied an existing BRT project and/or explicitly address BRT on their websites. Experienced full-service professional firms (FSPs) will likely play a crucial role in the development of U.S. BRT. FSPs stretch across all segments of the chain, performing services from architect/engineering to legal matters to finance, communications, branding, and environmental impact. The large FSPs have vital experience in coordinating public and private players and can draw on expertise gained in other infrastructure projects to explore new financing and project delivery approaches for BRT. BRT development promises an increasing role for Intelligent Transportation Systems (ITS). Lead firms face growing competition from new players. Parallel to rapidly expanding technology options, a new value chain sub-segment is emerging: ITS consulting. The finance segment is less developed for BRT compared with rail or highway projects. As more cities begin to embrace BRT—while facing strained state budgets and growing competition for federal dollars— it will be increasingly important to identify key private sector players that can drive innovative finance mechanisms.
- 7. Section II. 7 III. BRT Value Chain IV. Potential for a BRT Business Constituency I. Executive Summary V. Conclusion II. Creating High-Quality BRT in the United States VI. Appendix What is BRT? BRT in the United States The Need for Clear Definitions 10 CGGC Focus Systems The Emerging BRT Standard 10 Features of High-Quality BRT This Report
- 8. What is BRT? 8 Bus rapid transit (BRT) seeks to achieve faster, more reliable bus service via features commonly associated with urban rail systems—for example, running the vehicles on their own right of way, or collecting fares before passengers get on board. At its most developed, BRT can offer speeds and capacities similar to subways—as in Bogotá, Colombia’s TransMilenio—at a much lower capital cost. Yet all BRT systems are far from the same. Each system requires a mix of characteristics uniquely suited to its community. Systems also vary widely in their level of performance.1 Bogotá, Colombia Opened in 2000 Over 54 miles of BRT lines 1.3 million passengers per weekday2 Peak frequency (buses per hour) TransMilenio Photo credit: StreetsBlog, http://www.streetsblog.org/wp-content/uploads/2007/10/img_1265-throngs.jpg
- 9. BRT in the United States 9 Compared to other countries where BRT has been most successful, the United States has lower density land use, higher automobile ownership and less orientation toward public transit—all factors that mean BRT will often look different in U.S. cities. Yet a number of trends suggest that the time is ripe for U.S. BRT: Transit demand is growing Young Americans are driving less and using transit more Capital costs for BRT are usually much lower than for rail transit Competition for federal transit dollars is increasing, making cost-effectiveness more important than ever BRT projects can be developed in less time than rail projects Important: BRT is not a blanket replacement for light rail or other rail options; each transit option has its advantages or disadvantages in any given context Credit: LA Wad Credit: Annie Weinstock, ITDP Credit: MBTA Silver Line Neoplan dual- mode bus at South Station
- 10. Defining BRT 10 Considering the importance of securing federal funding, the project requirements under FTA’s Very Small Starts grant program effectively set a federal minimum definition for BRT in the United States. The Institute for Transportation and Development Policy (ITDP) is currently leading an effort to establish a minimum standard for BRT based on the technical knowledge of the international BRT community. Federal Funding Requirements3 BRT Definitions by Different Authorities4 FTA Very Small Starts FTA Small Starts FTA TCRP NBRTI ITDP A project must be a bus, rail or ferry project and contain the following features: • Transit Stations • Signal Priority/Pre- emption (for Bus/LRT) • Low Floor / Level Boarding Vehicles • Special Branding of Service • Frequent Service - 10 min peak/15 min off peak • Service offered at least 14 hours per day • Existing corridor ridership exceeding 3,000/day • Less than $50 million total cost • Less than $3 million per mile (excluding vehicles) The total project cost must be less than $250 million, with no greater than $75 million in requested Section 5309 Capital Investment Grant funding. In addition, a project must meet one of the following guideway criteria: • Be a fixed guideway for at least 50% of the project length in the peak period –AND/OR- • Be a corridor-based bus project with the following minimum elements: o Substantial Transit Stations o Signal Priority/Pre-emption (for Bus/LRT) o Low Floor / Level Boarding Vehicles o Special Branding of Service o Frequent Service - 10 min peak/15 min off peak o Service offered at least 14 hours per day An enhanced bus system that operates on bus lanes or other transitways in order to combine the flexibility of buses with the efficiency of rail. By doing so, BRT operates at faster speeds, provides greater service reliability and increased customer convenience. It also utilizes a combination of advanced technologies, infrastructure and operational investments that provide significantly better service than traditional bus service. An integrated system of features, services, and amenities that improves the speed, reliability, and identity of bus transit. An innovative, high capacity, lower cost public transit solution that can significantly improve urban mobility. This permanent, integrated system uses buses or specialized vehicles on roadways or dedicated lanes to quickly and efficiently transport passengers to their destinations, while offering the flexibility to meet transit demand. BRT systems can easily be customized to community needs and incorporate state-of-the-art, low-cost technologies that result in more passengers and less congestion. A high-quality bus- based transit system that delivers fast, comfortable, and cost-effective urban mobility through the provision of segregated right-of- way infrastructure, rapid and frequent operations, and excellence in marketing and customer service.
- 11. The Emerging BRT Standard 11 ITDP is developing The BRT Standard, an effort to recognize international best practices by defining three levels of BRT: Gold, Silver, and Bronze. The evolving BRT Standard provides a useful framework for understanding the principal BRT features that together can create a high-quality BRT system. This study uses the BRT Standard to identify 10 high-quality BRT features, as part of the method for establishing the ecosystem of firms to be included in the BRT value chain. Supporters of the BRT Standard5 ITDP is the main convener and secretariat of the BRT Standard. The BRT Standard Committee is composed of the following experts who also represent their institutions unless otherwise indicated by an (*): Walter Hook, ITDP Manfred Breithaupt, GIZ Lloyd Wright, Asian Development Bank* Dario Hidalgo, EMBARQ* Gerhard Menckhoff, World Bank (retired), ITDP Vice President Wagner Colombini Martins, Logit Consultoria Carlos Felipe Pardo, Slow Research Pedro Szasz, Consultant Ulises Navarro, Modelistica Scott Rutherford, University of Washington The emissions scoring detail for buses was recommended by the International Council on Clean Transportation, a member of the Best Practice Network of the ClimateWorks Foundation. Lew Fulton and Tali Trigg of the International Energy Agency have also endorsed the BRT Standard.
- 12. CRITERIA DESCRIPTION SERVICE PLANNING • Off-board fare collection One of the most important factors in reducing travel time and improving the customer experience. • Multiple routes Having multiple routes operate on a single corridor is a good proxy for reduced door-to-door travel times by reducing transfer penalties. • Peak frequency How often the bus comes during peak travel times such as rush hour is a good proxy for quality of service and corridor selection. • Off-peak frequency How often the bus comes during off-peak travel times is a good proxy for quality of service and corridor selection. • Express, limited, and local services One of the most important ways to increase operating speeds and reduce passenger travel times. • Control center Increasingly becoming a requirement for a host of service improvements, such as avoiding bus bunching, monitoring bus operations, identifying problems, and rapidly responding to them. • Located in top ten corridors Will help ensure a significant proportion of passengers benefit from the improvements. • Hours of operations A viable transit service must be available to passengers for as many hours throughout the day and week as possible. Otherwise, passengers could end up stranded or may simply seek another mode. • Multi-corridor network Ideally, BRT should include multiple corridors that intersect and form a network as this expands travel options for passengers and makes the system as a whole, more viable. INFRASTRUCTURE • Busway alignment The busway is best located where conflicts with other traffic can be minimized, especially from turning movements from mixed-traffic lanes. • Segregated right-of-way A segregated right-of-way is vital to ensuring that buses can move quickly and unimpeded by congestion. • Intersection treatments There are several ways to increase bus speeds at intersections, all of which are aimed at increasing the green signal time for the bus lane. Forbidding turns across the bus lane and minimizing the number of traffic-signal phases where possible are the most important. Traffic- signal priority when activated by an approaching BRT vehicle is useful in lower-frequency systems. • Passing lanes at stations Passing lanes at station stops are critical to allow both express and local services. They also allow stations to accommodate a high volume of buses without getting congested from backed-up buses waiting to enter. • Minimizing bus emissions Minimizing bus tailpipe emissions (especially particulate matter (PM) and nitrogen oxides (NOx)) is critical to the health of both passengers and the general urban population. • Stations set back from intersections Stations should be located at least forty meters from intersections to avoid delays, or else delays can be caused when passengers take a long time to board or alight and the docked bus blocks others from pulling through the intersection. If stations are located just before an intersection, the traffic signal can delay buses from moving from the station and thus not allow other buses to pull in. • Center stations Having a single station serving both directions of the BRT system makes transfers easier and more convenient—something that becomes more important as the BRT network expands. • Pavement quality Good-quality pavement ensures better service and operations for a longer period by minimizing the need for maintenance on the busway. The BRT Standard, Version 1.0 Full text available at: http://www.itdp.org/index.php?/microsites/brt-standard/
- 13. CRITERIA DESCRIPTION STATION DESIGN AND STATION-BUS INTERFACE • Platform-level boarding One of the most important ways of reducing boarding and alighting times per passenger. • Safe and comfortable stations One of the main distinguishing features of a BRT system as opposed to standard bus service is a safe and comfortable station environment. • Number of doors on bus The speed of boarding and alighting is partially a function of the number of bus doors. Much like a subway in which a car has multiple wide doors, buses need the same in order to let higher volumes of people on and off the buses. • Docking bays and sub-stops Multiple docking bays and sub-stops not only increase the capacity of a station, they help provide multiple services at the station as well. • Sliding doors in BRT stations Sliding doors where passengers get on and off the buses inside the stations improve the quality of the station environment, reduce the risk of accidents, and prevent pedestrians from entering the station in unauthorized locations. QUALITY OF SERVICE AND PASSENGER INFORMATION SYSTEMS • Branding BRT promises a high quality of service, which is reinforced by having a unique brand and identity. • Passenger information Numerous studies have shown that passenger satisfaction is linked to knowing when the next bus will arrive. Giving passengers information is critical to a positive overall experience. INTEGRATION AND ACCESS • Universal access A BRT system should be accessible to all special needs customers, including those who are physically-, visually-, and/or hearing-impaired, as well as those with temporary disabilities, the elderly, children, parents with strollers, and other load-carrying passengers. • Integration with other public transport Often, when a BRT system is built in a city, a functioning public transport network already exists, be it rail, bus, or minibus. The BRT system should integrate into the rest of the public transport network. • Pedestrian access A BRT system could be extremely well-designed and functioning but if passengers cannot access it safely, it cannot achieve its goals. Good pedestrian access is imperative in BRT system design. Additionally, as a new BRT system is a good opportunity for street and public-space redesign, existing pedestrian environments along the corridor should be improved. • Secure bicycle parking The provision of bicycle parking at stations is necessary for passengers who wish to use bicycles as feeders to the BRT system. Formal bicycle-parking facilities that are secure (either by an attendant or observed by security camera) and weather protected are more likely to be used by passengers. • Bicycle lanes Bicycle-lane networks integrated with the BRT corridor improve customer access, provide a full set of sustainable travel options, and enhance road safety. • Bicycle sharing integration Having the option to make short trips from the BRT corridor by a shared bike is important to providing connectivity to some destinations. The BRT Standard, Version 1.0 Full text available at: http://www.itdp.org/index.php?/microsites/brt-standard/ 13
- 14. 10 High-Quality BRT Features 14 For interactive database, click http://www.cggc.duke.edu/environ ment/cleanenergy/brt/index.php Based on ITDP, The BRT Standard
- 15. 15 1 Stations Passengers board the vehicle at platform level Station is safe and comfortable Space allows several buses to stop at once 6 Integration and Access BRT is integrated with other modes Secure bicycle parking at stations System is accessible to pedestrians and special-needs passengers 2 Branding All vehicles, routes, and stations follow a single unifying brand that promises high-quality service 7 Fare Collection Passengers pay fare before boarding Fare is integrated with other public transport options 3 Passenger Communication Route maps are easy to find Passengers can get real-time information 8 Infrastructure Multiple bus routes can share the same BRT infrastructure BRT vehicles have their own separate right-of-way 4 Vehicles Doors allow many passengers to board or exit at once Vehicles are recognizable and clearly marked Vehicles meet strict emissions standards 9 Service Planning Service operates frequently in peak and off-peak Express, limited, and local services Operates late nights and weekends 5 Intelligent Transportation Systems (ITS) Vehicle tracking and intelligent transportation systems Operation control system to reduce vehicle bunching 10 Value Capture & Innovative Finance Finance is not considered a BRT “feature,” nor is it included in the BRT Standard. It is mentioned here because innovative finance mechanisms are increasingly important for BRT projects facing strained state budgets and competition for federal transit dollars. Innovative finance mechanisms—such as special assessment districts or public/private joint development projects—attempt to capture the increased value of property surrounding a BRT line or corridor, using it to leverage public funding resources and help pay for capital costs. Key private sector stakeholders include real estate developers and investors, law firms and project management consultants. For full description of high-quality features, see The BRT Standard.
- 16. ► This report examines the ecosystem of firms that provide services, vehicles and equipment relevant to BRT projects in the United States. The value chain includes six main segments and 21 sub-segments, each of which is analyzed for industry characteristics. ► The analysis also highlights 10 “CGGC focus” BRT systems to show selected system characteristics, capital costs per mile, federal versus state and local funding, and the relevant supplier firms from each segment of the value chain. Systems were selected based on data availability. See the Appendix for more information on methods. ► Also considered is the potential to develop a business constituency. How can firms across the value chain work together as an assertive industry to promote BRT in the United States? ► Finally, this report includes three interactive databases: 1) 10 high-quality BRT features and the firms that provide them 2) 10 CGGC focus BRT systems, cost and funding data 3) 390 companies in the value chain, firm-level data This Report 16
- 17. Online Data Tools 2) 10 CGGC focus BRT systems, cost and funding data: http://tinyurl.com/7czcgnm 1) 10 high-quality BRT features and the firms that provide them: http://www.cggc.duke.edu/environ ment/cleanenergy/brt/index.php 3) 390 companies in the value chain, firm-level data: http://tinyurl.com/7pmzwjj 17
- 18. Section III. 18 III. BRT Value Chain IV. Potential for a BRT Business Constituency I. Executive Summary V. Conclusion II. Creating High-Quality BRT in the United States VI. Appendix The BRT Value Chain Analysis of Each Value Chain Segment Interactive Database of Firms Condensed List of Firms, by Segment U.S. Map of Firms Interactive Firm-level Data Vendors Used in 10 CGGC Focus Systems
- 19. The BRT Value Chain 19 Finance Manufacture Advocates & Researchers: Transportation, Smart Growth, Community, Environment, Bike/Pedestrian, Labor, Chambers of Commerce, Transit Users, Research Centers/Think Tanks Government: U.S. FTA, U.S. FHWA, U.S. and State DOTs, Elected Officials, MPOs, RPOs, Local Planning/Zoning Public Sources Investors Real Estate Construction Contractors Operation Operation Fuel KEY Public sector Private sector Planning Communications Specialty Architect & Engineering Legal & Government Affairs Funding and Finance Consulting ITS Systems Signal Priority Passenger Communication Maintenance Safety and Security Full-service Professional BRT Vehicles Stations Bicycle Park./Share Fare Collection
- 20. Finance • Segment includes public financial players (federal, state and local governments) and increasingly potential private players • Potential private sector players include investors, who participate in the project itself, and real estate interests, who can participate in potential development opportunities associated with the BRT project, such as transit – oriented development Manufacture • Firms that provide BRT vehicles, shelters/street furniture, and bicycle parking • CGGC database emphasizes U.S.- based firms, since manufactured products procured with federal grant money must comply with Federal Buy America requirements • In exchange for naming rights or advertising space, agencies can get shelters or bicycle sharing programs at low or no cost Construction • Segment includes prime construction contractors with experience in mass transit • Usually represents greatest project cost • Contractors build system according to final design developed by A&E design team • Much activity is performed by local contractors and subcontractors • As the number of major highway infrastructure projects declines, segment shows growing interest in BRT projects, especially those that include road building components Operation • Segment includes firms that provide transit management services, fuel, and maintenance, as well as safety and security—two categories that overlap with the ITS segment • Many opportunities exist for public-private partnerships with transit management companies, arrangements frequently found in Latin America, but not yet common in the United States Planning • Largest segment of the value chain in number of firms • Represents a significant portion of a BRT system’s total capital cost • Involved in all planning and design phases of a BRT project • Includes firms from architects & engineers to financial & legal professionals • Firms perform coordination of public and private players • Involvement is structured according to project delivery method ITS • Firms that provide Intelligent Transportation Systems (ITS) • System Operations, Transit Signal Priority, and Passenger Communication are used in many U.S. BRT systems. • Off-board fare collection, less common in U.S., is considered a high- quality feature • Advanced vehicle assist/automation technologies in Safety/Security are a newer, growing U.S. field ► Six main segments 20
- 21. ► Firms operate within the transit project timeline PLAN •Political Support •Corridor Selection: demand analysis, basic system and operations design •Institutional Arrangements, Stakeholder Coordination, Public- Private Partnership set-up, other partnerships •Impact Studies: alternatives analysis/NEPA (environment, traffic, economic, social, urban form) •Public Participation FUND & FINANCE •Financial Planning: demand analysis, capital and operating costs, funding and finance package •Funding Options: New Starts/Small Starts, State and local funding •Financing Options •Public-Private Partnership Options DESIGN •Physical Design: •Engineering: network, runway, stations, modal integration (bicycles, pedestrians, taxis) •BRT vehicles, bus shelters, fare collection •Operations Planning: bus operations, intermodal integration, ITS, customer service, safety and security, local policies such as traffic restrictions •Branding and Marketing: overall BRT system, BRT vehicles, station design •Land Use and Development projects such as TOD, joint development BUILD •Pre-construction: right-of-way acquisition, utility relocation •Final Impact Studies: NEPA, others •Construction: runways, stations, intermodal elements •Manufacture: BRT vehicles, fare collection, bus shelters, bicycle parking/sharing •Land Use and Development projects MANAGE •System Operations •ITS •Customer service •Maintenance •Safety and security 21 Based on: ITDP Bus Rapid Transit Planning Guide, 2007.
- 22. 22 ►The first three segments of the value chain—Planning, Finance, and Construction—relate differently to the transit agency depending on the method of project delivery Finance Manufacture Public Sources Investors Real Estate Construction Contractors Operation Operation Fuel Planning Communications Specialty Architect & Engineering Legal & Government Affairs Funding and Finance Consulting ITS Systems Signal Priority Passenger Communication Maintenance Safety and Security Full-service Professional BRT Vehicles Stations Bicycle Park./Share Fare Collection
- 23. Adapted from: NDCIC, 2010. See References for additional sources. Subcontractors Agency Prime Contractor Design-Build (DB) Contractors Agency A&E Construction g Construction Manager Construction Manager General Contractor (CMGC) Subcontractors Agency A&E Contractor Design-Bid-Build (DBB) ► Most transit projects use one of three types of delivery • Most widely used • Highest control and risk for transit agency • Lowest bid wins • Can include: • General Engineering Consultant (GEC) • Construction Manager (CM) • Project Management Consultant (PMC) • Expected to increase in prevalence • Middle ground between DBB and DB in terms of control and risk • Offers greater integration between design and build phases • Non-low bid method, so state laws may or may not allow • Second most common • Lowest control and risk for transit agency • Often used for large infrastructure projects • Streamlined process • Reduced risk of cost overruns from construction change orders 23
- 24. 24 ► Sharing of control and risk varies by delivery type 0% 100% 100% Contractor Share of risk and control TransitAgency Shareofriskandcontrol Agency-managed Design-Bid-Build (DBB) GEC CM PMC Construction Manager General Contractor (CMGC) Design-Build (DB) Adapted from: FTA, 2009, p.3-7
- 25. Analysis of Each Value Chain Segment 25
- 26. Architect & Engineering (A&E) Typical core services: • Design – engineering design for corridors, stations, and sometimes maintenance facilities or transit centers, usually to fulfill preliminary engineering/final engineering requirements for FTA funding • Planning – studies/surveys to inform engineering and project design and operations planning, including feasibility studies • Project/Program Management – FTA grant process, especially financial requirements; procurement; public outreach • Construction Management –represent project owner in construction activities; participates in the design process to ensure constructability and manages estimated construction costs; may be responsible for hiring and managing subcontractors Other typical services: • other construction services • environmental services • urban planning, including transit-oriented development, bicycle and pedestrian integration Characteristics of A&E firms in CGGC database: • Some firms provide mostly engineering services or architectural design or planning services (e.g., ZGF Architects LLP) Procurement: Depends on project delivery method {see page X} Firms in this industry plan and design BRT buildings and structures, including road and transit infrastructure, shelters, and sometimes bus maintenance facilities and transit centers. Industry Findings: • Firms are interested in working on BRT projects. 75% of the A&E firms in the CGGC list have documented BRT experience or mention BRT services on their company website. • Having a local/regional headquarters presence is an advantage. About half of the A&E firms with documented BRT experience are local/regional firms. • Alternative project delivery services are a priority. More than half of A&E firms explicitly list construction management and/or project management services on their website. No. of Firms Annual Sales (in millions) No. of Employees No. of Locations (North America) Average Median Average Median Average Median 51 $148.1 $40.5 875 264 17 7 26
- 27. Full‐Service Professional Firms (FSP) Firms in this industry are very large national—and sometimes global—A&E firms that provide a broad suite of services across the value chain, in addition to their core architectural and engineering services. Typical services: • Core A&E services (see A&E) • Environmental • Construction • Funding and finance consulting • ITS consulting • Operations and maintenance consulting • Security and safety consulting Characteristics of FSP firms in CGGC database: Industry Findings: • FSPs or large, national construction firms are usually the prime contractors in a DB project delivery method. • FSPs have expertise in alternative project delivery methods. • In addition to core A&E services, FSPs can provide extensive ITS services, which is important for BRT projects. • Some FSPs have business segments that perform construction. 27 No. of Firms Annual Sales (in millions) No. of Employees No. of Locations (North America) Average Median Average Median Average Median 17 $2,629.2 $949.6 14,672 6000 83 50
- 28. Funding & Finance Consulting Firms in this industry specialize in public transportation funding/finance consulting or project management. They are combined into one industry because funding and finance consulting is a key service offered by project management firms. Typical services: • Federal funding consulting, especially FTA New Starts/Small Starts guidance and application preparation and management • Finance consulting – bonds and other public finance mechanisms; alternative financing methods – public-private partnerships, value capture mechanisms • Project/program management (see A&E) • Construction management (see A&E) • Planning consulting – operations planning, feasibility studies and data collection, market research, procurement • Management consulting – workforce, operations, budget Characteristics of Funding & Finance firms in CGGC database: Industry Findings: • CGGC-identified firms in this space are mostly small to medium-sized firms • The industry can be divided into the following three sub-categories: • firms that provide only transportation funding and finance services (e.g., Public Financial Management, Inc.) • firms that provide only project/program management and/or construction management services (e.g., Gannett Fleming Project Development Corp.) • firms that provide consulting services, such as planning, funding/finance, and project management or construction management (e.g., InfraConsult LLC). 28 No. of Firms Annual Sales (in millions) No. of Employees No. of Locations (North America) Average Median Average Median Average Median 52 $678.8 $2.8 2,144 32 11.7 3
- 29. Legal & Government Affairs Firms in this industry provide public transportation legal and/or government affairs services for public transportation agencies and contractors. Industry Findings: • Firms do not explicitly promote BRT services on their websites, perhaps because the legal services needed for BRT are mostly the same as for LRT and other major mass transit projects. • Many law firms have traditional practices in transportation, construction, and/or real estate law. • Law firms tout experience and services in public-private partnerships. Typical services: • Transportation law • Construction law • Real estate law • Public-private partnerships counsel • Financing counsel – bonds, innovative finance mechanisms • Legal compliance with FTA requirements and other federal laws (e.g., Buy America, NEPA) • Contracts, including government, private, contract negotiation and oversight • Property, including right-of-way acquisition • Dispute resolution • Lobbying • Government affairs, including monitoring of transportation policy and updating and providing counsel for clients • Campaigns for state or local transportation funding initiatives such as new dedicated taxes or assessment districts Characteristics of legal & government affairs firms in CGGC database: 29 No. of Firms Annual Sales (in millions) No. of Employees No. of Locations (North America) Average Median Average Median Average Median 31 $65.7 $33 594 300 7.9 7
- 30. Communications The firms in this industry provide exclusively communications services, including branding and marketing, signage and maps, and/or public outreach. Industry Findings: • This industry faces competition from other industries that include communications in their suite of services. Many A&E, project management, and law/government affairs firms also provide public outreach or branding and marketing services. • Except for advertising firms, most firms are small and specialize in the public transportation market. • A potentially growing service, especially for BRT, is a marketing niche in finding sponsors to purchase naming rights as part of a public-private partnership arrangement. Typical services: • Branding and marketing • Advertising • Signage and maps, including way-finding, bus stop signs, maps, timetables, sign/display fabrication • Public outreach Characteristics of communications firms in CGGC database: 30 No. of Firms Annual Sales (in millions) No. of Employees No. of Locations (North America) Average Median Average Median Average Median 22 $2.3 $1 47 10 2 1
- 31. Specialty Firms in this miscellaneous category provide ITS consulting, safety/security consulting or services, environmental services, research services, or executive search services. Industry Findings: • Some A&E firms also provide ITS consulting, safety/security consulting, environmental services, and/or research services. • Executive search and security services (e.g., security guards) are specialized services not usually offered by A&E firms. • For research firms in the CGGC database, federal research projects represent a large portion of their work. Local agency projects may include consumer surveys/studies. Typical services: • Environmental, including noise/vibration consulting • ITS consulting • Safety/security consulting or services – IT security consulting, guards • Executive search • Consumer surveys 31
- 32. FTA Oversight Contractors.1,2 Grantees receiving FTA funding, including New Starts funding, may be assigned FTA oversight contractors—project management oversight contractors (PMOC) and financial management oversight contractors (FMOC)—to oversee the project on behalf of the FTA. These contractors make sure the projects are on track, within budget, conform to Federal requirements, and are constructed according to approved plans in an efficient and effective manner. FTA oversight contractors may offer technical advice but do not have the authority to sign off on project documents or inspect, approve, or accept construction, vehicles or equipment. FTA contractors are typically A&E firms, have been FTA-approved as a PMOC/FMOC, and are competitively selected for projects. Procurement Requirements.3 FTA requirements and/or state or local laws may also require agencies to contract with a certain percentage of small and medium enterprises (SMEs) and/or disadvantaged business enterprises (DBEs). Federal DBE requirements for projects receiving federal funding is at least 10% of authorized funds. Additional Planning Segment Dynamics: 32
- 33. 33 To date, the bulk of funding for BRT projects has come from federal programs, with state and local sources providing a designated or negotiated match. In a few cases, cities have built BRT projects with little or no federal funding. Federal Funding Sources4 Regional, State and Local Funding Sources5 FTA Grant & Formula Programs “Transit Capital Investment Program” (49 U.S.C. 5309) o Fixed Guideway Modernization o Bus Capital program o New Starts program Small Starts Very Small Starts Urbanized Area Formula Grants program The Interagency Partnership for Sustainable Communities Bus Livability grants ARRA (Recovery Grants) Flexible Funding Surface Transportation Program (STP) Congestion Mitigation and Air Quality Improvement Program (CMAQ) State General funds Taxes: sales, gas, motor vehicle/rental car Vehicle registration/license/title fees Other o State highway funds o Trust funds o Lottery funds o Documentary stamps o Miscellaneous taxes, fees, revenues, assessments Local Local sales tax, local property tax General revenues Highway/road departments (maintenance funds) Federal and State Credit Programs6 Debt Instruments6 Transportation Infrastructure and Finance Innovation Act (TIFIA) State Infrastructure Banks (SIBs) Capital Leasing Revenue Bonds o Fare Box Revenue Bonds o Grant Anticipation Notes Debt Service Reserve (DSR) Advance construction Public Sources
- 34. Boston Silver Line-Washington Street/Phase I 2.4 miles $19.39 Cleveland HealthLine 7.1 miles $7 Boston Silver Line-Waterfront/Phase II 8.9 miles $89.17 Pittsburgh MLK Jr. East Busway 9.1 miles $20.00 Eugene EmX 4 miles $16.46 Oakland San Pablo Rapid 14 miles $0.23 Los Angeles Orange Line 14.2 miles $25.00 Las Vegas MAX and SDX 19 miles $2.72 Kansas City MAX 12 miles $5.49 Los Angeles Metro Rapid 400 miles $0.24 $- $10.00 $20.00 $30.00 $40.00 $50.00 $60.00 $70.00 $80.00 $90.00 $100.00 Costpermile($millions) Selected U.S. BRT systems, by length BRT system Miles Capital costs Cost per mile Federal funding State and local funding Boston Silver Line-Washington Street/Phase I 2.4 $ 46,530,000.00 $19,387,500.00 0% 100% Cleveland HealthLine 7.1 $ 197,182,000.00 $7,000,000.00 50% 50% Boston Silver Line-Waterfront/Phase II 8.9 $ 624,200,000.00 $89,171,428.57 77% 23% Pittsburgh MLK Jr. East Busway 9.1 $ 68,000,000.00 $20,000,000.00 50% 50% Eugene EmX 4.0 $ 65,854,120.00 $ 16,463,530.00 80% 20% Oakland San Pablo Rapid 14.0 $ 3,200,000.00 $228,571.00 N/A N/A Los Angeles Orange Line 14.2 $ 377,600,000.00 $25,000,000.00 7% 93% Las Vegas MAX and SDX 19.0 $ 51,600,000.00 $ 2,715,789.47 82% 18% Kansas City MAX - Main and Troost 12.0 $ 65,854,120.00 $ 5,487,843.33 63% 37% Los Angeles Metro Rapid 400.0 $ 94,000,000.00 $ 235,000.00 77% 23% For interactive database, click http://tinyurl.com/7czcgnm. 10 CGGC Focus Systems: Capital Costs and Funding
- 35. 35 This sub-segment includes 1) municipal bond players, 2) private equity investors, and 3) sovereign wealth funds (SWFs). The analysis focuses on finance mechanisms associated with transportation infrastructure projects in general, with potential relevance for BRT. Investors Sub-segment Findings: • Infrastructure funding in the United States is in crisis. The burden falls largely on state and local governments, which traditionally access municipal bond markets for funding. However, state budget problems are making bond investments less attractive and proposed policies to eliminate municipal bond tax benefits further threaten the market.7 • There is growing interest in innovative finance strategies and new funding sources, especially from investors and SWFs.8 • Public-private partnerships are important vehicles for channeling investment from investors and SWFs, but obstacles remain in the United States, especially regulatory issues.8 • Attracting U.S. investment from SWFs will require major foreign policy initiatives at the national level.7 • Investment in infrastructure currently represents a very small portion of investor investment.8 BRT projects will face additional hurdles in attracting investors. 1) Municipal Bond Market Bonds are a traditional financing tool for governments securing financing for public projects. Key players:9 • Bond Buyers – commercial banks, mutual funds, insurance companies, and others • Rating Agencies – Standard & Poor’s, Moody’s, and Fitch are the three main bond rating agencies in the municipal market • Insurers – buy bonds and re-sell insured bonds, which are secured against default and have lower interest rates. Major bond insurers are Municipal Bond Investors Assurance Corporation (MBIA Corporation), the Ambac Financial Group (AMBAC), the Financial Guaranty Insurance Company (FGIC), and the Financial Security Assurance Inc. (FSA) Company Investors
- 36. 36 Investors 2) Private Equity Interest is growing in the potential for private equity to help finance public infrastructure projects, though it is not common for transit projects at present. Investors are interested in diversifying portfolios with the long-term, stable assets associated with infrastructure.10 Page et al. characterize two types of investors: Strategic and Financial. Strategic investors are typically value chain firms (e.g., A&E, construction) who invest equity in a project for the greater purpose of supporting their industry. Financial investors are focused on direct financial returns. Strategic vs. Financial Investors Adapted from: Page et al., 2008, p.103 Adapted from: ULI, 2012, p. 58 Strategic Financial Goal Benefits from project beyond direct financial returns Financial returns Players • Construction • A&E • Equipment suppliers (e.g., transit vehicles) Investment banks Pension funds Private Equity Infrastructure Funds (PEIF) Financial Capability Wide range: large firms are capable (ample funds), smaller firms are less capable (few funds) Enormous new capacity, primarily through PEIFs; new pension fund focus Rank Investor Name 5-Yr Capital Creation total ($bn) 1 Macquarie Group $31.83 2 Goldman Sachs $10.72 3 Canada Pension Plan Investment Board $9.97 4 Ferrovial $9.42 5 APG Asset Management $7.43 6 Alinda Capital Partners $7.10 7 Energy Capital Partners $7.04 8 Brookfield Asset Management $6.26 9 QIC $6.24 10 La Caisse de dépôt et placement du Québec $5.92 Macquarie and Goldman Sachs are largest infrastructure investors top investors in the infrastructure asset class, 2011
- 37. 37 Investors Sovereign Wealth Funds • SWFs are state-owned investment funds composed of a country’s reserves to be used for investment purposes. • 56% of all SWFs currently invest in infrastructure, a 16% increase since 2011.11 • China has been particularly aggressive in investing in infrastructure investment in Africa and other parts of the world.8 • Abu Dhabi Investment Authority is one of the largest SWF infrastructure investors.11 • Because of its cash availability, SWFs can usually invest directly with concession teams, eliminating fees from financial institution intermediaries and reducing equity payouts to investors.8
- 38. 38 Real Estate Sub-sector Findings: • Fixed-guideway (rail) projects are often associated with an increase in economic development and real estate value, a benefit long assumed to result from a rail line’s “permanent” nature. However, recent experience with BRT suggests that a fixed guideway is not necessary to create a positive effect on real estate and economic activity.12,13 • Real estate development projects such as transit-oriented development or joint development require an intensive stakeholder management process that will involve local authorities, business owners, community organizations, and citizens, in addition to the real estate players.14 • To facilitate coordination, partnerships may form among stakeholders, such as commercial property owners (White Flint Partnership in Montgomery County, MD)15 or diverse community stakeholders (University Circle Inc. in Cleveland).16 This sub-segment encompasses major players in potential real estate development projects associated with BRT projects, including 1) REITs, 2) other large developers, and 3) major employers and institutions. 1) Real Estate Investment Trusts (REITs) REITs are publically traded companies that own and usually manage a portfolio of real estate property. Some REITs also finance real estate projects.17 To qualify for tax benefits, a REIT must distribute at least 90% of its taxable income to its shareholders.18 Major companies include: Simon Property Group, Vornado Realty Trust, ProLogis, and Equity Residential.17 2) Other Large Developers Companies that own, develop, and manage properties. Large developers are involved in all phases of real estate development – from planning and construction to leasing and property management. An example is Lerner Enterprises, based in the DC metro area.19 Lerner is involved in the proposed Montgomery County, MD BRT via a coalition of other developers.15 3) Major Employers and Institutions Local employers and institutions, such as hospitals, universities, or museums located in or near a proposed or existing BRT corridor. The Cleveland Clinic hospital and Cleveland State University were very influential institutional players in the success of the Cleveland HealthLine BRT.14 Real Estate
- 39. Innovative Finance Mechanisms 1) Value Capture – “Refers to circumstances in which the provision of a public service or facilities such as public transportation increases the market value of surrounding real estate, and measures are enacted to capture some or all of that increase to defray public expense. Various mechanisms are used to capture either the current or future value created by public investment” (CTS, 2009). • Assessment Districts – Dedicated taxes from newly established district expected to rise in property value are used toward transportation project costs • Tax Increment Financing District (TIF) – a TIF district is established for a set number of years; property taxes collected in excess of the baseline property value (due to rising property values in the district) are used to pay for the public transportation project • Special Assessment District – properties in the district are taxed or pay a fee in an amount that depends on the benefit the property receives from the transportation project; the taxes/fees are used to pay for the public transportation projects • Development – development investment by real estate interests around the public transportation infrastructure can help fund some transportation facilities (e.g., stations) or surrounding community development • Joint Development – the coordinated development of a transportation facility (e.g., a transit station) and adjacent private real estate development; usually a mechanism used to help fund the transportation facility • Transit‐Oriented Development (TOD) – “compact, mixed‐use development near transit facilities and high‐quality walking environments” (USDOT, 2012) • Air rights – development rights above or below an existing transportation facility • Fees • Development Impact Fees (DIFs) – charges collected from the developer to help pay for new infrastructure and services associated with the new development; fees may be used for off‐site services such as schools or parks • Exactions – similar to DIFs except they are usually contributions that can take the form of an in‐kind local road or other public good on‐site in the new development, rather than a formulaic determined fee that can be applied to an off‐site infrastructure provision • Transportation Utility Fees (TUFs) – based on the notion that transportation networks can be treated like utilities, such as water and wastewater treatment, where fees are based on usage/demand (rather than property taxes); commercial and industrial properties would pay more because they usually use transportation infrastructure more than their relative tax contributions 2) Public‐Private Partnership – arrangement between public and private sectors to acquire, build or maintain a public project (for variety of arrangements, see: http://www.ncppp.org/howpart/ppptypes.shtml) 3) Naming Rights – fees paid for the rights to name a component of the transportation project, usually the transit line or station name 4) User/Market‐Based – mechanisms for collecting fees from drivers in a market‐based approach that seeks to discourage driving and support transit; some or all the revenue would be dedicated to transit • Tolling – fees paid to access a roadway • Congestion pricing – charges for use of a roadway based on the level of congestion • Emissions fees – charges based on air pollution emissions • Vehicle miles traveled (VMT) – charges based on mileage driven
- 40. Examples of Innovative Finance in U.S. BRT Innovative Finance Mechanisms BRT Examples Value Capture Mechanisms Assessment Districts • Tax Increment Financing District (TIF) • Special Assessment District Development • Joint Development • Transit-Oriented Development (TOD) • Air rights Fees • Development Impact Fees (DIFs) • Exactions • Transportation Utility Fees (TUFs) Chicago BRT (planned) – $7 million from new TIF district to match New Starts FTA grant14 Cleveland HealthLine – attracted $4.2 billion in new real estate investment along the corridor14,20 San Francisco Van Ness Avenue BRT (planned) – Proposed financial plan includes Development Impact Fees as a local funding source, and would contribute less than 4.4% of total project funding21 Public-Private Partnership (P3) (Alternative Project Delivery Methods) Las Vegas RTC – RTC outsources all of the operations and maintenance for its fixed bus route services to private transit management firms.22 York Region, Ontario, Canada Viva BRT – In North America’s first transit P3 arrangement of its kind, the transit agency partnered with the York Consortium (made up of 7 firms) to execute the design, building, operation, and maintenance of the Viva BRT23 Naming Rights Cleveland HealthLine – sold naming rights of BRT system to the Cleveland Clinic and University Hospitals for $250,000 annually over 25 years ($3.25 million total); revenue will be used to help cover maintenance costs24 User/Market-Based • Tolling • Congestion pricing • Emissions fees • Vehicle miles traveled (VMT) Los Angeles Orange Line funding consisted almost entirely of non-federal funding sources (93.4%), some of which came from congestion pricing revenue (by charging for use of a roadway based on the level of congestion)14,25
- 41. Contractors Firms in this industry do construction of BRT infrastructure, a function also sometimes performed by large FSPs. Segment also includes involvement by legal and government affairs firms. Industry Findings: • Prime contractors are typically large national or international firms. • Prime contractors also offer construction management and/or project management services. • Prime contractors are also usually responsible for hiring and managing subcontractors. • Since many subcontractors are local, the CGGC database lists only types of subcontractors, with some sample firms. Subcontractor types include heavy construction, electrical, environmental, wrecking and excavating, landscaping, and materials suppliers. • Contractors working on FTA projects are required to furnish three types of bonds—bid bonds, payment bonds, and performance bonds. Characteristics of contractors in CGGC database: • Average (Median) # locations: • Average (Median) # employees: Procurement: Depends on project delivery method 41 No. of Firms Annual Sales (in millions) No. of Employees No. of Locations (North America) Average Median Average Median Average Median 16 $4,595.6 $361.5 8,040 450 7.7 1
- 42. 42 Firms in this sub-segment provide transit management services for large fixed-route systems, ranging from a few services (such as fleet maintenance) to comprehensive management of bus operations. Opportunities exist for public-private partnerships with transit management companies, arrangements frequently found in Latin America. Although outsourcing of operations is not common, it is growing in the United States. Denver and San Diego partly outsource their operations, while Las Vegas has long hired contractors such as Veolia Transportation to manage its entire fixed-route services. Veolia also manages the operations of some of the biggest BRT systems in the world, such as TransMilenio in Bogotá, Colombia.26 Greener bus fleets that use less fuel and emit fewer emissions are a goal of many existing and planned BRT system operators because of the cost savings, environmental benefits, and green marketing opportunities. About one-third of U.S. transit buses use an alternative source of power, with compressed natural gas (CNG) buses representing the most common type of green bus.27 The United States already supports an extensive network of natural gas pipelines and refueling stations.27 The CGGC database includes two major natural gas fuel suppliers for transit agencies, Clean Energy Fuels Corp. and Trillium USA. Firms in this sub-segment include those that provide ITS technology for bus fleet maintenance and monitoring, as well as firms that provide parts, refurbishment, and major repair. The greatest maintenance cost for agencies may be in the capital costs of bus maintenance facilities, which can cost millions of dollars to build and are usually treated as major construction projects on their own, separate from the BRT project. For example, construction of the Las Vegas RTC Sunset Maintenance facility alone cost $90 million.28 Typical maintenance facility features include repair bays, fueling stations, bus wash, bus parking, offices, and others.28 Facilities also offer opportunities to incorporate green building features. Many firms in the Planning and Construction segments in the CGGC database also offer maintenance design/building services. In addition to firms that provide surveillance technology (addressed in this report under ITS), the database includes one firm that provides security staff services, G4S Secure Solutions USA (formerly Wackenhut Corporation), used by the Las Vegas transit system. Some firms in the Planning segment also provide safety and security consulting services. Operation Fuel Maintenance Safety and Security
- 43. 43 Industry Findings: Bus maintenance facilities represent a major capital cost in the Operation segment. Several opportunities exist for firms to provide services in maintenance and operations, ranging from a low to high degree of involvement. On the low end, public transit agencies may contract out some discrete services, such as operations or maintenance. On the high end, as exemplified by the Las Vegas RTC, all fixed-route operations and maintenance are managed by private contractors. Operation Sub-segment No. of Firms Annual Sales (in millions) No. of Employees No. of Locations (North America) Average Median Average Median Average Operation 7 $257.9 $159.0 7,037 2,500 1.1 Fuels 3 $99.0 $2.1 357 28 4.0 Maintenance (parts, refurbishment, and repair only) 6 $9.9 $5.8 91 69 2.7 Safety and Security (security staff services only) 1 $1.4 n/a 50,000 n/a 1.0 Operation Segment Characteristics in CGGC database:
- 44. Automatic Vehicle Location (AVL), used in combination with Computer Aided Dispatch (CAD), is the system used to manage communications with drivers. AVL/CAD supports incident management, improves operational control and on-time performance, and enhances safety. AVL used with predictive systems also enables real-time passenger information. Communications technologies such as radio networks, wireless, cellular, and other emerging technologies provide the infrastructure to support all ITS for BRT. Automated Passenger Counters (APC) are used for performance monitoring and service planning.29,30 Transit Signal Priority (TSP) technology enables automatic changes to the traffic signal control system at an intersection so that it provides priority to transit vehicles. As a BRT vehicle approaches the intersection, the TSP system triggers the traffic controller to modify the signal timing, by extending the green phase or shortening the red phase.29,30 These firms supply ticket vending machines (TVMs) or fare collection/card reader machines and devices, as well as fare media for BRT-caliber systems. The key considerations are that equipment must be sufficiently rugged to be placed in stations that are often exposed to weather, and devices exist to support Proof of Payment enforcement (where required). Smart card technology is advancing rapidly and could dramatically enhance transit fare collection in the future by improving integration of fare collection systems and offering flexible and fast payment methods.32 This group of ITS technologies provides real-time bus and transit information for passengers. Key BRT technologies include: real-time arrival signs, next-stop signs on buses, and mobile apps and website tools.29,30 Mobile technologies in transit are advancing and are expected to become more important in the future.31 Many agencies use technology and software for fleet maintenance and monitoring as part of their operations management. 1) Surveillance, especially mobile closed-circuit television (CCTV) cameras on BRT vehicles.29 2) Vehicle Assist and Automation (VAA) technologies, currently in an experimental phase, for lane guidance and precision docking, to help vehicles line up doors at stations, prevent accidents in narrow spaces, and automate some tasks.33 3) Collision avoidance, with vehicle cameras and other devices that improve visibility behind the vehicle and detect close objects to help the driver avoid collisions, or to monitor driver performance.29 Pedestrian versions, mostly audio warnings of turning buses, are growing in number. Systems Signal Priority Passenger Communication Maintenance Safety and Security Fare Collection 44
- 45. Technology Subcategories Lead Firms System Operations •Automatic Vehicle Location (AVL) •Computer Aided Dispatch (CAD) •Communications technologies •Automated Passenger Counters (APC) ACS (A Xerox company), Clever Devices, INIT, Trapeze ITS Transit Signal Priority Opticom, by Global Traffic Technologies; EMTRAC Systems Los Angeles County Metro uses its own proprietary TSP technology, which is deployed on the extensive Metro Rapid network and the Metro Orange Line Passenger Communication •Real-time arrival signs •Next-stop signs on buses •Mobile applications and website tools NextBus is a popular supplier of real-time arrival signs. The company is also making headway in other passenger communication tools, such as apps Fare Collection •Ticket Vending Machines (TVMs), readers, and validators •Fare media ACS (Xerox), Cubic Transportation Systems, Inc., GFI Genfare, Scheidt & Bachmann Maintenance •Fleet maintenance/monitoring technology and software Fleetwatch, fleet maintenance software by S&A Systems, Inc.; Clever Devices Safety & Security •Surveillance - CCTV •Vehicle Assist and Automation (VAA) - lane guidance, precision docking technologies •Collision avoidance AngelTrax, Axis Communications, and Seon for surveillance firms 45
- 46. • The leaders in ITS for BRT in the U.S. market are ACS (Xerox), Clever Devices, INIT, Siemens (now part of Trapeze ITS), and Trapeze ITS. These lead firms provide comprehensive ITS products and services, from AVL to TSP to fare collection. Competition from other firms is growing.34 • As the array of ITS technologies expands and supplier information becomes more complex, the need for ITS consulting increases. Eleven firms in the CGGC database now specialize in ITS consulting. A number of architect/engineer, full- service professional, and project management firms also provide ITS consulting services. • AVL is already a widely utilized ITS technology. In 2006, nearly 70% of fixed-route transit vehicles (including non-BRT) in the largest agencies in the United States use AVL systems.29 • All 10 CGGC-focus BRT systems use at least some TSP technology. • The ITS industry is growing. In the United States, much activity is focused on mobile passenger communication, fare payment, and vehicle assist and automation technologies, which may greatly enhance BRT systems in the future. According to a recent report by Pike Research, a clean technology market research firm, investment in ITS is growing despite government funding cutbacks. This can be attributed to the much-improved communications technologies needed to support ITS, and also because governments are recognizing the benefits of implementing ITS technologies, such as improved traffic mobility, fuel and emissions reductions, and passenger customer service.35 ITS Industry Findings: 46
- 47. ITS Segment Characteristics in CGGC database: 47 ITS Sub-segment No. of Firms Annual Sales (in millions) No. of Employees No. of Locations (North America) Average Median Average Median Average System Operations 38 $1,470.7 $12.6 6,689 97 11.6 Signal Priority 4 $11.3 $5.9 84 42 8.0 Passenger Communication 11 $59.2 $13.5 357 164 1.5 Fare Collection 11 $220.0 $65.0 871 422 2.0 Maintenance 12 $468.9 $78.0 1,701 444 2.0 Safety/Security* 24 $86.5 $17.2 981 115 3.6 * Excludes outliers
- 48. BRT Vehicles Firms in this industry include U.S. and international original equipment manufacturers (OEMs) that manufacture buses for U.S. BRT systems. Industry findings: • The leading U.S. transit bus OEMs are the leading manufacturers of BRT buses in the United States. • In the United States, transit agencies using Federal funding for purchasing buses must adhere to stringent "Buy America" regulations. • Bus OEMs may need to coordinate closely with agencies and design and branding consultants on particular BRT specifications. • While there is no particular “BRT” bus, widely used industry bus procurement guidelines include optional BRT features.36 Features that provide for rapid, high-capacity boarding—articulated buses, larger/multiple doors, and level boarding—are typical BRT vehicle characteristics promoted by bus OEMs. Other BRT bus characteristics include styling, low-noise, and environmental features (alternative fuels, electric drive technologies).37 Characteristics of BRT Vehicle firms in CGGC database: Procurement: Bus OEMs usually bid for contracts in a traditional RFP process 48 No. of Firms Annual Sales (in millions) No. of Employees No. of Locations (North America) Average Median Average Median Average 14 $137.2 $48.5 1,190 666 1.4
- 49. Stations Firms in this industry manufacture and/or fabricate shelters and street furniture, such as benches and station lighting. Industry findings: • Three types of firms provide shelters and/or furniture: • Manufacture and/or supply only (e.g., Columbia Equipment Company, Inc.) • Also design specialty shelters (e.g., Tolar Manufacturing Company Inc.) • Operate in marketing business model (e.g., Clear Channel Outdoor Holdings) • Some firms supply “BRT” shelters. • Many firms offer solar lighting. • Some firms offer comprehensive services for an entire station– including fare collection machines, signs, and other (e.g., Trueform LLC). • Firms may need to coordinate with design and branding consultants. Characteristics of Shelters/Station firms in CGGC database*: *Excludes outliers Procurement: Firms that supply stations and furniture usually bid for contracts in a traditional RFP process 49 No. of Firms Annual Sales (in millions) No. of Employees No. of Locations (North America) Average Median Average Median Average 21 $22.0 $8.1 152 45 3.5
- 50. Bicycle Parking/Sharing The firms in this industry manufacture and/or fabricate bicycle parking or shelters, or provide bicycle sharing services. Industry findings: • Bicycle parking products include bus racks, station racks, and lockers. • Byk-Rak LLC and Sportworks Northwest Inc. dominate the market for bike racks on transit buses. • Bicycle sharing services are becoming more popular in cities, but they are not necessarily developed as part of a BRT project. • Alta Bicycle Share recently secured contracts in major U.S. cities including Chicago and San Francisco because of its marketing business model, in which the bike share program is largely paid for by corporate sponsorships. • One firm, BikeStation, builds and operates membership-based bike transit facilities where bike commuters can park and use showers. • Large and sophisticated bicycle parking facilities such as those found at terminal TransMilenio stations in Bogotá, Columbia are not yet seen in the United States. Characteristics: of Bicycle Parking/Sharing firms in CGGC database: Procurement: Firms that supply bike parking usually bid for contracts in a traditional RFP process. Bicycle sharing programs thus far are managed as city projects, not as a part of a BRT project. 50 No. of Firms Annual Sales (in millions) No. of Employees No. of Locations (North America) Average Median Average Median Average 11 $3.2 $0.96 27 11 1.1
- 51. List of Firms, by Segment (Not Exhaustive) 51 PLANNING Abt SRBI, Inc. Clear View Strategies, LLC HDR, Inc. LKG‐CMC, Inc. Parsons Brinckerhoff SYSTRA USA (SYSTRA) Acacia Financial Group, Inc. Clough Harbour & Associates LLP (CHA) High Street Consulting Group Lockwood, Andrews & Newman, Inc. Parsons Transportation Group T.Y. Lin International Acumen Building Enterprise, Inc. Connetics Transportation Group, Inc. Hill International, Inc. Louis Berger Group, Inc. Periscope Taliaferro & Browne, Inc. Adams Consulting Cooper Carry HNTB Corporation LS Gallegos & Associates Inc. PGH Wong Engineering, Inc. Thomas Group, Inc. AECOM Creighton Manning Engineer, LLP Hogan Lovells US LLP LSA Design, Inc. PIVOT Architecture Thompson Coburn LLP Akerman Senterfitt Wickwire Gavin CRL Associates, Inc. HOK Group, Inc. LSC Transportation Consultants, Inc. Professional Service Industries, Inc. (PSI) TKDA AllTransit Consultants, LLC David Evans and Associates, Inc. Holland & Knight LLP LTK Engineering Services Public Financial Management, Inc. (PFM) Traffic Group, Inc. Alta Planning + Design Deeplocal, Inc. Huitt‐Zollars Inc. Macro Corporation Public Resources Advisory Group, Inc. Transit Capital Support Services, LLC Andrews Kurth LLP Delcan Corporation IBI Group Maguire Group Pulsar Advertising Transit Marketing, LLC Anil Verma Associates, Inc. Delon Hampton & Associates ICF International, Inc. Maintenance Design Group, LLC R&R Partners Inc. Transit Police & Security Consulting ARCADIS U.S. Inc. Delta Services Group, Inc. Ilium Associates, Inc. MAJIC Consulting Group Raul V. Bravo + Associates, Inc. Transmetrics, Inc. Arthur N. Gaudet & Associates, Inc. DHK Architects InfraConsult LLC Manatt, Phelps & Phillips, LLP RCC Consultants, Inc. Transportation Management & Design Arup Di Domenico + Partners LLP Infrastructure Management Group Mass. Electric Construction Company Redmond Consulting, Inc. Transportation Resource Associates, Inc. Atkins Dikita Engineering Interactive Elements Incorporated McCloud Transportation & Associates Reed Smith LLP TranSystems Corporation Auriga Corporation Dikita Management Services Jacobs Engineering Group Inc. McCormick Rankin Corporation Reichman Frankle Inc. TRC Companies, Inc. AZTEC Engineering Inc. DuPont Sustainable Solutions (DSS) Jakes Associates, Inc. (JAI) McCormick Taylor Reno & Cavanaugh PLLC Urban Engineers, Inc. Ballard Spahr LLP Eckert Seamans Cherin & Mellott, LLC Jeffrey A. Parker & Associates, Inc. McDonough Associates, Inc. Resource International, Inc. URS Corporation BBP & Associates, LLC Edwards Wildman Palmer LLP Jones Lang LaSalle Mercator Advisors LLC RNL Design Van Scoyoc Associates, Inc. Bechtel Enterprises Holdings, Inc. Fleming Environmental, Inc. Jones Worley Communications Michael Baker Corporation RNR Consulting (Rahim Inc.) Vanasse Hangen Brustlin, Inc. Benesch, Friedlander, Coplan & Aronoff Frances Kernodle Associates Jordan & Associates, Inc. MIG, Inc. RS&H VIA Architecture Best Best & Krieger, LLP G4S Secure Solutions (acquired Wackenhut Corp.) K&J Safety and Security Consulting Services, Inc. Mission Group Sasaki Associates, Inc. Visual Marking Systems, Inc. Blank Rome Government Relations LLC Gaddam & Associates, Engineers K&L Gates LLP MMM Group Limited Scully Capital W.S. Sign Design Corp. Bookhardt & O'Toole Gannett Fleming Project Dev’t Corp. Kaplan Kirsch & Rockwell LLP Moore & Associates, Inc. Seifert Graphics, Inc. Watt, Tieder, Hoffar & Fitzgerald, LLP Booz Allen Hamilton Inc. Gannett Fleming, Inc. Keville Enterprises, Inc. Nelson/Nygaard Consulting Associates Sharon Greene + Associates WENDEL Companies Burns & McDonnell, Inc. Generator Group, LLC KFH Group, Inc. Newlands & Company, Inc. (NC3D) Smartmaps Inc. Westat, Inc. Burns Group Genetec Inc. Kimley‐Horn and Associates, Inc. Nixon Peabody LLP Solis Group Whitman, Requardt and Associates, LLP C2 Group, LLC Gensler KKO and Associates, LLC nMomentum Corporation SRF Consulting Group, Inc. Willdan Group, Inc. Cambridge Systematics, Inc. Gilbert Tweed International KLD Associates, Inc. Noble Erickson, Inc. Stanley Consultants, Inc. Williams & Jensen, PLLC CAPtech, Inc. GJB Consulting LLC KPMG LLP Nossaman LLP Stantec Inc. Willoughby Design, Inc. Carmen Group Inc. Goodman Corporation Krauthamer & Associates, Inc. Olsson Associates, Inc. Steer Davies Gleave North America Inc. ZGF Architects LLP CDM Smith Inc. (acq. Wilbur Smith) H.W. Lochner, Inc. Kutak Rock LLP Otak, Inc. Steve Greene & Associates, PLLC CH2M Hill Hanson Bridgett LLP Lathrop & Gage LLP PACO Group, Inc. Stone & Youngberg Charlier Associates, Inc. Hatch Mott MacDonald Lea+Elliott, Inc. Paragon Project Resources, Inc. STV Inc. CHK America Hawkins Delafield & Wood LLP Let's Bus It Publications Inc. Parametrix, Inc. Superlative Group Inc.
- 52. 52 *In 2012, Orion announced it will no longer make transit buses Finance Operation ITS Manufacturing C.P. Braman & Co., Inc. ABC Companies 247 Security Inc. EMTRAC Systems Luminator Technology Group, LLC Strategic Mapping, Inc. Acme Sign, Inc. Gillig LLC Goldman Sachs Alternate Concepts, Inc. (ACI) ACS (A Xerox Company) Enghouse Transportation Mackenzie Laboratories, Inc. Sunrise Systems, Inc. Alta Bicycle Share Handi‐Hut, Inc. Hunt Companies BRC Group (Big Rig Collision) ADT Security Services, Inc. Esri Magnetic Ticket & Label Corp. Syncromatics Corporation American Bicycle Security, Co. Icon Shelter Systems Inc. JPMorgan Chase Clean Energy Fuels Corp. Aimola Communications Solutions, LLC Eurotech, Inc. March Networks Tait Radio Communications Austin Mohawk Inc. Irisbus Iveco Lerner Enterprises Complete Coach Works AngelTrax Bus Video FAAC Inc. MEI, Inc. Teldat Group B‐cycle, LLC Lacor/Streetscape Meridiam Infrastructure First Transit, Inc. Apollo Video Technology Fare Logistics Mentor Engineering, Inc. Telvent USA, Inc. BikeLid, LLC Landscape Forms Northland Research Corporation Keolis Transit America, Inc. ASA Electronics Corporation Fortress Systems International, Inc. Mix Telematics TransTrack Systems, Inc. BikeStation LNI Custom Manufacturing, Inc. O.R. Colan Associates McDonald Transit Associates, Inc. AssetWorks (FleetFocus) Gatekeeper Systems, Inc. Motorola Solutions, Inc. Trapeze ITS USA, LLC Brasco International, Inc. Millennium Transit Services LLC Simon Property Group, Inc. Midwest Bus Corp. Avail Technologies, Inc. Gemalto NextBus TwinVision na, Inc. Byk‐Rak LLC New Flyer Industries Inc. Surety Title Agency, Inc. Mobility Transit Services, LLC Avego GFI Genfare Nextiva Transit Urban Transportation Associates, Inc. Cemusa North American Bus Industries, Inc. (NABI) Construction Mohawk Mfg. & Supply Co. Axion Technologies Ltd. GIRO Inc. Novax Industries Corporation VECOM USA, LLC Central Denver Ironworks, Inc. Nova Bus, Inc. Ames Construction, Inc. MV Transportation, Inc. Axis Communications, Inc. Global Traffic Technologies, LLC (Opticom) Panasonic Security Systems VeriFone Systems, Inc. Clear Channel Outdoor Holdings Orion International* Anthony Allega Cement Contractor, Inc. POMA Automated Fueling, Inc. Cassidian Communications, Inc. Hanover Displays Limited Penta Corporation Vigil Systems Columbia Equipment Company, Inc. PBSC Urban Solutions (BIXI bike system) Bechtel Infrastructure Corporation Signature Transportation Parts & Service Inc. Chevin Fleet Solutions (FleetWave) Harris Corporation Radio Engineering Industries, Inc. (BUS‐WATCH) Vix Technology Creative Pipe, Inc. Proterra, Inc. Comet Electric Inc. Trillium USA CIBER, Inc. HBE Viscom Products Radio Frequency Systems Webtech Wireless Inc. (Quadrant) CycleSafe, Inc. Saris Cycle Group Fluor Corporation Veolia Transportation, Inc. Clever Devices Ltd. Honeywell Video Systems RouteMatch Software, Inc. Zepco Sales & Services, Inc. Daytech Limited Sol, Inc. Granite Construction Computer Sciences Corporation IBM RSM Services Corporation Zonar Systems Dero Bike Rack Company Sportworks Northwest Inc. Griffith Company Cubic Transportation Systems In Motion Technology, Inc. S & A Systems, Inc. (FLEETWATCH) DesignLine Corporation Tolar Manufacturing Company Inc. J.F. White Contracting Co. Daktronics, Inc. INFODEV EDI Inc. Safety Vision, L.P. Dimensional Innovations Trueform LLC Jance & Company LLC Data Display USA, Inc. INIT Innovations in Transportation, Inc. Schedule Masters, Inc. Duo‐Gard Industries, Inc. ValleyCrest Jay Cashman, Inc. Dedicated Micros, Inc. Innovative Electronic Designs, Inc. Scheidt & Bachmann Dura Bike Locker Van Hool Kiewit Corporation Digi International Intec Video Systems, Inc. SDI Enterprises Ebus, Inc. Wrightbus Perk Company, Inc. Digital Recorders, Inc. Intelect Corporation Seon Design, Inc. ElDorado National ‐ California YESCO, LLC Stacy and Witbeck, Inc. DILAX Systems Inc. Interfleet, Inc. Siemens Mobility Enseicom Inc. Stone & Webster, Inc. DriveCam, Inc. InterMotive Vehicle Controls Smart Systems Innovations, LLC Fisher Coachworks, LLC Terrace Construction Company, Inc. Echovision Division of Armatron Iteris, Inc. SmartDrive Systems, Inc. Forms+Surfaces Tutor Perini Corporation Electronic Data Magnetics, Inc. LECIP Holdings Corporation StarTran Software LLC Foton America Bus Co., Inc.
- 53. Vendors Used in 10 CGGC Focus Systems (Not Exhaustive) Value Chain Segment Firm Name Boston MBTA Cleveland GCRTA Eugene LTD Kansas City KCATA Las Vegas RTC Los Angeles Metro Oakland AC Transit Pittsburgh Port Authority PLANNING AECOM ● Anil Verma Associates, Inc. ● Benesch, Friedlander, Coplan & Aronoff LLP ● Booz Allen Hamilton Inc. ● ● Cambridge Systematics, Inc. ● ● CDM Smith Inc. (acquired Wilbur Smith Associates) ● ● Connetics Transportation Group, Inc. ● CRL Associates, Inc. ● G4S Secure Solutions (acquired Wackenhut Corp.) ● Gaddam & Associates, Engineers ● Gannett Fleming Project Development Corp. (GFPDC) ● ● Gannett Fleming, Inc. ● ● Hanson Bridgett LLP ● HNTB Corporation ● IBI Group ● ● ICF International, Inc. ● Jacobs Engineering Group Inc. ● K&J Safety and Security Consulting Services, Inc. ● Keville Enterprises, Inc. ● Kimley‐Horn and Associates, Inc. ● ● Lathrop & Gage LLP ● Louis Berger Group, Inc. ● LS Gallegos & Associates Inc. ● LTK Engineering Services ● Maguire Group ● Maintenance Design Group, LLC ● Manatt, Phelps & Phillips, LLP ● McCormick Rankin Corporation ● ● 53
- 54. Value Chain Segment Firm Name Boston MBTA Cleveland GCRTA Eugene LTD Kansas City KCATA Las Vegas RTC Los Angeles Metro Oakland AC Transit Pittsburgh Port Authority PLANNING Michael Baker Corporation ● Nelson/Nygaard Consulting Associates ● Newlands & Company, Inc. (NC3D) ● ● Olsson Associates, Inc. ● Parametrix, Inc. ● Parsons Brinckerhoff ● ● ● ● ● ● Parsons Transportation Group ● PIVOT Architecture ● Professional Service Industries, Inc. (PSI) ● Pulsar Advertising ● Resource International, Inc. ● Sasaki Associates, Inc. ● Stanley Consultants, Inc. ● STV Inc. ● Superlative Group Inc. ● SYSTRA USA (SYSTRA) ● T.Y. Lin International ● Taliaferro & Browne, Inc. ● Thompson Coburn LLP ● Transportation Management & Design, Inc. (TMD) ● TranSystems Corporation ● ● URS Corporation ● ● Vanasse Hangen Brustlin, Inc. ● Visual Marking Systems, Inc. ● Willdan Group, Inc. ● Willoughby Design, Inc. ● 54
- 55. Value Chain Segment Firm Name Boston MBTA Cleveland GCRTA Eugene LTD Kansas City KCATA Las Vegas RTC Los Angeles Metro Oakland AC Transit Pittsburgh Port Authority FINANCE C.P. Braman & Co., Inc. ● Northland Research Corporation ● O.R. Colan Associates ● Surety Title Agency, Inc. ● CONSTRUCTION Anthony Allega Cement Contractor, Inc. ● J.F. White Contracting Co. ● Jance & Company LLC ● Jay Cashman, Inc. ● Kiewit Corporation ● Perk Company, Inc. ● Stone & Webster, Inc. ● Terrace Construction Company, Inc. ● Tutor Perini Corporation ● OPERA‐ TIONS MV Transportation, Inc. ● Trillium USA ● Veolia Transportation, Inc. ● ● ITS ACS (A Xerox Company) ● Cubic Transportation Systems ● DriveCam, Inc. ● Gemalto ● GFI Genfare ● ● ● GIRO Inc. ● Global Traffic Technologies, LLC (Opticom) ● ● Iteris, Inc. ● Luminator Technology Group, LLC ● ● March Networks ● NextBus ● ● S & A Systems, Inc. (FLEETWATCH) ● ● Scheidt & Bachmann ● Siemens Mobility ● ● ● SmartDrive Systems, Inc. ● Trapeze ITS USA, LLC ● Urban Transportation Associates, Inc. ● Vigil Systems ● 55
- 56. Value Chain Segment Firm Name Boston MBTA Cleveland GCRTA Eugene LTD Kansas City KCATA Las Vegas RTC Los Angeles Metro Oakland AC Transit Pittsburgh Port Authority MANUFACTURING Acme Sign, Inc. ● Brasco International, Inc. ● Byk‐Rak LLC ● Central Denver Ironworks, Inc. ● Clear Channel Outdoor Holdings ● ● Dero Bike Rack Company ● ● Dimensional Innovations ● Dura Bike Locker ● Forms+Surfaces ● Gillig LLC ● ● Icon Shelter Systems Inc. ● Irisbus Iveco ● Landscape Forms ● LNI Custom Manufacturing, Inc. ● New Flyer Industries Inc. ● ● ● North American Bus Industries, Inc. (NABI) ● ● Sportworks Northwest Inc. ● ● Tolar Manufacturing Company Inc. ● Trueform LLC ● ValleyCrest ● Van Hool ● Wrightbus ● YESCO, LLC ● 56
- 57. Section IV. 57 III. BRT Value Chain IV. Potential for a BRT Business Constituency I. Executive Summary V. Conclusion II. Creating High-Quality BRT in the United States VI. Appendix Working Meeting at Duke University 10 Key Takeaways on Building a BRT Business Constituency
- 58. Working meeting at Duke University 35 business and thought leaders met to discuss the potential of building a BRT business constituency Proceedings available at {provide link} 58
- 59. 10 Key Takeaways on Building a BRT Business Constituency 1. BRT is a growing market in the United States and across the globe, with a total network length likely to double by 2020 (Trigg, 2012). 2. Disagreement remains about what is, and what is not, BRT. Views differ regarding whether the BRT definition established by the FTA needs to be modified, and whether a BRT standard could help or hurt the advancement of BRT. 3. It is important to avoid pitting public transit modes against each other when promoting BRT, without making damaging or unfair comparisons with light rail or other alternatives. 4. Although the BRT value chain includes a full range of BRT-relevant firms, it is essentially a public transit value chain, with emphasis on firms directly relevant to BRT. 5. BRT business leaders can benefit from the experience of fast-growing clean-tech industries. For instance, the U.S. wind power industry started with a marginalized technology but quickly transformed into a fast-growing industry with one voice. 6. Ongoing cuts in federal funding highlight the need to identify innovative finance mechanisms and to recognize the associated private sector players that drive them. 7. If a business constituency were to organize in the interest of advancing BRT, it could start by establishing a clear definition of BRT that recognizes the diverse transit needs of communities. 8. A BRT business constituency could support important public policies at all levels—federal, state and local. Priorities include the need to eliminate mode bias in legislation; create tax incentives; create infrastructure banks; and pass enabling legislation for PPPs. 9. Business leaders expressed interest in forming an assertive BRT constituency of some kind, although the future home for such an endeavor was not identified. 10. Participants named many steps they are willing to take—in networking, research, and advocacy—to advance BRT. 59
- 60. Section VI. 60 III. BRT Value Chain IV. Potential for a BRT Business Constituency I. Executive Summary VI. Appendix II. Creating High-Quality BRT in the United States V. Conclusion The BRT Value Chain Main Challenges Recommendations
- 61. The BRT Value Chain 61 This value chain study maps out the ecosystem of firms that provide services, vehicles, and technology for bus rapid transit systems in the United States. The firm-by-firm analysis is layered upon a 10-feature framework to emphasize the most important aspects of high-quality BRT, as identified by ITDP from experience with the world’s most high-performing BRT systems. • The U.S. BRT value chain is well developed, with a large number of experienced firms, many of which are global leaders. Given these strong capabilities, along with cities’ rapidly growing interest in BRT, the future of the BRT “industry” should be bright. • The BRT value chain is essentially a transit value chain—especially in the Planning, Construction, Manufacture and Operation segments. These firms provide many of the same services and products for BRT as for other public transit projects. • The ITS segment is what makes this value chain more uniquely BRT. ITS technologies can dramatically enhance and distinguish the BRT experience for a public not yet familiar with this transit mode. The fast-growing ITS segment is competitive and continues to attract investment even in the economic downturn. It is also robust enough to support its own industry association, ITS America. • The more fully featured a BRT system, the more resources are invested in the Planning and Construction segments in order to develop a thoughtful design, build the infrastructure, and secure the financial, legal, and other supporting services necessary to realize the project.
- 62. Main Challenges 62 1) Available funding may decrease in future years as the role of federal funding remains uncertain. As public funding sources threaten to diminish, it will become increasingly important to find new funding sources and alternative financing mechanisms. This study identifies private investors and real estate interests as two potentially important finance players. • Private investor involvement in transportation infrastructure in the United States has thus far largely been limited to highway projects that can generate a profitable revenue stream (such as toll roads). Similarly, design-build project delivery, while increasingly common in other infrastructure projects, are still rarely used in transit. There is still much to be learned about how private investors and alternative project delivery methods can be used for transit. One barrier is investors’ hesitation to confront the complexities of state and local transportation planning and widely varying regulations governing public- private partnerships. • Real estate interests, including REITs and other large developers, have long assumed that public transit projects require the “permanence” of a rail system to encourage economic development. Experts consider resolving the “permanence” issue especially important to attract these players to BRT. 2) Many public policy makers and the general public are surprisingly unaware of BRT and its benefits. • BRT faces a considerable public awareness gap, especially in distinguishing it from regular bus service. • Inadequate and inconsistent data collection for existing BRT makes it difficult for communities to make fully informed decisions when designing new BRT systems.
- 63. Recommendations 63 Financing Awareness & Information • Conduct further research on innovative finance mechanisms for transit in general, and BRT in particular • Identify potential finance players and their potential role in the BRT value chain • Conduct further research on the effects of existing BRT projects on property values and economic development • Educate institutional investors and sovereign wealth funds about public transit projects for potential investment • Study public-private partnership experience outside the United States for potential models • Support federal policies to facilitate and provide incentives for private investment in public transit • Showcase successful BRT systems to help elected officials, the public, and investors understand the potential of BRT and Transit-Oriented Development • Organize industry lobbying for funding and financing and BRT. Although industry players lack consensus on whether a single industry voice for BRT is needed, there is general agreement on the need to better coordinate BRT players within already established industry organizations such as APTA • Develop a standardized reporting system for documenting BRT system characteristics, performance, and costs • Avoid promoting BRT by disparaging light rail or other transit modes; experience in other emerging value chains—for instance, renewable energy—suggests that negative comparisons with a second, related industry can backfire, damaging both industries
- 64. Section VI. 64 III. BRT Value Chain IV. Potential for a BRT Business Constituency I. Executive Summary V. Conclusion II. Creating High-Quality BRT in the United States VI. Appendix Method Interviews References
- 65. The CGGC BRT database includes 1) firm-level data on 390 firms across the value chain and 2) vendor data and system characteristics on a focus sample of 10 BRT systems in the United States. We reviewed more than 1,000 firms collected from the buyer guides prepared by APTA, the leading industry association; Metro Magazine, a leading industry publication; and the Community Transportation Association of America (CTAA), representing organizations and individuals that support community transportation. To fill in gaps in construction and financial firms, which are typically not included in these sources, we relied on internet research and expert interviews. To ensure that the database captured the lead firms with documented experience in BRT, we surveyed a select group of transit agencies for their BRT vendors. Firms in the CGGC database • BRT-relevant firms in six value chain segments and 21 sub-segments. In the Manufacturing and ITS segments, only firms at the product or OEM level are included. • Firms that 1) have documented BRT experience, 2) mention BRT explicitly on their website, or 3) have public transit bus or light rail experience, and/or provide products or services appropriate for a BRT-scale system (as opposed to rural and small transit systems) • Additional firms identified by industry contacts, transit agencies, and other experts Industry Interviews, Discussions and Survey • Interviews with lead firms in each value chain segment • Participant discussions in a working meeting that convened 35 business and thought leaders, held at Duke University on March 8, 2012 (proceedings available at: http://cggc.duke.edu/pdfs/CGGC_BRT_Meeting_Summary_March2012.pdf) • Survey of selected U.S. transit agencies with BRT systems currently operating or planned Industry Publications • APTA Buyers Guide • Metro Magazine Fact Book 2012 • 2011 CTAA Buyer’s Guide Additional Sources • Institute for Transportation and Development Policy (ITDP), BRT Standard 2012 - to identify features of high-quality BRT; ITDP BRT Planning Guide (June 2007) • FTA BRT reports, including evaluation reports of BRT systems (see: http://fta.dot.gov/12351_4238.html) • National BRT Institute resources on NBRTI website (see: http://nbrti.org/) • Hoovers, LinkedIn – for sales and employee information not found on company websites • For full list of references with complete citations, see References Method 65
- 66. 66 BRT System CGGC Focus Systems (bold) St. Sources FTAa ITDPb NBRTIc Recently studiedd Phoenix Valley Metro LINK - Main Street AZ ● ● El Monte Busway (Greater Los Angeles, CA) CA ● 1. Los Angeles Orange Line CA ● ● ● ● 2. Los Angeles Metro Rapid (multiple routes) CA ● ● ● Los Angeles Silver Line CA ● 3. Oakland San Pablo Rapid CA ● ● ● Livermore Tri-Valley Rapid (Greater San Jose, CA) CA ● Orlando Lynx Lymmo FL ● ● South Miami-Dade Busway FL ● ● Honolulu - City Express! and County Express! HI ● ● 4. Boston Silver Line - Washington Street/Phase I MA ● x ● ● 5. Boston Silver Line - Waterfront/Phase II MA ● x ● ● 6. Kansas City MAX - Main and Troost MO ● ● Albuquerque Rapid Ride NM ● 7. Las Vegas MAX and SDX NV ● ● ● ● Las Vegas Sahara Express NV ● Reno RAPID NV ● Albany BusPlus NY ● New York City Select Bus Services (multiple routes) NY x ● 8. Cleveland HealthLine OH ● ● ● ● 9. Eugene EmX OR ● ● ● ● 10. Pittsburgh MLK Jr. East Busway PA ● ● ● Pittsburgh South Busway PA ● ● Pittsburgh West Busway PA ● ● Salt Lake City MAX UT ● Dale City - Washington, DC BRT VA ● Seattle RapidRide WA ● Snohomish Swift (Greater Seattle, WA) WA ● System evaluated or identified as BRT by Source System evaluated but does not meet ITDP’s requirements to be considered true BRT 10 CGGC Focus Systems: Selecting Systems for Study with the Most Recent and Available Data Sources aFTA BRT system evaluations and other BRT reports: http://fta.dot.gov/12351_423 8.html bITDP 2011 report, Recapturing Global Leadership in Bus Rapid Transit: A Survey of Select U.S. Cities: http://www.itdp.org/document s/20110526ITDP_USBRT_Re port-LR.pdf cNBRTI list of BRT Systems with Project Status (updated May 2012) dNBRTI and Parsons Brinckerhoff 2011 report for FL DOT, Bus Rapid Transit Applications Phase 2: http://www.nbrti.org/docs/pdf /BRT_Applications_PhaseII_Re port_Final12-08-2011.pdf x ●
- 67. Firm Individual Title Date AECOM Jim Lightbody Senior Consultant January 30, 2012 Associated General Contractors of America (AGC) Brian Deery Senior Director, Highway and Transportation Division January 30, 2012 American Wind Energy Association (AWEA) Randy Swisher Former Executive Director February 6, 2012 AWEA Tom Gray Former Executive Director February 2, 2012 GFI Genfare, SPX Kim Green President, GFI Genfare January 20, 2012 Gilbert Tweed International Stephanie Pinson President February 7, 2012 Holland & Knight Jeff Boothe Partner February 3, 2012 InfraConsult Alan Wulkan Managing Partner February 3, 2012 InfraConsult Michael Schneider Managing Partner January 27, 2012 ITDP Michael Replogle Global Policy Director and Founder January 23, 2012 Intelligent Transportation Society of America (ITSA) Radha Neelakantan Transportation Program Specialist January 23, 2012 NABI Bill Coryell Vice President, Western Region Transit Sales January 23, 2012 New Flyer Paul Smith Executive Vice President, Sales and Marketing January 19, 2012 Parsons Brinckerhoff Cliff Henke Senior Analyst January 20, 2012 Sasaki Associates, Inc. Jason Hellendrung Principal, Landscape Architecture Discipline February 1, 2012 Trapeze David Brandauer General Manager of Trapeze ITS USA, LLC January 23, 2012 ZGF Architects, LLP Otto Condon, Ron Stewart, Brian McCarter Principal, Principal, Principal January 23, 2012 Interviews 67
- 68. References Section II. Creating High‐Quality BRT in the United States 1For a comprehensive source of global BRT data, visit http://www.brtdata.org/, a joint project of EMBARQ, Across Latitudes and Cultures ‐ Bus Rapid Transit Centre of Excellence (ALC‐BRT CoE), and the International Energy Agency. 2Bus Rapid Transit Policy Center. (2007). Bogota Transmilenio. Retrieved June 4, 2012, from http://www.gobrt.org/Transmilenio.html. BRT in the United States Baxandall, Phineas, Benjamin Davis and Tony Dutzik. (2012). Transportation and the New Generation: Frontier Group and U.S. PIRG Education Fund. pp. 36. April 5, 2012. http://www.uspirg.org/reports/usp/transportation‐and‐new‐generation. Melaniphy, Michael P. (2012). Testimony of Michael P. Melaniphy, APTA President & CEO, on Federal Transportation Investments for Fiscal Year 2013 before the Senate Committee on Appropriations, Subcommittee on Transportation, Housing and Urban Development, and Related Agencies, March 21, 2012 Washington, D.C.: APTA. http://www.apta.com/gap/testimony/2012/Pages/120319_SenateTestimony.aspx. Defining BRT 3FTA. (2012b). Small Starts Fact Sheet. Retrieved June 13, 2012, from http://fta.dot.gov/12347_5221.html. 3‐‐‐. (2012c). Very Small Starts Fact Sheet. Retrieved June 13, 2012, from http://fta.dot.gov/12347_5221.html. 4‐‐‐. (2012a). Bus Rapid Transit. Retrieved June 13, 2012, from http://fta.dot.gov/about/12351_4240.html. 4NBRTI. (2012). Homepage. Retrieved June 13, 2012, from http://www.nbrti.org/. 4TCRP. (2007). Bus Rapid Transit Practitioner's Guide: TCRP Report 118. Washington, DC: Transit Cooperative Research Program. (See p.1‐1). http://www.community‐wealth.org/_pdfs/tools/tod/tool‐tcrp‐bus‐rapid‐transit.pdf. 4Weinstock, Annie, Walter Hook, Michael Replogle, and Ramon Cruz. (2011). Recapturing Global Leadership in Bus Rapid Transit: A Survey of Select U.S. Cities. New York City, NY: Institute for Transportation and Development Policy. pp. 80. (See p.18). http://www.itdp.org/documents/20110526ITDP_USBRT_Report‐LR.pdf. 68