Downloaded 29 times

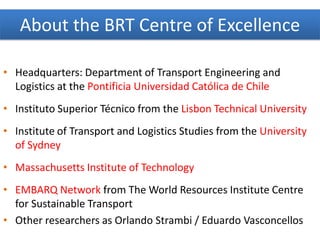
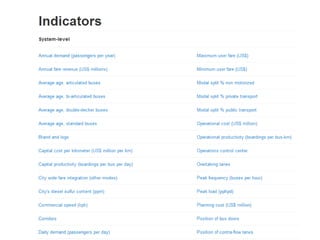


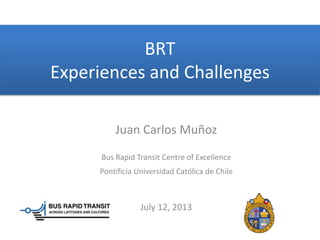

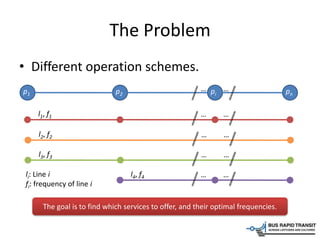


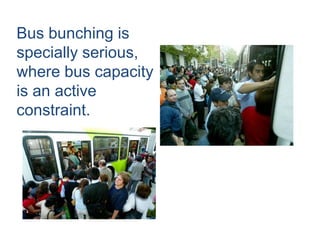

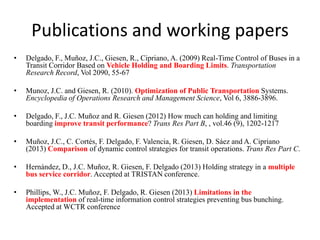
![Common disobedience rate across drivers
8000
9000
10000
11000
12000
13000
14000
15000
0%10%20%30%40%50%60%70%80%90%100%
TotalWaitingTime[Min]
Obedience rate
HRT, Beta=0,5
Sin Control](https://image.slidesharecdn.com/juancarlos-introandflexiblecapacityoperations-130715090424-phpapp02/85/BRT-Workshop-Intro-101-320.jpg)
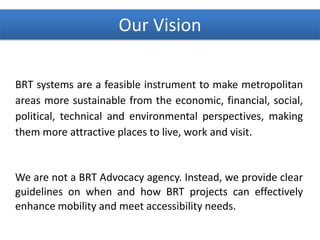
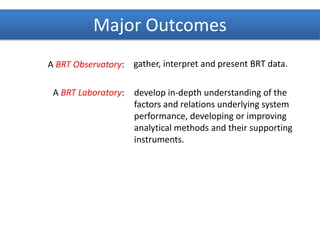
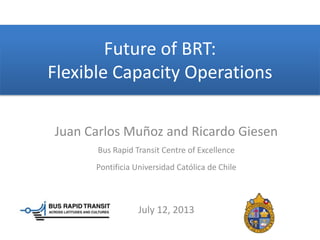
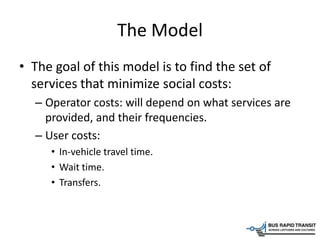
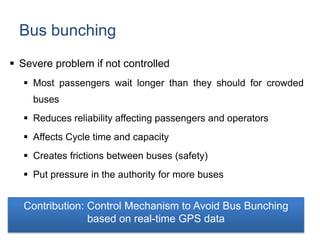
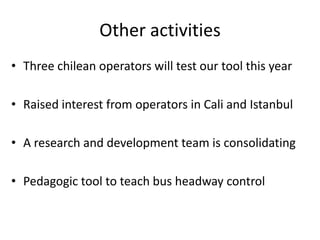
![Full disobedience of a set of drivers
8000
9000
10000
11000
12000
13000
14000
15000
16000
0 1 2 3 4 5 6 7
TotalWaitingTime[Min]
Deaf Buses from a total of 15 buses](https://image.slidesharecdn.com/juancarlos-introandflexiblecapacityoperations-130715090424-phpapp02/85/BRT-Workshop-Intro-102-320.jpg)


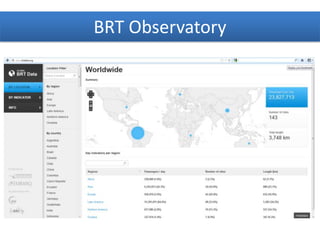
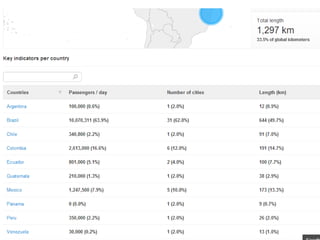
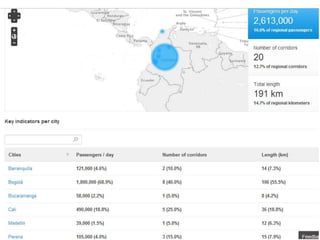
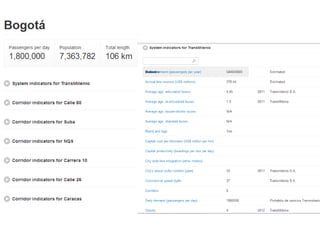
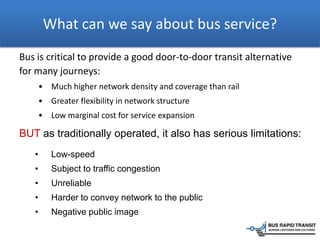
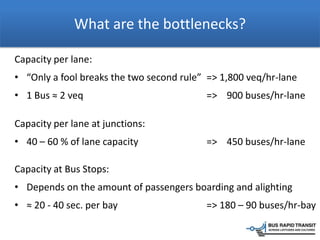
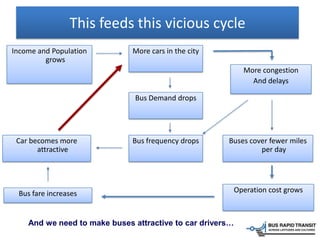
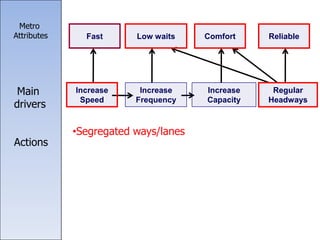
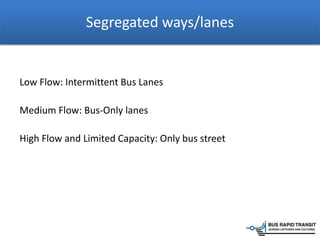
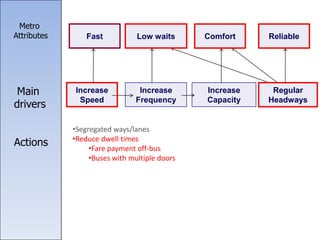
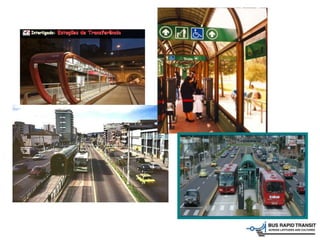
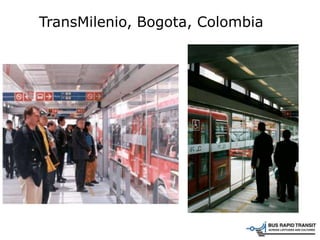
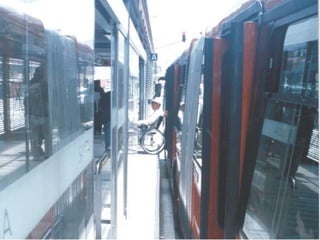
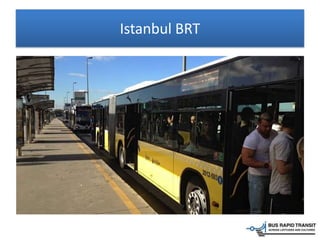
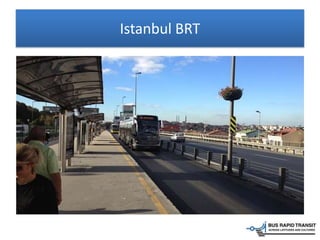
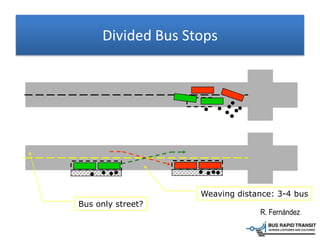
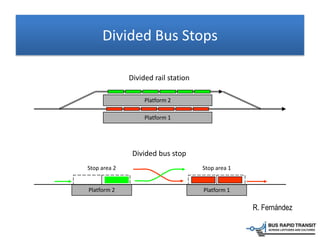
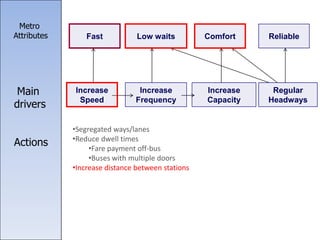
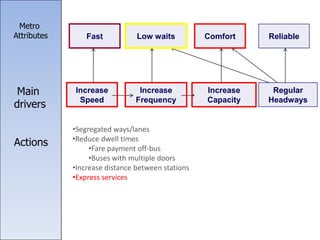
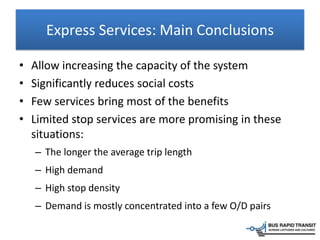
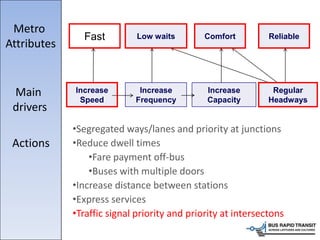
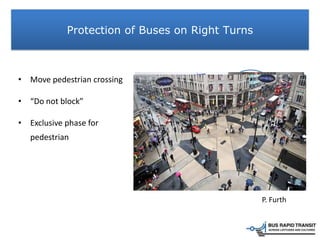
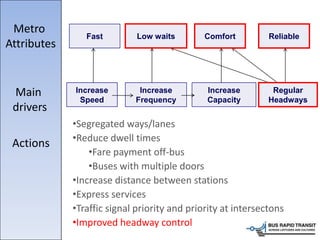
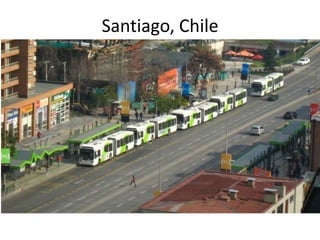
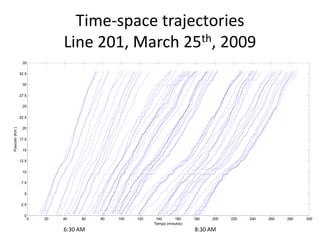
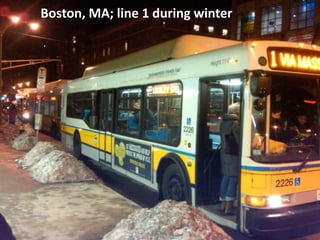
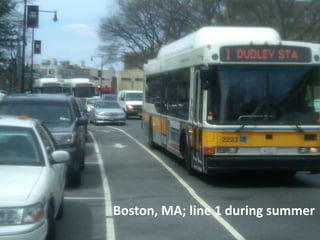
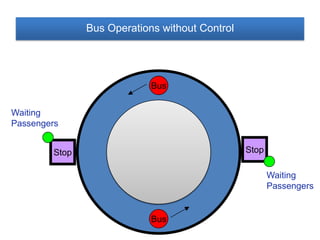
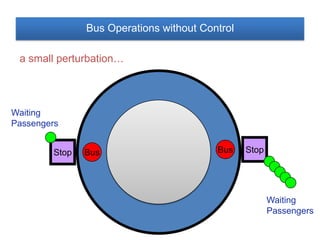
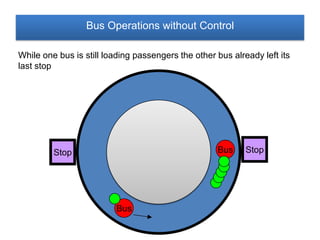
The document outlines the objectives and activities of the Bus Rapid Transit (BRT) Centre of Excellence at Pontificia Universidad Católica de Chile, emphasizing the development of guidelines for effective BRT planning and implementation. It discusses the challenges faced by traditional bus systems, the importance of user experience, and proposes strategies to improve bus services akin to metro systems through enhanced operational practices. Additionally, the document highlights the establishment of a BRT observatory and educational programs aimed at supporting transit system transformation and knowledge dissemination.


![[Transportation] 2. kulrathna(colombo)](https://cdn.slidesharecdn.com/ss_thumbnails/2-140526015343-phpapp02-thumbnail.jpg?width=640&height=640&fit=bounds)


![AIPPTMaker_BRTS__Revolutionizing_Urban_Transportation_(1)[1]22.pptx](https://cdn.slidesharecdn.com/ss_thumbnails/aipptmakerbrtsrevolutionizingurbantransportation1122-250430104943-499fa889-thumbnail.jpg?width=640&height=640&fit=bounds)


