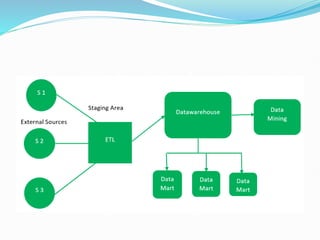
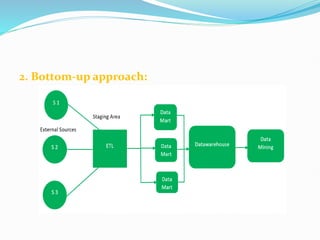
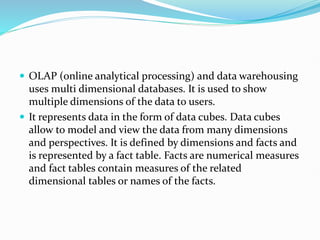
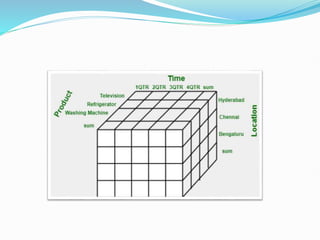
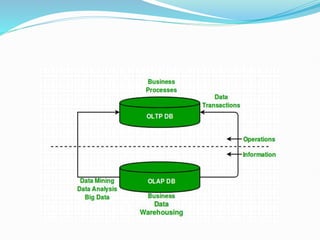
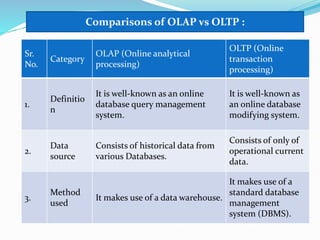
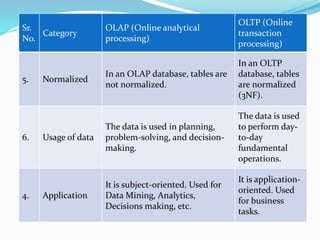
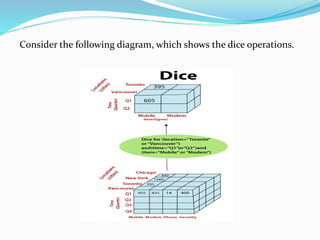
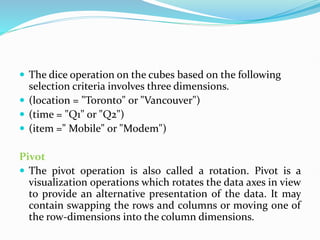
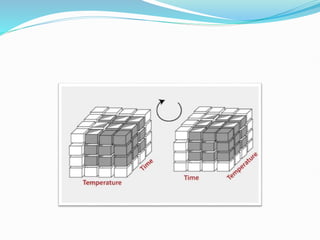
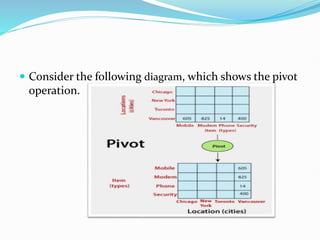
Data Warehousing
Data Warehouse
Data Warehouse:
 A Data Warehouse refers to a place where data can be
stored for useful mining. It is like a quick computer system
with exceptionally huge data storage capacity. Data from
the various organization's systems are copied to the
Warehouse, where it can be fetched and conformed to
delete errors. Here, advanced requests can be made against
the warehouse storage of data.
 Data warehouse combines data from numerous sources which ensure
the data quality, accuracy, and consistency. Data warehouse boosts
system execution by separating analytics processing from transnational
databases. Data flows into a data warehouse from different databases.
A data warehouse works by sorting out data into a pattern that depicts
the format and types of data. Query tools examine the data tables using
patterns.
 Data warehouses and databases both are relative data systems, but
both are made to serve different purposes. A data warehouse is built to
store a huge amount of historical data and empowers fast requests over
all the data, typically using Online Analytical Processing (OLAP). A
database is made to store current transactions and allow quick access to
specific transactions for ongoing business processes, commonly known
as Online Transaction Processing (OLTP).
Important Features of Data Warehouse
The Important features of Data Warehouse are given below:
1. Subject Oriented:
A data warehouse is subject-oriented. It provides useful
data about a subject instead of the company's ongoing
operations, and these subjects can be customers, suppliers,
marketing, product, promotion, etc. A data warehouse
usually focuses on modelling and analysis of data that
helps the business organization to make data-driven
decisions.
2. Time-Variant:
The different data present in the data warehouse provides
information for a specific period.
3. Integrated:
A data warehouse is built by joining data from heterogeneous
sources, such as social databases, level documents, etc.
4. Non- Volatile :
It means, once data entered into the warehouse cannot be
change.
Advantages of Data Warehouse:
 More accurate data access
 Improved productivity and performance
 Cost-efficient
 Consistent and quality data
Benefits of Data Warehouse:
 Understand business trends and make better forecasting
decisions.
 Data Warehouses are designed to perform well enormous
amounts of data.
 The structure of data warehouses is more accessible for end-
users to navigate, understand, and query.
 Queries that would be complex in many normalized databases
could be easier to build and maintain in data warehouses.
 Data warehousing is an efficient method to manage demand for
lots of information from lots of users.
 Data warehousing provide the capabilities to analyze a large
amount of historical data.
Data Warehouse Architecture:
A data-warehouse is a heterogeneous collection of
different data sources organised under a unified schema.
There are 2 approaches for constructing data-warehouse:
Top-down approach and Bottom-up approach are
explained as below.
1. Top-down approach:
The essential components are below:
1. External Sources –
External source is a source from where data is collected
irrespective of the type of data. Data can be structured,
semi structured and unstructured as well.
2. Stage Area –
Since the data, extracted from the external sources does
not follow a particular format, so there is a need to validate
this data to load into data warehouse. For this purpose, it is
recommended to use ETL tool.
 E(Extracted): Data is extracted from External data source.
 T(Transform): Data is transformed into the standard
format.
 L(Load): Data is loaded into data warehouse after
transforming it into the standard format.
 3.Data-warehouse- –
After cleansing of data, it is stored in the data warehouse as
central repository. It actually stores the meta data and the
actual data gets stored in the data marts. Note that data
warehouse stores the data in its purest form in this top-
down approach.
4.DataMarts- –
Data mart is also a part of storage component. It stores the
information of a particular function of an organisation
which is handled by single authority. There can be as many
number of data marts in an organisation depending upon
the functions. Data mart contains subset of the data stored
in data warehouse.
5.DataMining- –
The practice of analysing the big data present in data
warehouse is data mining. It is used to find the hidden
patterns that are present in the database or in data
warehouse with the help of algorithm of data mining. This
approach is defined by Inmon as – data warehouse as a
central repository for the complete organisation and data
marts are created from it after the complete data warehouse
has been created.
2. Bottom-up approach:
1.First, the data is extracted from external sources (same as
happens in top-down approach).
2.Then, the data go through the staging area (as explained above)
and loaded into data marts instead of data warehouse. The data
marts are created first and provide reporting capability. It
addresses a single business area.
3.These data marts are then integrated into data warehouse.
This approach is given by Kinball as – data marts are created
first and provides a thin view for analyses and data warehouse is
created after complete data marts have been created.
Multidimensional Data Model:
 The multi-Dimensional Data Model is a method which is used
for ordering data in the database along with good arrangement
and assembling of the contents in the database.
 The Multi Dimensional Data Model allows customers to
interrogate analytical questions associated with market or
business trends, unlike relational databases which allow
customers to access data in the form of queries. They allow users
to rapidly receive answers to the requests which they made by
creating and examining the data comparatively fast.
 OLAP (online analytical processing) and data warehousing
uses multi dimensional databases. It is used to show
multiple dimensions of the data to users.
 It represents data in the form of data cubes. Data cubes
allow to model and view the data from many dimensions
and perspectives. It is defined by dimensions and facts and
is represented by a fact table. Facts are numerical measures
and fact tables contain measures of the related
dimensional tables or names of the facts.
Working on a Multidimensional Data Model:
The following stages followed by every project for building a
Multi Data Model :
Stage 1 : Assembling data from the client : In first stage, a
Multi Dimensional Data Model collects correct data from the
client. Mostly, software professionals provide simplicity to the
client about the range of data which can be gained with the
selected technology and collect the complete data in detail.
Stage 2 : Grouping different segments of the system : In the
second stage, the Multi Dimensional Data Model recognizes and
classifies all the data to the respective section they belong to and
also builds it problem-free to apply step by step.
Stage 3 : Noticing the different proportions : In the third stage, it is
the basis on which the design of the system is based. In this stage, the
main factors are recognized according to the user’s point of view. These
factors are also known as “Dimensions”.
Stage 4 : Preparing the actual-time factors and their respective
qualities : In the fourth stage, the factors which are recognized in the
previous step are used further for identifying the related qualities.
These qualities are also known as “attributes” in the database.
Stage 5 : Finding the actuality of factors which are listed
previously and their qualities : In the fifth stage, A Multi
Dimensional Data Model separates and differentiates the actuality
from the factors which are collected by it. These actually play a
significant role in the arrangement of a Multi Dimensional Data
Model.
Stage 6 : Building the Schema to place the data, with
respect to the information collected from the steps
above : In the sixth stage, on the basis of the data which
was collected previously, a Schema is built.
OLAP Vs. OLTP
 Online Analytical Processing (OLAP): Online Analytical
Processing consists of a type of software tools that are used
for data analysis for business decisions. OLAP provides an
environment to get insights from the database retrieved
from multiple database systems at one time. Examples –
Any type of Data warehouse system is an OLAP system.
The uses of OLAP are as follows:
 Spotify analyzed songs by users to come up with a
personalized homepage of their songs and playlist.
 Netflix movie recommendation system.
 Online transaction processing (OLTP): Online transaction
processing provides transaction-oriented applications in a 3-tier
architecture. OLTP administers the day-to-day transactions of an
organization.
Examples: Uses of OLTP are as follows:
ATM centre is an OLTP application.
OLTP handles the ACID properties during data transactions via
the application.
It’s also used for Online banking, Online airline ticket booking,
sending a text message, add a book to the shopping cart.
Sr.
No.
Category
OLAP (Online analytical
processing)
OLTP (Online
transaction
processing)
1.
Definitio
n
It is well-known as an online
database query management
system.
It is well-known as
an online database
modifying system.
2.
Data
source
Consists of historical data from
various Databases.
Consists of only of
operational current
data.
3.
Method
used
It makes use of a data warehouse.
It makes use of a
standard database
management
system (DBMS).
Comparisons of OLAP vs OLTP :
Sr.
No.
Category
OLAP (Online analytical
processing)
OLTP (Online
transaction
processing)
5. Normalized
In an OLAP database, tables are
not normalized.
In an OLTP
database, tables
are normalized
(3NF).
6. Usage of data
The data is used in planning,
problem-solving, and decision-
making.
The data is used
to perform day-
to-day
fundamental
operations.
4. Application
It is subject-oriented. Used for
Data Mining, Analytics,
Decisions making, etc.
It is application-
oriented. Used
for business
tasks.
OLAP Operations
1.Roll-Up:
 The roll-up operation (also known as drill-up or
aggregation operation) performs aggregation on a data
cube, by climbing down concept hierarchies, i.e.,
dimension reduction. Roll-up is like zooming-out on the
data cubes.
 Figure shows the result of roll-up operations performed on
the dimension location. The hierarchy for the location is
defined as the Order Street, city, province, or state, country.
The roll-up operation aggregates the data by ascending the
location hierarchy from the level of the city to the level of
the country.
 When a roll-up is performed by dimensions reduction, one
or more dimensions are removed from the cube. For
example, consider a sales data cube having two dimensions,
location and time. Roll-up may be performed by removing,
the time dimensions, appearing in an aggregation of the
total sales by location, relatively than by location and by
time.
Example
Consider the following cubes illustrating temperature of
certain days recorded weekly:
Temperature 64 65 68 69 70 71 72 75 80 81 83 85
Week1 1 0 1 0 1 0 0 0 0 0 1 0
Week2 0 0 0 1 0 0 1 2 0 1 0 0
Consider that we want to set up levels (hot (80-85), mild (70-
75), cool (64-69)) in temperature from the above cubes.
To do this, we have to group column and add up the value
according to the concept hierarchies. This operation is
known as a roll-up.
By doing this, we contain the following cube:
Temperature cool mild hot
Week1 2 1 1
Week2 2 1 1
The roll-up operation groups the information by levels of temperature.
The following diagram illustrates how roll-up works.
2.Drill-Down
 The drill-down operation (also called roll-down) is the
reverse operation of roll-up. Drill-down is like zooming-
in on the data cube. It navigates from less detailed record
to more detailed data. Drill-down can be performed by
either stepping down a concept hierarchy for a dimension
or adding additional dimensions.
 Figure shows a drill-down operation performed on the
dimension time by stepping down a concept hierarchy
which is defined as day, month, quarter, and year. Drill-
down appears by descending the time hierarchy from the
level of the quarter to a more detailed level of the month.
 Because a drill-down adds more details to the given
data, it can also be performed by adding a new
dimension to a cube. For example, a drill-down on the
central cubes of the figure can occur by introducing an
additional dimension, such as a customer group.
Example
Drill-down adds more details to the given data
Temperature cool mild hot
Day 1 0 0 0
Day 2 0 0 0
Day 3 0 0 1
Day 4 0 1 0
Day 5 1 0 0
Day 6 0 0 0
Day 7 1 0 0
Day 8 0 0 0
Day 9 1 0 0
Day 10 0 1 0
Day 11 0 1 0
Day 12 0 1 0
Day 13 0 0 1
Day 14 0 0 0
Slice
 A slice is a subset of the cubes corresponding to a
single value for one or more members of the
dimension. For example, a slice operation is executed
when the customer wants a selection on one
dimension of a three-dimensional cube resulting in a
two-dimensional site. So, the Slice operations perform
a selection on one dimension of the given cube, thus
resulting in a subcube.
 For example, if we make the selection,
temperature=cool we will obtain the following cube:
Temperature cool
Day 1 0
Day 2 0
Day 3 0
Day 4 0
Day 5 1
Day 6 1
Day 7 1
Day 8 1
Day 9 1
Day 11 0
Day 12 0
Day 13 0
Day 14 0
Here Slice is functioning for the dimensions "time" using the criterion time = "Q1".
It will form a new sub-cubes by selecting one or more dimensions.
Dice
 The dice operation describes a subcube by operating a
selection on two or more dimension.
 For example, Implement the selection (time = day 3
OR time = day 4) AND (temperature = cool OR
temperature = hot) to the original cubes we get the
following subcube (still two-dimensional)
Temperature cool hot
Day 3 0 1
Day 4 0 0
Consider the following diagram, which shows the dice operations.
 The dice operation on the cubes based on the following
selection criteria involves three dimensions.
 (location = "Toronto" or "Vancouver")
 (time = "Q1" or "Q2")
 (item =" Mobile" or "Modem")
Pivot
 The pivot operation is also called a rotation. Pivot is a
visualization operations which rotates the data axes in view
to provide an alternative presentation of the data. It may
contain swapping the rows and columns or moving one of
the row-dimensions into the column dimensions.
 Consider the following diagram, which shows the pivot
operation.
Types of OLAP Servers:
There are three main types of OLAP servers are as
following:
1.ROLAP - stands for Relational OLAP, an application based
on relational DBMSs.
 These are intermediate servers which stand in between a
relational back-end server and user frontend tools.
 They use a relational or extended-relational DBMS to save
and handle warehouse data, and OLAP middleware to
provide missing pieces.
 ROLAP servers contain optimization for each DBMS back
end, implementation of aggregation navigation logic, and
additional tools and services.
 ROLAP technology tends to have higher scalability than
MOLAP technology.
 ROLAP systems work primarily from the data that
resides in a relational database, where the base data
and dimension tables are stored as relational tables.
This model permits the multidimensional analysis of
data.
 This technique relies on manipulating the data stored
in the relational database to give the presence of
traditional OLAP's slicing and dicing functionality. In
essence, each method of slicing and dicing is
equivalent to adding a "WHERE" clause in the SQL
statement.
Relational OLAP Architecture
 ROLAP Architecture includes the following
components.
 Database server.
 ROLAP server.
 Front-end tool.
 Relational OLAP (ROLAP) is the latest and fastest-
growing OLAP technology segment in the market. This
method allows multiple multidimensional views of two-
dimensional relational tables to be created, avoiding
structuring record around the desired view.
2.MOLAP stands for Multidimensional OLAP, an application
based on multidimensional DBMSs.
A MOLAP system is based on a native logical model that
directly supports multidimensional data and operations.
Data are stored physically into multidimensional arrays,
and positional techniques are used to access them.
 One of the significant distinctions of MOLAP against
a ROLAP is that data are summarized and are stored in an
optimized format in a multidimensional cube, instead of in
a relational database. In MOLAP model, data are
structured into proprietary formats by client's reporting
requirements with the calculations pre-generated on the
cubes.
MOLAP Architecture
MOLAP Architecture includes the following components
 Database server.
 MOLAP server.
 Front-end tool.
 MOLAP structure primarily reads the precompiled data.
MOLAP structure has limited capabilities to dynamically
create aggregations or to evaluate results which have not
been pre-calculated and stored.
 Applications requiring iterative and comprehensive time-
series analysis of trends are well suited for MOLAP
technology (e.g., financial analysis and budgeting).
 Examples include Arbor Software's Essbase. Oracle's
Express Server, Pilot Software's Lightship Server, Sniper's
TM/1. Planning Science's Gentium and Kenan Technology's
Multiway.
 Some of the problems faced by clients are related to
maintaining support to multiple subject areas in an
RDBMS. Some vendors can solve these problems by
continuing access from MOLAP tools to detailed data in
and RDBMS.
HOLAP stands for Hybrid OLAP, an application using
both relational and multidimensional techniques.
 HOLAP incorporates the best features
of MOLAP and ROLAP into a single architecture. HOLAP
systems save more substantial quantities of detailed data in
the relational tables while the aggregations are stored in
the pre-calculated cubes. HOLAP also can drill through
from the cube down to the relational tables for delineated
data. The Microsoft SQL Server 2000 provides a hybrid
OLAP server.
ROLAP MOLAP HOLAP
ROLAP stands for
Relational Online
Analytical Processing.
MOLAP stands for
Multidimensional Online
Analytical Processing.
HOLAP stands for Hybrid
Online Analytical
Processing.
The ROLAP storage mode
causes the aggregation of
the division to be stored
in indexed views in the
relational database that
was specified in the
partition's data source.
The MOLAP storage
mode principle the
aggregations of the
division and a copy of its
source information to be
saved in a
multidimensional
operation in analysis
services when the
separation is processed.
The HOLAP storage mode
connects attributes of
both MOLAP and ROLAP.
Like MOLAP, HOLAP
causes the aggregation of
the division to be stored
in a multidimensional
operation in an SQL
Server analysis services
instance.
ROLAP MOLAP HOLAP
ROLAP does not because
a copy of the source
information to be stored
in the Analysis services
data folders. Instead,
when the outcome cannot
be derived from the query
cache, the indexed views
in the record source are
accessed to answer
queries.
This MOLAP operation is
highly optimize to
maximize query
performance. The storage
area can be on the
computer where the
partition is described or
on another computer
running Analysis services.
Because a copy of the
source information
resides in the
multidimensional
operation, queries can be
resolved without
accessing the partition's
source record.
HOLAP does not causes a
copy of the source
information to be stored.
For queries that access the
only summary record in
the aggregations of a
division, HOLAP is the
equivalent of MOLAP.
Advantages of Data Mining:
 The Data Mining technique enables organizations to
obtain knowledge-based data.
 Data mining enables organizations to make lucrative
modifications in operation and production.
 Compared with other statistical data applications, data
mining is a cost-efficient.
 Data Mining helps the decision-making process of an
organization.
 It Facilitates the automated discovery of hidden patterns as
well as the prediction of trends and behaviours.
 It can be induced in the new system as well as the existing
platforms.
 It is a quick process that makes it easy for new users to
analyze enormous amounts of data in a short time.
Disadvantages of Data Mining:
 There is a probability that the organizations may sell useful
data of customers to other organizations for money. As per
the report, American Express has sold credit card
purchases of their customers to other organizations.
 Many data mining analytics software is difficult to operate
and needs advance training to work on.
 Different data mining instruments operate in distinct ways
due to the different algorithms used in their design.
Therefore, the selection of the right data mining tools is a
very challenging task.
 The data mining techniques are not precise, so that it may
lead to severe consequences in certain conditions.
Spark
What is Spark?
 Apache Spark is an open-source cluster computing
framework. Its primary purpose is to handle the real-time
generated data.
 Spark was built on the top of the Hadoop MapReduce. It
was optimized to run in memory whereas alternative
approaches like Hadoop's MapReduce writes data to and
from computer hard drives. So, Spark process the data
much quicker than other alternatives.
History of Apache Spark
 The Spark was initiated by Matei Zaharia at UC Berkeley's
AMPLab in 2009. It was open sourced in 2010 under a BSD
license.
 In 2013, the project was acquired by Apache Software
Foundation. In 2014, the Spark emerged as a Top-Level
Apache Project.
Features of Apache Spark:
 Fast- It provides high performance for both batch and
streaming data, using a state-of-the-art DAG scheduler, a
query optimizer, and a physical execution engine.
 Easy to Use- It facilitates to write the application in Java,
Scala, Python, R, and SQL. It also provides more than 80
high-level operators.
 Generality - It provides a collection of libraries including
SQL and DataFrames, MLlib for machine learning,
GraphX, and Spark Streaming.
 Lightweight - It is a light unified analytics engine which is
used for large scale data processing.
Usage of Spark:
 Data integration: The data generated by systems are not
consistent enough to combine for analysis. To fetch
consistent data from systems we can use processes like
Extract, transform, and load (ETL). Spark is used to reduce
the cost and time required for this ETL process.
 Stream processing: It is always difficult to handle the
real-time generated data such as log files. Spark is capable
enough to operate streams of data and refuses potentially
fraudulent operations.
 Interactive analytics: Spark is able to generate the
respond rapidly. So, instead of running pre-defined
queries, we can handle the data interactively.
 Machine learning: Machine learning approaches become
more feasible and increasingly accurate due to
enhancement in the volume of data. As spark is capable of
storing data in memory and can run repeated queries
quickly, it makes it easy to work on machine learning
algorithms.
 Runs Everywhere: It can easily run on Hadoop, Apache
Mesos, Kubernetes, standalone, or in the cloud.
Thanks !!!

Unit-IV-Introduction to Data Warehousing .pptx

  • 1.
  • 2.
    Data Warehouse Data Warehouse: A Data Warehouse refers to a place where data can be stored for useful mining. It is like a quick computer system with exceptionally huge data storage capacity. Data from the various organization's systems are copied to the Warehouse, where it can be fetched and conformed to delete errors. Here, advanced requests can be made against the warehouse storage of data.
  • 4.
     Data warehousecombines data from numerous sources which ensure the data quality, accuracy, and consistency. Data warehouse boosts system execution by separating analytics processing from transnational databases. Data flows into a data warehouse from different databases. A data warehouse works by sorting out data into a pattern that depicts the format and types of data. Query tools examine the data tables using patterns.  Data warehouses and databases both are relative data systems, but both are made to serve different purposes. A data warehouse is built to store a huge amount of historical data and empowers fast requests over all the data, typically using Online Analytical Processing (OLAP). A database is made to store current transactions and allow quick access to specific transactions for ongoing business processes, commonly known as Online Transaction Processing (OLTP).
  • 5.
    Important Features ofData Warehouse The Important features of Data Warehouse are given below: 1. Subject Oriented: A data warehouse is subject-oriented. It provides useful data about a subject instead of the company's ongoing operations, and these subjects can be customers, suppliers, marketing, product, promotion, etc. A data warehouse usually focuses on modelling and analysis of data that helps the business organization to make data-driven decisions. 2. Time-Variant: The different data present in the data warehouse provides information for a specific period.
  • 6.
    3. Integrated: A datawarehouse is built by joining data from heterogeneous sources, such as social databases, level documents, etc. 4. Non- Volatile : It means, once data entered into the warehouse cannot be change. Advantages of Data Warehouse:  More accurate data access  Improved productivity and performance  Cost-efficient  Consistent and quality data
  • 7.
    Benefits of DataWarehouse:  Understand business trends and make better forecasting decisions.  Data Warehouses are designed to perform well enormous amounts of data.  The structure of data warehouses is more accessible for end- users to navigate, understand, and query.  Queries that would be complex in many normalized databases could be easier to build and maintain in data warehouses.  Data warehousing is an efficient method to manage demand for lots of information from lots of users.  Data warehousing provide the capabilities to analyze a large amount of historical data.
  • 8.
    Data Warehouse Architecture: Adata-warehouse is a heterogeneous collection of different data sources organised under a unified schema. There are 2 approaches for constructing data-warehouse: Top-down approach and Bottom-up approach are explained as below. 1. Top-down approach:
  • 10.
    The essential componentsare below: 1. External Sources – External source is a source from where data is collected irrespective of the type of data. Data can be structured, semi structured and unstructured as well. 2. Stage Area – Since the data, extracted from the external sources does not follow a particular format, so there is a need to validate this data to load into data warehouse. For this purpose, it is recommended to use ETL tool.
  • 11.
     E(Extracted): Datais extracted from External data source.  T(Transform): Data is transformed into the standard format.  L(Load): Data is loaded into data warehouse after transforming it into the standard format.  3.Data-warehouse- – After cleansing of data, it is stored in the data warehouse as central repository. It actually stores the meta data and the actual data gets stored in the data marts. Note that data warehouse stores the data in its purest form in this top- down approach.
  • 12.
    4.DataMarts- – Data martis also a part of storage component. It stores the information of a particular function of an organisation which is handled by single authority. There can be as many number of data marts in an organisation depending upon the functions. Data mart contains subset of the data stored in data warehouse. 5.DataMining- – The practice of analysing the big data present in data warehouse is data mining. It is used to find the hidden patterns that are present in the database or in data warehouse with the help of algorithm of data mining. This approach is defined by Inmon as – data warehouse as a central repository for the complete organisation and data marts are created from it after the complete data warehouse has been created.
  • 13.
  • 14.
    1.First, the datais extracted from external sources (same as happens in top-down approach). 2.Then, the data go through the staging area (as explained above) and loaded into data marts instead of data warehouse. The data marts are created first and provide reporting capability. It addresses a single business area. 3.These data marts are then integrated into data warehouse. This approach is given by Kinball as – data marts are created first and provides a thin view for analyses and data warehouse is created after complete data marts have been created.
  • 15.
    Multidimensional Data Model: The multi-Dimensional Data Model is a method which is used for ordering data in the database along with good arrangement and assembling of the contents in the database.  The Multi Dimensional Data Model allows customers to interrogate analytical questions associated with market or business trends, unlike relational databases which allow customers to access data in the form of queries. They allow users to rapidly receive answers to the requests which they made by creating and examining the data comparatively fast.
  • 16.
     OLAP (onlineanalytical processing) and data warehousing uses multi dimensional databases. It is used to show multiple dimensions of the data to users.  It represents data in the form of data cubes. Data cubes allow to model and view the data from many dimensions and perspectives. It is defined by dimensions and facts and is represented by a fact table. Facts are numerical measures and fact tables contain measures of the related dimensional tables or names of the facts.
  • 18.
    Working on aMultidimensional Data Model: The following stages followed by every project for building a Multi Data Model : Stage 1 : Assembling data from the client : In first stage, a Multi Dimensional Data Model collects correct data from the client. Mostly, software professionals provide simplicity to the client about the range of data which can be gained with the selected technology and collect the complete data in detail. Stage 2 : Grouping different segments of the system : In the second stage, the Multi Dimensional Data Model recognizes and classifies all the data to the respective section they belong to and also builds it problem-free to apply step by step.
  • 19.
    Stage 3 :Noticing the different proportions : In the third stage, it is the basis on which the design of the system is based. In this stage, the main factors are recognized according to the user’s point of view. These factors are also known as “Dimensions”. Stage 4 : Preparing the actual-time factors and their respective qualities : In the fourth stage, the factors which are recognized in the previous step are used further for identifying the related qualities. These qualities are also known as “attributes” in the database. Stage 5 : Finding the actuality of factors which are listed previously and their qualities : In the fifth stage, A Multi Dimensional Data Model separates and differentiates the actuality from the factors which are collected by it. These actually play a significant role in the arrangement of a Multi Dimensional Data Model.
  • 20.
    Stage 6 :Building the Schema to place the data, with respect to the information collected from the steps above : In the sixth stage, on the basis of the data which was collected previously, a Schema is built.
  • 21.
    OLAP Vs. OLTP Online Analytical Processing (OLAP): Online Analytical Processing consists of a type of software tools that are used for data analysis for business decisions. OLAP provides an environment to get insights from the database retrieved from multiple database systems at one time. Examples – Any type of Data warehouse system is an OLAP system. The uses of OLAP are as follows:  Spotify analyzed songs by users to come up with a personalized homepage of their songs and playlist.  Netflix movie recommendation system.
  • 22.
     Online transactionprocessing (OLTP): Online transaction processing provides transaction-oriented applications in a 3-tier architecture. OLTP administers the day-to-day transactions of an organization. Examples: Uses of OLTP are as follows: ATM centre is an OLTP application. OLTP handles the ACID properties during data transactions via the application. It’s also used for Online banking, Online airline ticket booking, sending a text message, add a book to the shopping cart.
  • 24.
    Sr. No. Category OLAP (Online analytical processing) OLTP(Online transaction processing) 1. Definitio n It is well-known as an online database query management system. It is well-known as an online database modifying system. 2. Data source Consists of historical data from various Databases. Consists of only of operational current data. 3. Method used It makes use of a data warehouse. It makes use of a standard database management system (DBMS). Comparisons of OLAP vs OLTP :
  • 25.
    Sr. No. Category OLAP (Online analytical processing) OLTP(Online transaction processing) 5. Normalized In an OLAP database, tables are not normalized. In an OLTP database, tables are normalized (3NF). 6. Usage of data The data is used in planning, problem-solving, and decision- making. The data is used to perform day- to-day fundamental operations. 4. Application It is subject-oriented. Used for Data Mining, Analytics, Decisions making, etc. It is application- oriented. Used for business tasks.
  • 26.
    OLAP Operations 1.Roll-Up:  Theroll-up operation (also known as drill-up or aggregation operation) performs aggregation on a data cube, by climbing down concept hierarchies, i.e., dimension reduction. Roll-up is like zooming-out on the data cubes.  Figure shows the result of roll-up operations performed on the dimension location. The hierarchy for the location is defined as the Order Street, city, province, or state, country. The roll-up operation aggregates the data by ascending the location hierarchy from the level of the city to the level of the country.
  • 27.
     When aroll-up is performed by dimensions reduction, one or more dimensions are removed from the cube. For example, consider a sales data cube having two dimensions, location and time. Roll-up may be performed by removing, the time dimensions, appearing in an aggregation of the total sales by location, relatively than by location and by time. Example Consider the following cubes illustrating temperature of certain days recorded weekly:
  • 28.
    Temperature 64 6568 69 70 71 72 75 80 81 83 85 Week1 1 0 1 0 1 0 0 0 0 0 1 0 Week2 0 0 0 1 0 0 1 2 0 1 0 0 Consider that we want to set up levels (hot (80-85), mild (70- 75), cool (64-69)) in temperature from the above cubes. To do this, we have to group column and add up the value according to the concept hierarchies. This operation is known as a roll-up. By doing this, we contain the following cube:
  • 29.
    Temperature cool mildhot Week1 2 1 1 Week2 2 1 1 The roll-up operation groups the information by levels of temperature. The following diagram illustrates how roll-up works.
  • 31.
    2.Drill-Down  The drill-downoperation (also called roll-down) is the reverse operation of roll-up. Drill-down is like zooming- in on the data cube. It navigates from less detailed record to more detailed data. Drill-down can be performed by either stepping down a concept hierarchy for a dimension or adding additional dimensions.  Figure shows a drill-down operation performed on the dimension time by stepping down a concept hierarchy which is defined as day, month, quarter, and year. Drill- down appears by descending the time hierarchy from the level of the quarter to a more detailed level of the month.
  • 32.
     Because adrill-down adds more details to the given data, it can also be performed by adding a new dimension to a cube. For example, a drill-down on the central cubes of the figure can occur by introducing an additional dimension, such as a customer group. Example Drill-down adds more details to the given data
  • 33.
    Temperature cool mildhot Day 1 0 0 0 Day 2 0 0 0 Day 3 0 0 1 Day 4 0 1 0 Day 5 1 0 0 Day 6 0 0 0 Day 7 1 0 0 Day 8 0 0 0 Day 9 1 0 0 Day 10 0 1 0 Day 11 0 1 0 Day 12 0 1 0 Day 13 0 0 1 Day 14 0 0 0
  • 35.
    Slice  A sliceis a subset of the cubes corresponding to a single value for one or more members of the dimension. For example, a slice operation is executed when the customer wants a selection on one dimension of a three-dimensional cube resulting in a two-dimensional site. So, the Slice operations perform a selection on one dimension of the given cube, thus resulting in a subcube.  For example, if we make the selection, temperature=cool we will obtain the following cube:
  • 36.
    Temperature cool Day 10 Day 2 0 Day 3 0 Day 4 0 Day 5 1 Day 6 1 Day 7 1 Day 8 1 Day 9 1 Day 11 0 Day 12 0 Day 13 0 Day 14 0
  • 37.
    Here Slice isfunctioning for the dimensions "time" using the criterion time = "Q1". It will form a new sub-cubes by selecting one or more dimensions.
  • 38.
    Dice  The diceoperation describes a subcube by operating a selection on two or more dimension.  For example, Implement the selection (time = day 3 OR time = day 4) AND (temperature = cool OR temperature = hot) to the original cubes we get the following subcube (still two-dimensional) Temperature cool hot Day 3 0 1 Day 4 0 0
  • 39.
    Consider the followingdiagram, which shows the dice operations.
  • 40.
     The diceoperation on the cubes based on the following selection criteria involves three dimensions.  (location = "Toronto" or "Vancouver")  (time = "Q1" or "Q2")  (item =" Mobile" or "Modem") Pivot  The pivot operation is also called a rotation. Pivot is a visualization operations which rotates the data axes in view to provide an alternative presentation of the data. It may contain swapping the rows and columns or moving one of the row-dimensions into the column dimensions.
  • 42.
     Consider thefollowing diagram, which shows the pivot operation.
  • 43.
    Types of OLAPServers: There are three main types of OLAP servers are as following:
  • 44.
    1.ROLAP - standsfor Relational OLAP, an application based on relational DBMSs.  These are intermediate servers which stand in between a relational back-end server and user frontend tools.  They use a relational or extended-relational DBMS to save and handle warehouse data, and OLAP middleware to provide missing pieces.  ROLAP servers contain optimization for each DBMS back end, implementation of aggregation navigation logic, and additional tools and services.  ROLAP technology tends to have higher scalability than MOLAP technology.
  • 45.
     ROLAP systemswork primarily from the data that resides in a relational database, where the base data and dimension tables are stored as relational tables. This model permits the multidimensional analysis of data.  This technique relies on manipulating the data stored in the relational database to give the presence of traditional OLAP's slicing and dicing functionality. In essence, each method of slicing and dicing is equivalent to adding a "WHERE" clause in the SQL statement.
  • 46.
    Relational OLAP Architecture ROLAP Architecture includes the following components.  Database server.  ROLAP server.  Front-end tool.
  • 48.
     Relational OLAP(ROLAP) is the latest and fastest- growing OLAP technology segment in the market. This method allows multiple multidimensional views of two- dimensional relational tables to be created, avoiding structuring record around the desired view. 2.MOLAP stands for Multidimensional OLAP, an application based on multidimensional DBMSs. A MOLAP system is based on a native logical model that directly supports multidimensional data and operations. Data are stored physically into multidimensional arrays, and positional techniques are used to access them.
  • 49.
     One ofthe significant distinctions of MOLAP against a ROLAP is that data are summarized and are stored in an optimized format in a multidimensional cube, instead of in a relational database. In MOLAP model, data are structured into proprietary formats by client's reporting requirements with the calculations pre-generated on the cubes. MOLAP Architecture MOLAP Architecture includes the following components  Database server.  MOLAP server.  Front-end tool.
  • 51.
     MOLAP structureprimarily reads the precompiled data. MOLAP structure has limited capabilities to dynamically create aggregations or to evaluate results which have not been pre-calculated and stored.  Applications requiring iterative and comprehensive time- series analysis of trends are well suited for MOLAP technology (e.g., financial analysis and budgeting).  Examples include Arbor Software's Essbase. Oracle's Express Server, Pilot Software's Lightship Server, Sniper's TM/1. Planning Science's Gentium and Kenan Technology's Multiway.  Some of the problems faced by clients are related to maintaining support to multiple subject areas in an RDBMS. Some vendors can solve these problems by continuing access from MOLAP tools to detailed data in and RDBMS.
  • 52.
    HOLAP stands forHybrid OLAP, an application using both relational and multidimensional techniques.  HOLAP incorporates the best features of MOLAP and ROLAP into a single architecture. HOLAP systems save more substantial quantities of detailed data in the relational tables while the aggregations are stored in the pre-calculated cubes. HOLAP also can drill through from the cube down to the relational tables for delineated data. The Microsoft SQL Server 2000 provides a hybrid OLAP server.
  • 54.
    ROLAP MOLAP HOLAP ROLAPstands for Relational Online Analytical Processing. MOLAP stands for Multidimensional Online Analytical Processing. HOLAP stands for Hybrid Online Analytical Processing. The ROLAP storage mode causes the aggregation of the division to be stored in indexed views in the relational database that was specified in the partition's data source. The MOLAP storage mode principle the aggregations of the division and a copy of its source information to be saved in a multidimensional operation in analysis services when the separation is processed. The HOLAP storage mode connects attributes of both MOLAP and ROLAP. Like MOLAP, HOLAP causes the aggregation of the division to be stored in a multidimensional operation in an SQL Server analysis services instance.
  • 55.
    ROLAP MOLAP HOLAP ROLAPdoes not because a copy of the source information to be stored in the Analysis services data folders. Instead, when the outcome cannot be derived from the query cache, the indexed views in the record source are accessed to answer queries. This MOLAP operation is highly optimize to maximize query performance. The storage area can be on the computer where the partition is described or on another computer running Analysis services. Because a copy of the source information resides in the multidimensional operation, queries can be resolved without accessing the partition's source record. HOLAP does not causes a copy of the source information to be stored. For queries that access the only summary record in the aggregations of a division, HOLAP is the equivalent of MOLAP.
  • 56.
    Advantages of DataMining:  The Data Mining technique enables organizations to obtain knowledge-based data.  Data mining enables organizations to make lucrative modifications in operation and production.  Compared with other statistical data applications, data mining is a cost-efficient.  Data Mining helps the decision-making process of an organization.  It Facilitates the automated discovery of hidden patterns as well as the prediction of trends and behaviours.
  • 57.
     It canbe induced in the new system as well as the existing platforms.  It is a quick process that makes it easy for new users to analyze enormous amounts of data in a short time. Disadvantages of Data Mining:  There is a probability that the organizations may sell useful data of customers to other organizations for money. As per the report, American Express has sold credit card purchases of their customers to other organizations.
  • 58.
     Many datamining analytics software is difficult to operate and needs advance training to work on.  Different data mining instruments operate in distinct ways due to the different algorithms used in their design. Therefore, the selection of the right data mining tools is a very challenging task.  The data mining techniques are not precise, so that it may lead to severe consequences in certain conditions.
  • 59.
    Spark What is Spark? Apache Spark is an open-source cluster computing framework. Its primary purpose is to handle the real-time generated data.  Spark was built on the top of the Hadoop MapReduce. It was optimized to run in memory whereas alternative approaches like Hadoop's MapReduce writes data to and from computer hard drives. So, Spark process the data much quicker than other alternatives.
  • 60.
    History of ApacheSpark  The Spark was initiated by Matei Zaharia at UC Berkeley's AMPLab in 2009. It was open sourced in 2010 under a BSD license.  In 2013, the project was acquired by Apache Software Foundation. In 2014, the Spark emerged as a Top-Level Apache Project.
  • 61.
    Features of ApacheSpark:  Fast- It provides high performance for both batch and streaming data, using a state-of-the-art DAG scheduler, a query optimizer, and a physical execution engine.  Easy to Use- It facilitates to write the application in Java, Scala, Python, R, and SQL. It also provides more than 80 high-level operators.  Generality - It provides a collection of libraries including SQL and DataFrames, MLlib for machine learning, GraphX, and Spark Streaming.  Lightweight - It is a light unified analytics engine which is used for large scale data processing.
  • 62.
    Usage of Spark: Data integration: The data generated by systems are not consistent enough to combine for analysis. To fetch consistent data from systems we can use processes like Extract, transform, and load (ETL). Spark is used to reduce the cost and time required for this ETL process.  Stream processing: It is always difficult to handle the real-time generated data such as log files. Spark is capable enough to operate streams of data and refuses potentially fraudulent operations.
  • 63.
     Interactive analytics:Spark is able to generate the respond rapidly. So, instead of running pre-defined queries, we can handle the data interactively.  Machine learning: Machine learning approaches become more feasible and increasingly accurate due to enhancement in the volume of data. As spark is capable of storing data in memory and can run repeated queries quickly, it makes it easy to work on machine learning algorithms.  Runs Everywhere: It can easily run on Hadoop, Apache Mesos, Kubernetes, standalone, or in the cloud.
  • 64.