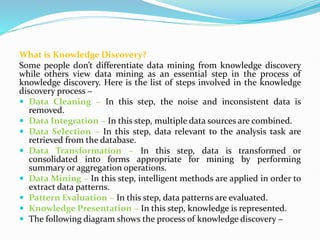
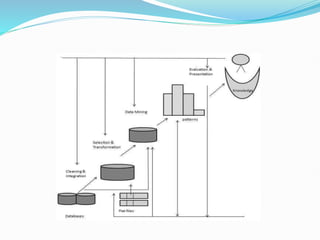
Data Mining
What is Data Mining?
 The process of extracting information to identify patterns, trends, and
useful data that would allow the business to take the data-driven
decision from huge sets of data is called Data Mining.
Advantages of Data Mining:
 The Data Mining technique enables organizations to obtain
knowledge-based data.
 Data mining enables organizations to make lucrative modifications in
operation and production.
 Compared with other statistical data applications, data mining is a
cost-efficient.
 Data Mining helps the decision-making process of an organization.
 It Facilitates the automated discovery of hidden patterns as well as the
prediction of trends and behaviours.
 It can be induced in the new system as well as the existing platforms.
 It is a quick process that makes it easy for new users to analyze
enormous amounts of data in a short time.
Disadvantages of Data Mining:
 There is a probability that the organizations may sell useful data of
customers to other organizations for money. As per the report,
American Express has sold credit card purchases of their customers to
other organizations.
 Many data mining analytics software is difficult to operate and needs
advance training to work on.
 The data mining techniques are not precise, so that it may lead to
severe consequences in certain conditions.
 Different data mining instruments operate in distinct ways due to the
different algorithms used in their design. Therefore, the selection of
the right data mining tools is a very challenging task.
Data mining Task:
Data mining deals with the kind of patterns that can be mined. On the
basis of the kind of data to be mined, there are two categories of functions
involved in Data Mining −
 Descriptive
 Classification and Prediction
1. Descriptive Function
The descriptive function deals with the general properties of data in the
database. Here is the list of descriptive functions −
 Class/Concept Description
 Mining of Frequent Patterns
 Mining of Associations
 Mining of Correlations
 Mining of Clusters
Class/Concept Description
Class/Concept refers to the data to be associated with the classes or
concepts. For example, in a company, the classes of items for sales include
computer and printers, and concepts of customers include big spenders
and budget spenders. Such descriptions of a class or a concept are called
class/concept descriptions. These descriptions can be derived by the
following two ways −
 Data Characterization − This refers to summarizing data of class
under study. This class under study is called as Target Class.
 Data Discrimination − It refers to the mapping or classification of a
class with some predefined group or class.
Mining of Frequent Patterns
 Frequent patterns are those patterns that occur frequently in
transactional data. Here is the list of kind of frequent patterns −
 Frequent Item Set − It refers to a set of items that frequently
appear together, for example, milk and bread.
 Frequent Subsequence − A sequence of patterns that occur
frequently such as purchasing a camera is followed by memory
card.
 Frequent Sub Structure − Substructure refers to different
structural forms, such as graphs, trees, or lattices, which may be
combined with item-sets or subsequences.
Mining of Association
 Associations are used in retail sales to identify patterns that are
frequently purchased together. This process refers to the process of
uncovering the relationship among data and determining association
rules.
 For example, a retailer generates an association rule that shows that
70% of time milk is sold with bread and only 30% of times biscuits are
sold with bread.
Mining of Correlations
 It is a kind of additional analysis performed to uncover interesting
statistical correlations between associated-attribute-value pairs or
between two item sets to analyze that if they have positive, negative or
no effect on each other.
Mining of Clusters
 Cluster refers to a group of similar kind of objects. Cluster analysis
refers to forming group of objects that are very similar to each other but
are highly different from the objects in other clusters.
2. Classification and Prediction
 Classification is the process of finding a model that describes the data
classes or concepts. The purpose is to be able to use this model to
predict the class of objects whose class label is unknown. This derived
model is based on the analysis of sets of training data. The derived
model can be presented in the following forms −
 Classification (IF-THEN) Rules
 Decision Trees
 Mathematical Formulae
 Neural Networks
The list of functions involved in these processes are as follows −
 Classification − It predicts the class of objects whose class label is
unknown. Its objective is to find a derived model that describes and
distinguishes data classes or concepts. The Derived Model is based on
the analysis set of training data i.e. the data object whose class label is
well known.
 Prediction − It is used to predict missing or unavailable numerical
data values rather than class labels. Regression Analysis is generally
used for prediction. Prediction can also be used for identification of
distribution trends based on available data.
 Outlier Analysis − Outliers may be defined as the data objects that do
not comply with the general behavior or model of the data available.
 Evolution Analysis − Evolution analysis refers to the description and
model regularities or trends for objects whose behavior changes over
time.
Data Mining Issues:
Data mining is not an easy task, as the algorithms used can get very
complex and data is not always available at one place. It needs to be
integrated from various heterogeneous data sources. These factors also
create some issues. Here in this tutorial, we will discuss the major issues
regarding −
 Mining Methodology and User Interaction
 Performance Issues
 Diverse Data Types Issues
 The following diagram describes the major issues.
Mining Methodology and User Interaction Issues
It refers to the following kinds of issues −
 Mining different kinds of knowledge in databases − Different users may be
interested in different kinds of knowledge. Therefore it is necessary for data
mining to cover a broad range of knowledge discovery task.
 Interactive mining of knowledge at multiple levels of abstraction − The
data mining process needs to be interactive because it allows users to focus the
search for patterns, providing and refining data mining requests based on the
returned results.
 Incorporation of background knowledge − To guide discovery process and
to express the discovered patterns, the background knowledge can be used.
Background knowledge may be used to express the discovered patterns not
only in concise terms but at multiple levels of abstraction.
 Data mining query languages and ad hoc data mining − Data Mining
Query language that allows the user to describe ad hoc mining tasks, should be
integrated with a data warehouse query language and optimized for efficient
and flexible data mining.
 Presentation and visualization of data mining results − Once the
patterns are discovered it needs to be expressed in high level languages,
and visual representations. These representations should be easily
understandable.
 Handling noisy or incomplete data − The data cleaning methods are
required to handle the noise and incomplete objects while mining the
data regularities. If the data cleaning methods are not there then the
accuracy of the discovered patterns will be poor.
 Pattern evaluation − The patterns discovered should be interesting
because either they represent common knowledge or lack novelty.
Performance Issues
There can be performance-related issues such as follows −
 Efficiency and scalability of data mining algorithms − In order to
effectively extract the information from huge amount of data in
databases, data mining algorithm must be efficient and scalable.
 Parallel, distributed, and incremental mining algorithms − The
factors such as huge size of databases, wide distribution of data, and
complexity of data mining methods motivate the development of
parallel and distributed data mining algorithms. These algorithms
divide the data into partitions which is further processed in a parallel
fashion. Then the results from the partitions is merged. The
incremental algorithms, update databases without mining the data
again from scratch.
Diverse Data Types Issues
 Handling of relational and complex types of data − The database
may contain complex data objects, multimedia data objects, spatial
data, temporal data etc. It is not possible for one system to mine all
these kind of data.
 Mining information from heterogeneous databases and global
information systems − The data is available at different data sources
on LAN or WAN. These data source may be structured, semi structured
or unstructured. Therefore mining the knowledge from them adds
challenges to data mining.
What is Knowledge Discovery?
Some people don’t differentiate data mining from knowledge discovery
while others view data mining as an essential step in the process of
knowledge discovery. Here is the list of steps involved in the knowledge
discovery process −
 Data Cleaning − In this step, the noise and inconsistent data is
removed.
 Data Integration − In this step, multiple data sources are combined.
 Data Selection − In this step, data relevant to the analysis task are
retrieved from the database.
 Data Transformation − In this step, data is transformed or
consolidated into forms appropriate for mining by performing
summary or aggregation operations.
 Data Mining − In this step, intelligent methods are applied in order to
extract data patterns.
 Pattern Evaluation − In this step, data patterns are evaluated.
 Knowledge Presentation − In this step, knowledge is represented.
 The following diagram shows the process of knowledge discovery −
Difference between KDD and Data Mining
 Although the two terms KDD and Data Mining are heavily used
interchangeably, they refer to two related yet slightly different concepts.
 KDD is the overall process of extracting knowledge from data, while
Data Mining is a step inside the KDD process, which deals with
identifying patterns in data.
 And Data Mining is only the application of a specific algorithm based
on the overall goal of the KDD process.
 KDD is an iterative process where evaluation measures can be
enhanced, mining can be refined, and new data can be integrated and
transformed to get different and more appropriate results.
Data Mining Verification vs. Discovery
Verification model:
 It takes a hypothesis from the user and tests the validity of it
against the data. The user has to come across the facts about the data
using a number of techniques such as queries, multi-dimensional
analysis and visualization to the guide to the exploration of the data
being inspected.
Discovery model:
 Knowledge discovery is the concept of analyzing large amount of
data and gathering out relevant information leading to the
knowledge discovery process for extracting meaningful rules, patterns
and models from data.
Data Pre-processing:
 Data preprocessing is an important step in the data mining process. It
refers to the cleaning, transforming, and integrating of data in order to
make it ready for analysis. The goal of data preprocessing is to improve
the quality of the data and to make it more suitable for the specific data
mining task.
Some common steps in data preprocessing include:
 Data cleaning: this step involves identifying and removing missing,
inconsistent, or irrelevant data. This can include removing duplicate
records, filling in missing values, and handling outliers.
 Data integration: this step involves combining data from multiple
sources, such as databases, spreadsheets, and text files. The goal of
integration is to create a single, consistent view of the data.
 Data transformation: this step involves converting the data into a
format that is more suitable for the data mining task. This can include
normalizing numerical data, creating dummy variables, and encoding
categorical data.
 Data reduction: this step is used to select a subset of the data that is
relevant to the data mining task. This can include feature selection
(selecting a subset of the variables) or feature extraction (extracting
new variables from the data).
 Data discretization: this step is used to convert continuous numerical
data into categorical data, which can be used for decision tree and
other categorical data mining techniques.
Preprocessing in Data Mining:
Data preprocessing is a data mining technique which is used to transform
the raw data in a useful and efficient format.
Steps Involved in Data Preprocessing:
1. Data Cleaning:
The data can have many irrelevant and missing parts. To handle this part,
data cleaning is done. It involves handling of missing data, noisy data etc.
(a). Missing Data:
This situation arises when some data is missing in the data. It can be
handled in various ways.
Some of them are:
1. Ignore the tuples:
This approach is suitable only when the dataset we have is quite large
and multiple values are missing within a tuple.
2. Fill the Missing values:
There are various ways to do this task. You can choose to fill the
missing values manually, by attribute mean or the most probable
value.
(b). Noisy Data:
Noisy data is a meaningless data that can’t be interpreted by machines. It can
be generated due to faulty data collection, data entry errors etc. It can be
handled in following ways :
Binning Method:
This method works on sorted data in order to smooth it. The whole data is
divided into segments of equal size and then various methods are performed
to complete the task. Each segmented is handled separately. One can replace
all data in a segment by its mean or boundary values can be used to complete
the task.
 Regression:
Here data can be made smooth by fitting it to a regression function .The
regression used may be linear (having one independent variable) or
multiple (having multiple independent variables).
 Clustering:
This approach groups the similar data in a cluster. The outliers may be
undetected or it will fall outside the clusters.
2. Data Transformation:
This step is taken in order to transform the data in appropriate forms
suitable for mining process. This involves following ways:
 Normalization:
It is done in order to scale the data values in a specified range (-1.0 to 1.0 or
0.0 to 1.0)
 Attribute Selection:
In this strategy, new attributes are constructed from the given set of
attributes to help the mining process.
 Discretization:
This is done to replace the raw values of numeric attribute by interval
levels or conceptual levels.
 Concept Hierarchy Generation:
Here attributes are converted from lower level to higher level in hierarchy.
For Example-The attribute “city” can be converted to “country”.
3. Data Reduction:
Since data mining is a technique that is used to handle huge amount of
data. While working with huge volume of data, analysis became harder in
such cases. In order to get rid of this, we uses data reduction technique. It
aims to increase the storage efficiency and reduce data storage and
analysis costs.
The various steps to data reduction are:
 Data Cube Aggregation:
Aggregation operation is applied to data for the construction of the
data cube.
 Attribute Subset Selection:
The highly relevant attributes should be used, rest all can be discarded.
For performing attribute selection, one can use level of significance and
p- value of the attribute . the attribute having p-value greater than
significance level can be discarded.
 Numerosity Reduction:
This enable to store the model of data instead of whole data, for
example: Regression Models.
 Dimensionality Reduction:
This reduce the size of data by encoding mechanisms. It can be lossy or
lossless. If after reconstruction from compressed data, original data can
be retrieved, such reduction are called lossless reduction else it is called
lossy reduction. The two effective methods of dimensionality reduction
are:Wavelet transforms and PCA (Principal Component Analysis).
Accuracy Measures:
Precision, Recall
 Both precision and recall are crucial for information retrieval, where
positive class mattered the most as compared to negative. Why?
 While searching something on the web, the model does not care about
something irrelevant and not retrieved (this is the true negative
case). Therefore only TP, FP, FN are used in Precision and Recall.
Precision
 Out of all the positive predicted, what percentage is truly positive.
Precision=TP/TP+FP
 The precision value lies between 0 and 1.
Recall
 Out of the total positive, what percentage are predicted positive. It is
the same as TPR (true positive rate).
Recall=TP/TP+FN
F-Measure
F-Measure provides a way to combine both precision and recall into a
single measure that captures both properties.
F-measure provides a way to express both concerns with a single score.
Once precision and recall have been calculated for a binary or multiclass
classification problem, the two scores can be combined into the
calculation of the F-Measure.
The traditional F measure is calculated as follows:
F-Measure = (2 * Precision * Recall) / (Precision + Recall)
Confusion Matrix:
 The confusion matrix is a matrix used to determine the performance of
the classification models for a given set of test data. It can only be
determined if the true values for test data are known. The matrix itself
can be easily understood, but the related terminologies may be
confusing. Since it shows the errors in the model performance in the
form of a matrix, hence also known as an error matrix.
Some features of Confusion matrix are given below:
 For the 2 prediction classes of classifiers, the matrix is of 2*2 table, for 3
classes, it is 3*3 table, and so on.
 The matrix is divided into two dimensions, that are predicted
values and actual values along with the total number of predictions.
 Predicted values are those values, which are predicted by the model,
and actual values are the true values for the given observations.
 It looks like the below table:
The above table has the following cases:
True Negative: Model has given prediction No, and the real or actual value was
also No.
True Positive: The model has predicted yes, and the actual value was also true.
False Negative: The model has predicted no, but the actual value was Yes, it is
also called as Type-II error.
False Positive: The model has predicted Yes, but the actual value was No. It is also
called a Type-I error.
Cross-validation
Cross-validation is a technique for validating the model efficiency by
training it on the subset of input data and testing on previously unseen
subset of the input data. We can also say that it is a technique to
check how a statistical model generalizes to an independent
dataset.
 In machine learning, there is always the need to test the stability of the
model. It means based only on the training dataset; we can't fit our
model on the training dataset. For this purpose, we reserve a particular
sample of the dataset, which was not part of the training dataset. After
that, we test our model on that sample before deployment, and this
complete process comes under cross-validation. This is something
different from the general train-test split.
 Hence the basic steps of cross-validations are:
 Reserve a subset of the dataset as a validation set.
 Provide the training to the model using the training dataset.
 Now, evaluate model performance using the validation set. If the
model performs well with the validation set, perform the further step,
else check for the issues.
Methods used for Cross-Validation
There are some common methods that are used for cross-validation.
These methods are given below:
 Validation Set Approach
 Leave-P-out cross-validation
 Leave one out cross-validation
 K-fold cross-validation
 Stratified k-fold cross-validation
Data Mining Techniques

1. Association
 Association analysis is the finding of association rules showing
attribute-value conditions that occur frequently together in a given set
of data. Association analysis is widely used for a market basket or
transaction data analysis. Association rule mining is a significant and
exceptionally dynamic area of data mining research. One method of
association-based classification, called associative classification,
consists of two steps. In the main step, association instructions are
generated using a modified version of the standard association rule
mining algorithm known as Apriori. The second step constructs a
classifier based on the association rules discovered.
2. Classification
 Classification is the processing of finding a set of models (or functions)
that describe and distinguish data classes or concepts, for the purpose
of being able to use the model to predict the class of objects whose
class label is unknown. The determined model depends on the
investigation of a set of training data information (i.e. data objects
whose class label is known). The derived model may be represented in
various forms, such as classification (if – then) rules, decision trees,
and neural networks. Data Mining has a different type of classifier:
 Decision Tree
 SVM(Support Vector Machine)
 Generalized Linear Models
 Bayesian classification:
 Classification by Backpropagation
 K-NN Classifier
 Rule-Based Classification
 Frequent-Pattern Based Classification
 Rough set theory
 Fuzzy Logic
3. Prediction
 Data Prediction is a two-step process, similar to that of data
classification. Although, for prediction, we do not utilize the phrasing
of “Class label attribute” because the attribute for which values are
being predicted is consistently valued(ordered) instead of categorical
(discrete-esteemed and unordered). The attribute can be referred to
simply as the predicted attribute. Prediction can be viewed as the
construction and use of a model to assess the class of an unlabeled
object, or to assess the value or value ranges of an attribute that a given
object is likely to have.
4. Clustering
Unlike classification and prediction, which analyze class-labeled data
objects or attributes, clustering analyzes data objects without consulting
an identified class label. In general, the class labels do not exist in the
training data simply because they are not known to begin with. Clustering
can be used to generate these labels. The objects are clustered based on
the principle of maximizing the intra-class similarity and minimizing the
interclass similarity. That is, clusters of objects are created so that objects
inside a cluster have high similarity in contrast with each other, but are
different objects in other clusters. Each Cluster that is generated can be
seen as a class of objects, from which rules can be inferred. Clustering can
also facilitate classification formation, that is, the organization of
observations into a hierarchy of classes that group similar events together.
5. Regression
 Regression can be defined as a statistical modeling method in which
previously obtained data is used to predicting a continuous quantity for
new observations. This classifier is also known as the Continuous Value
Classifier. There are two types of regression models: Linear regression
and multiple linear regression models.
6. Artificial Neural network (ANN) Classifier Method
 An artificial neural network (ANN) also referred to as simply a “Neural
Network” (NN), could be a process model supported by biological
neural networks. It consists of an interconnected collection of artificial
neurons. A neural network is a set of connected input/output units
where each connection has a weight associated with it.
7. Outlier Detection
 A database may contain data objects that do not comply with the general
behavior or model of the data. These data objects are Outliers. The
investigation of OUTLIER data is known as OUTLIER MINING. An outlier may
be detected using statistical tests which assume a distribution or probability
model for the data, or using distance measures where objects having a small
fraction of “close” neighbors in space are considered outliers. Rather than
utilizing factual or distance measures, deviation-based techniques distinguish
exceptions/outlier by inspecting differences in the principle attributes of items
in a group.
8.Genetic algorithm
 Genetic algorithms are adaptive heuristic search algorithms that belong to the
larger part of evolutionary algorithms. Genetic algorithms are based on the
ideas of natural selection and genetics. These are intelligent exploitation of
random search provided with historical data to direct the search into the region
of better performance in solution space. They are commonly used to generate
high-quality solutions for optimization problems and search problems.
Frequent Item set in Data set (Association Rule Mining)
INTRODUCTION:
 Frequent item sets, also known as association rules, are a fundamental
concept in association rule mining, which is a technique used in data
mining to discover relationships between items in a dataset. The goal of
association rule mining is to identify relationships between items in a
dataset that occur frequently together.
 A frequent item set is a set of items that occur together frequently in a
dataset. The frequency of an item set is measured by the support
count, which is the number of transactions or records in the dataset
that contain the item set. For example, if a dataset contains 100
transactions and the item set {milk, bread} appears in 20 of those
transactions, the support count for {milk, bread} is 20.
 Association rule mining algorithms, such as Apriori or FP-Growth, are
used to find frequent item sets and generate association rules. These
algorithms work by iteratively generating candidate item sets and
pruning those that do not meet the minimum support threshold. Once
the frequent item sets are found, association rules can be generated by
using the concept of confidence, which is the ratio of the number of
transactions that contain the item set and the number of transactions
that contain the antecedent (left-hand side) of the rule.
 Frequent item sets and association rules can be used for a variety of
tasks such as market basket analysis, cross-selling and
recommendation systems. However, it should be noted that association
rule mining can generate a large number of rules, many of which may
be irrelevant or uninteresting. Therefore, it is important to use
appropriate measures such as lift and conviction to evaluate the
interestingness of the generated rules.
Apriori algorithm
 Apriori algorithm is given by R. Agrawal and R. Srikant in 1994 for
finding frequent itemsets in a dataset for boolean association rule.
Name of the algorithm is Apriori because it uses prior knowledge of
frequent itemset properties. We apply an iterative approach or level-
wise search where k-frequent itemsets are used to find k+1 itemsets.
 To improve the efficiency of level-wise generation of frequent itemsets,
an important property is used called Apriori property which helps by
reducing the search space.
Apriori Property –
All non-empty subset of frequent itemset must be frequent. The key
concept of Apriori algorithm is its anti-monotonicity of support
measure. Apriori assumes that Before we start understanding the
algorithm, go through some definitions which are explained in my
previous post.
FP-Tree
 The frequent-pattern tree (FP-tree) is a compact data structure that
stores quantitative information about frequent patterns in a database.
Each transaction is read and then mapped onto a path in the FP-tree.
This is done until all transactions have been read. Different
transactions with common subsets allow the tree to remain compact
because their paths overlap.
 A frequent Pattern Tree is made with the initial item sets of the
database. The purpose of the FP tree is to mine the most frequent
pattern. Each node of the FP tree represents an item of the item set.
 The root node represents null, while the lower nodes represent the
item sets. The associations of the nodes with the lower nodes, that is,
the item sets with the other item sets, are maintained while forming
the tree.
Graph Mining: Frequent sub-graph mining:
requent subgraph mining, which consists of discovering interesting
patterns in graphs. This task is important since data is naturally
represented as graph in many domains (e.g. social networks, chemical
molecules, map of roads in a country). It is thus desirable to analyze
graph data to discover interesting, unexpected, and useful patterns, that
can be used to understand the data or take decisions.
What is a graph?
A graph is a set of vertices and edges, having some labels.
 This graph contains four vertices (depicted as yellow circles). These
vertices have labels such as “10” and “11”. These labels provide
information about the vertices.
 Now, besides vertices, a graph also contains edges. The edges are the
lines between the vertices, here represented by thick black lines. Edges
also have some labels. In this example, four labels are used, which are
20, 21, 22 and 23. These labels represents different types of
relationships between vertices. Edge labels do not need to be unique.
Types of graphs: connected and disconnected
 Many different types of graphs can be found in real-life. Graphs are
either connected or disconnected. Let me explain this with an
example. Consider the two following graphs:
The graph on the left is said to be a connected graph because by following the
edges, it is possible to go from any vertex to any other vertices. A connected graph
in this context is a graph where it is possible to go from any city to any other
cities by following the roads. If a graph is not connected, it is said to be
a disconnected graph.
Types of graphs: directed and undirected
It is also useful to distinguish between directed and undirected graphs. In
an undirected graph, edges are bidirectional, while in a directed graph,
the edges can be unidirectional or bidirectional. Let’s illustrate this idea
with an example.
 The graph on the left is undirected, while the graph on the right is
directed. What are some real-life examples of a directed graph? For
example, consider a graph where vertices are locations and edges are
roads. Some roads can be travelled in both directions while some roads
may be travelled in only a single direction (“one-way” roads in a city).
 Some data mining algorithms are designed to work only with
undirected graphs, directed graphs, or support both.
Software for data mining
 R is a language and environment for statistical computing and
graphics. It is a GNU project which is similar to the S language and
environment which was developed at Bell Laboratories (formerly
AT&T, now Lucent Technologies) by John Chambers and colleagues.
 R can be considered as a different implementation of S. There are some
important differences, but much code written for S runs unaltered
under R.
 R provides a wide variety of statistical (linear and nonlinear modelling,
classical statistical tests, time-series analysis, classification, clustering,
…) and graphical techniques, and is highly extensible. The S language is
often the vehicle of choice for research in statistical methodology, and
R provides an Open Source route to participation in that activity.
 One of R’s strengths is the ease with which well-designed publication-
quality plots can be produced, including mathematical symbols and
formulae where needed. Great care has been taken over the defaults for
the minor design choices in graphics, but the user retains full control.
 R is available as Free Software under the terms of the Free Software
Foundation’s GNU General Public License in source code form. It
compiles and runs on a wide variety of UNIX platforms and similar
systems (including FreeBSD and Linux), Windows and MacOS.
 WEKA - an open source software provides tools for data preprocessing,
implementation of several Machine Learning algorithms, and
visualization tools so that you can develop machine learning
techniques and apply them to real-world data mining problems. What
WEKA offers is summarized in the following diagram −
Sample applications of data mining :
 Marketing. Data mining is used to explore increasingly large databases
and to improve market segmentation. By analysing the relationships
between parameters such as customer age, gender, tastes, etc., it is
possible to guess their behaviour in order to direct personalised loyalty
campaigns. Data mining in marketing also predicts which users are
likely to unsubscribe from a service, what interests them based on
their searches, or what a mailing list should include to achieve a higher
response rate.
 Retail. Supermarkets, for example, use joint purchasing patterns to
identify product associations and decide how to place them in
the aisles and on the shelves. Data mining also detects which offers
are most valued by customers or increase sales at the checkout
queue.
 Banking. Banks use data mining to better understand market risks. It
is commonly applied to credit ratings and to intelligent anti-fraud
systems to analyse transactions, card transactions, purchasing patterns
and customer financial data. Data mining also allows banks to learn
more about our online preferences or habits to optimise the return
on their marketing campaigns, study the performance of sales channels
or manage regulatory compliance obligations.
 Medicine. Data mining enables more accurate diagnostics. Having all
of the patient's information, such as medical records, physical
examinations, and treatment patterns, allows more effective
treatments to be prescribed. It also enables more effective, efficient
and cost-effective management of health resources by identifying
risks, predicting illnesses in certain segments of the population or
forecasting the length of hospital admission. Detecting fraud and
irregularities, and strengthening ties with patients with an enhanced
knowledge of their needs are also advantages of using data mining in
medicine.
 Television and radio. There are networks that apply real time data
mining to measure their online television (IPTV) and
radio audiences. These systems collect and analyse, on the
fly, anonymous information from channel views, broadcasts and
programming. Data mining allows networks to make personalised
recommendations to radio listeners and TV viewers, as well as get to
know their interests and activities in real time and better understand
their behaviour. Networks also gain valuable knowledge for their
advertisers, who use this data to target their potential customers more
accurately.
Introduction to Text Mining, Web Mining, Spatial Mining,
Temporal Mining:
1.Text Mining: Text mining and text analysis identifies textual
patterns and trends within unstructured data through the use of
machine learning, statistics, and linguistics. By transforming the data
into a more structured format through text mining and text analysis,
more quantitative insights can be found through text analytics.
2.Web Mining: Web Mining is the process of Data Mining techniques
to automatically discover and extract information from Web
documents and services. The main purpose of web mining is
discovering useful information from the World-Wide Web and its usage
patterns.
3.Spatial Mining: The goal of spatial data mining is to discover
potentially useful, interesting, and non-trivial patterns from
spatial data-sets (e.g., GPS trajectory of smartphones). Spatial data
mining is societally important having applications in public health,
public safety, climate science, etc.
4.Temporal Mining : Temporal data mining can be defined as “process
of knowledge discovery in temporal databases that enumerates
structures (temporal patterns or models) over the temporal data,
and any algorithm that enumerates temporal patterns from, or fits models
to, temporal data is a temporal data mining algorithm”
Thanks !!!

Unit-V-Introduction to Data Mining.pptx

  • 1.
  • 2.
    What is DataMining?  The process of extracting information to identify patterns, trends, and useful data that would allow the business to take the data-driven decision from huge sets of data is called Data Mining. Advantages of Data Mining:  The Data Mining technique enables organizations to obtain knowledge-based data.  Data mining enables organizations to make lucrative modifications in operation and production.  Compared with other statistical data applications, data mining is a cost-efficient.  Data Mining helps the decision-making process of an organization.  It Facilitates the automated discovery of hidden patterns as well as the prediction of trends and behaviours.
  • 3.
     It canbe induced in the new system as well as the existing platforms.  It is a quick process that makes it easy for new users to analyze enormous amounts of data in a short time. Disadvantages of Data Mining:  There is a probability that the organizations may sell useful data of customers to other organizations for money. As per the report, American Express has sold credit card purchases of their customers to other organizations.  Many data mining analytics software is difficult to operate and needs advance training to work on.  The data mining techniques are not precise, so that it may lead to severe consequences in certain conditions.  Different data mining instruments operate in distinct ways due to the different algorithms used in their design. Therefore, the selection of the right data mining tools is a very challenging task.
  • 4.
    Data mining Task: Datamining deals with the kind of patterns that can be mined. On the basis of the kind of data to be mined, there are two categories of functions involved in Data Mining −  Descriptive  Classification and Prediction 1. Descriptive Function The descriptive function deals with the general properties of data in the database. Here is the list of descriptive functions −  Class/Concept Description  Mining of Frequent Patterns  Mining of Associations  Mining of Correlations  Mining of Clusters
  • 5.
    Class/Concept Description Class/Concept refersto the data to be associated with the classes or concepts. For example, in a company, the classes of items for sales include computer and printers, and concepts of customers include big spenders and budget spenders. Such descriptions of a class or a concept are called class/concept descriptions. These descriptions can be derived by the following two ways −  Data Characterization − This refers to summarizing data of class under study. This class under study is called as Target Class.  Data Discrimination − It refers to the mapping or classification of a class with some predefined group or class.
  • 6.
    Mining of FrequentPatterns  Frequent patterns are those patterns that occur frequently in transactional data. Here is the list of kind of frequent patterns −  Frequent Item Set − It refers to a set of items that frequently appear together, for example, milk and bread.  Frequent Subsequence − A sequence of patterns that occur frequently such as purchasing a camera is followed by memory card.  Frequent Sub Structure − Substructure refers to different structural forms, such as graphs, trees, or lattices, which may be combined with item-sets or subsequences.
  • 7.
    Mining of Association Associations are used in retail sales to identify patterns that are frequently purchased together. This process refers to the process of uncovering the relationship among data and determining association rules.  For example, a retailer generates an association rule that shows that 70% of time milk is sold with bread and only 30% of times biscuits are sold with bread. Mining of Correlations  It is a kind of additional analysis performed to uncover interesting statistical correlations between associated-attribute-value pairs or between two item sets to analyze that if they have positive, negative or no effect on each other. Mining of Clusters  Cluster refers to a group of similar kind of objects. Cluster analysis refers to forming group of objects that are very similar to each other but are highly different from the objects in other clusters.
  • 8.
    2. Classification andPrediction  Classification is the process of finding a model that describes the data classes or concepts. The purpose is to be able to use this model to predict the class of objects whose class label is unknown. This derived model is based on the analysis of sets of training data. The derived model can be presented in the following forms −  Classification (IF-THEN) Rules  Decision Trees  Mathematical Formulae  Neural Networks
  • 9.
    The list offunctions involved in these processes are as follows −  Classification − It predicts the class of objects whose class label is unknown. Its objective is to find a derived model that describes and distinguishes data classes or concepts. The Derived Model is based on the analysis set of training data i.e. the data object whose class label is well known.  Prediction − It is used to predict missing or unavailable numerical data values rather than class labels. Regression Analysis is generally used for prediction. Prediction can also be used for identification of distribution trends based on available data.  Outlier Analysis − Outliers may be defined as the data objects that do not comply with the general behavior or model of the data available.  Evolution Analysis − Evolution analysis refers to the description and model regularities or trends for objects whose behavior changes over time.
  • 10.
    Data Mining Issues: Datamining is not an easy task, as the algorithms used can get very complex and data is not always available at one place. It needs to be integrated from various heterogeneous data sources. These factors also create some issues. Here in this tutorial, we will discuss the major issues regarding −  Mining Methodology and User Interaction  Performance Issues  Diverse Data Types Issues  The following diagram describes the major issues.
  • 12.
    Mining Methodology andUser Interaction Issues It refers to the following kinds of issues −  Mining different kinds of knowledge in databases − Different users may be interested in different kinds of knowledge. Therefore it is necessary for data mining to cover a broad range of knowledge discovery task.  Interactive mining of knowledge at multiple levels of abstraction − The data mining process needs to be interactive because it allows users to focus the search for patterns, providing and refining data mining requests based on the returned results.  Incorporation of background knowledge − To guide discovery process and to express the discovered patterns, the background knowledge can be used. Background knowledge may be used to express the discovered patterns not only in concise terms but at multiple levels of abstraction.  Data mining query languages and ad hoc data mining − Data Mining Query language that allows the user to describe ad hoc mining tasks, should be integrated with a data warehouse query language and optimized for efficient and flexible data mining.
  • 13.
     Presentation andvisualization of data mining results − Once the patterns are discovered it needs to be expressed in high level languages, and visual representations. These representations should be easily understandable.  Handling noisy or incomplete data − The data cleaning methods are required to handle the noise and incomplete objects while mining the data regularities. If the data cleaning methods are not there then the accuracy of the discovered patterns will be poor.  Pattern evaluation − The patterns discovered should be interesting because either they represent common knowledge or lack novelty.
  • 14.
    Performance Issues There canbe performance-related issues such as follows −  Efficiency and scalability of data mining algorithms − In order to effectively extract the information from huge amount of data in databases, data mining algorithm must be efficient and scalable.  Parallel, distributed, and incremental mining algorithms − The factors such as huge size of databases, wide distribution of data, and complexity of data mining methods motivate the development of parallel and distributed data mining algorithms. These algorithms divide the data into partitions which is further processed in a parallel fashion. Then the results from the partitions is merged. The incremental algorithms, update databases without mining the data again from scratch.
  • 15.
    Diverse Data TypesIssues  Handling of relational and complex types of data − The database may contain complex data objects, multimedia data objects, spatial data, temporal data etc. It is not possible for one system to mine all these kind of data.  Mining information from heterogeneous databases and global information systems − The data is available at different data sources on LAN or WAN. These data source may be structured, semi structured or unstructured. Therefore mining the knowledge from them adds challenges to data mining.
  • 16.
    What is KnowledgeDiscovery? Some people don’t differentiate data mining from knowledge discovery while others view data mining as an essential step in the process of knowledge discovery. Here is the list of steps involved in the knowledge discovery process −  Data Cleaning − In this step, the noise and inconsistent data is removed.  Data Integration − In this step, multiple data sources are combined.  Data Selection − In this step, data relevant to the analysis task are retrieved from the database.  Data Transformation − In this step, data is transformed or consolidated into forms appropriate for mining by performing summary or aggregation operations.  Data Mining − In this step, intelligent methods are applied in order to extract data patterns.  Pattern Evaluation − In this step, data patterns are evaluated.  Knowledge Presentation − In this step, knowledge is represented.  The following diagram shows the process of knowledge discovery −
  • 18.
    Difference between KDDand Data Mining  Although the two terms KDD and Data Mining are heavily used interchangeably, they refer to two related yet slightly different concepts.  KDD is the overall process of extracting knowledge from data, while Data Mining is a step inside the KDD process, which deals with identifying patterns in data.  And Data Mining is only the application of a specific algorithm based on the overall goal of the KDD process.  KDD is an iterative process where evaluation measures can be enhanced, mining can be refined, and new data can be integrated and transformed to get different and more appropriate results.
  • 19.
    Data Mining Verificationvs. Discovery Verification model:  It takes a hypothesis from the user and tests the validity of it against the data. The user has to come across the facts about the data using a number of techniques such as queries, multi-dimensional analysis and visualization to the guide to the exploration of the data being inspected. Discovery model:  Knowledge discovery is the concept of analyzing large amount of data and gathering out relevant information leading to the knowledge discovery process for extracting meaningful rules, patterns and models from data.
  • 20.
    Data Pre-processing:  Datapreprocessing is an important step in the data mining process. It refers to the cleaning, transforming, and integrating of data in order to make it ready for analysis. The goal of data preprocessing is to improve the quality of the data and to make it more suitable for the specific data mining task. Some common steps in data preprocessing include:  Data cleaning: this step involves identifying and removing missing, inconsistent, or irrelevant data. This can include removing duplicate records, filling in missing values, and handling outliers.
  • 21.
     Data integration:this step involves combining data from multiple sources, such as databases, spreadsheets, and text files. The goal of integration is to create a single, consistent view of the data.  Data transformation: this step involves converting the data into a format that is more suitable for the data mining task. This can include normalizing numerical data, creating dummy variables, and encoding categorical data.  Data reduction: this step is used to select a subset of the data that is relevant to the data mining task. This can include feature selection (selecting a subset of the variables) or feature extraction (extracting new variables from the data).  Data discretization: this step is used to convert continuous numerical data into categorical data, which can be used for decision tree and other categorical data mining techniques.
  • 22.
    Preprocessing in DataMining: Data preprocessing is a data mining technique which is used to transform the raw data in a useful and efficient format.
  • 23.
    Steps Involved inData Preprocessing: 1. Data Cleaning: The data can have many irrelevant and missing parts. To handle this part, data cleaning is done. It involves handling of missing data, noisy data etc. (a). Missing Data: This situation arises when some data is missing in the data. It can be handled in various ways. Some of them are: 1. Ignore the tuples: This approach is suitable only when the dataset we have is quite large and multiple values are missing within a tuple. 2. Fill the Missing values: There are various ways to do this task. You can choose to fill the missing values manually, by attribute mean or the most probable value.
  • 24.
    (b). Noisy Data: Noisydata is a meaningless data that can’t be interpreted by machines. It can be generated due to faulty data collection, data entry errors etc. It can be handled in following ways : Binning Method: This method works on sorted data in order to smooth it. The whole data is divided into segments of equal size and then various methods are performed to complete the task. Each segmented is handled separately. One can replace all data in a segment by its mean or boundary values can be used to complete the task.  Regression: Here data can be made smooth by fitting it to a regression function .The regression used may be linear (having one independent variable) or multiple (having multiple independent variables).  Clustering: This approach groups the similar data in a cluster. The outliers may be undetected or it will fall outside the clusters.
  • 25.
    2. Data Transformation: Thisstep is taken in order to transform the data in appropriate forms suitable for mining process. This involves following ways:  Normalization: It is done in order to scale the data values in a specified range (-1.0 to 1.0 or 0.0 to 1.0)  Attribute Selection: In this strategy, new attributes are constructed from the given set of attributes to help the mining process.  Discretization: This is done to replace the raw values of numeric attribute by interval levels or conceptual levels.  Concept Hierarchy Generation: Here attributes are converted from lower level to higher level in hierarchy. For Example-The attribute “city” can be converted to “country”.
  • 26.
    3. Data Reduction: Sincedata mining is a technique that is used to handle huge amount of data. While working with huge volume of data, analysis became harder in such cases. In order to get rid of this, we uses data reduction technique. It aims to increase the storage efficiency and reduce data storage and analysis costs. The various steps to data reduction are:  Data Cube Aggregation: Aggregation operation is applied to data for the construction of the data cube.  Attribute Subset Selection: The highly relevant attributes should be used, rest all can be discarded. For performing attribute selection, one can use level of significance and p- value of the attribute . the attribute having p-value greater than significance level can be discarded.
  • 27.
     Numerosity Reduction: Thisenable to store the model of data instead of whole data, for example: Regression Models.  Dimensionality Reduction: This reduce the size of data by encoding mechanisms. It can be lossy or lossless. If after reconstruction from compressed data, original data can be retrieved, such reduction are called lossless reduction else it is called lossy reduction. The two effective methods of dimensionality reduction are:Wavelet transforms and PCA (Principal Component Analysis).
  • 28.
    Accuracy Measures: Precision, Recall Both precision and recall are crucial for information retrieval, where positive class mattered the most as compared to negative. Why?  While searching something on the web, the model does not care about something irrelevant and not retrieved (this is the true negative case). Therefore only TP, FP, FN are used in Precision and Recall. Precision  Out of all the positive predicted, what percentage is truly positive. Precision=TP/TP+FP  The precision value lies between 0 and 1. Recall  Out of the total positive, what percentage are predicted positive. It is the same as TPR (true positive rate). Recall=TP/TP+FN
  • 29.
    F-Measure F-Measure provides away to combine both precision and recall into a single measure that captures both properties. F-measure provides a way to express both concerns with a single score. Once precision and recall have been calculated for a binary or multiclass classification problem, the two scores can be combined into the calculation of the F-Measure. The traditional F measure is calculated as follows: F-Measure = (2 * Precision * Recall) / (Precision + Recall)
  • 30.
    Confusion Matrix:  Theconfusion matrix is a matrix used to determine the performance of the classification models for a given set of test data. It can only be determined if the true values for test data are known. The matrix itself can be easily understood, but the related terminologies may be confusing. Since it shows the errors in the model performance in the form of a matrix, hence also known as an error matrix. Some features of Confusion matrix are given below:  For the 2 prediction classes of classifiers, the matrix is of 2*2 table, for 3 classes, it is 3*3 table, and so on.  The matrix is divided into two dimensions, that are predicted values and actual values along with the total number of predictions.  Predicted values are those values, which are predicted by the model, and actual values are the true values for the given observations.  It looks like the below table:
  • 31.
    The above tablehas the following cases: True Negative: Model has given prediction No, and the real or actual value was also No. True Positive: The model has predicted yes, and the actual value was also true. False Negative: The model has predicted no, but the actual value was Yes, it is also called as Type-II error. False Positive: The model has predicted Yes, but the actual value was No. It is also called a Type-I error.
  • 32.
    Cross-validation Cross-validation is atechnique for validating the model efficiency by training it on the subset of input data and testing on previously unseen subset of the input data. We can also say that it is a technique to check how a statistical model generalizes to an independent dataset.  In machine learning, there is always the need to test the stability of the model. It means based only on the training dataset; we can't fit our model on the training dataset. For this purpose, we reserve a particular sample of the dataset, which was not part of the training dataset. After that, we test our model on that sample before deployment, and this complete process comes under cross-validation. This is something different from the general train-test split.  Hence the basic steps of cross-validations are:  Reserve a subset of the dataset as a validation set.  Provide the training to the model using the training dataset.  Now, evaluate model performance using the validation set. If the model performs well with the validation set, perform the further step, else check for the issues.
  • 33.
    Methods used forCross-Validation There are some common methods that are used for cross-validation. These methods are given below:  Validation Set Approach  Leave-P-out cross-validation  Leave one out cross-validation  K-fold cross-validation  Stratified k-fold cross-validation
  • 34.
  • 35.
    1. Association  Associationanalysis is the finding of association rules showing attribute-value conditions that occur frequently together in a given set of data. Association analysis is widely used for a market basket or transaction data analysis. Association rule mining is a significant and exceptionally dynamic area of data mining research. One method of association-based classification, called associative classification, consists of two steps. In the main step, association instructions are generated using a modified version of the standard association rule mining algorithm known as Apriori. The second step constructs a classifier based on the association rules discovered. 2. Classification  Classification is the processing of finding a set of models (or functions) that describe and distinguish data classes or concepts, for the purpose of being able to use the model to predict the class of objects whose class label is unknown. The determined model depends on the investigation of a set of training data information (i.e. data objects whose class label is known). The derived model may be represented in various forms, such as classification (if – then) rules, decision trees, and neural networks. Data Mining has a different type of classifier:
  • 36.
     Decision Tree SVM(Support Vector Machine)  Generalized Linear Models  Bayesian classification:  Classification by Backpropagation  K-NN Classifier  Rule-Based Classification  Frequent-Pattern Based Classification  Rough set theory  Fuzzy Logic
  • 37.
    3. Prediction  DataPrediction is a two-step process, similar to that of data classification. Although, for prediction, we do not utilize the phrasing of “Class label attribute” because the attribute for which values are being predicted is consistently valued(ordered) instead of categorical (discrete-esteemed and unordered). The attribute can be referred to simply as the predicted attribute. Prediction can be viewed as the construction and use of a model to assess the class of an unlabeled object, or to assess the value or value ranges of an attribute that a given object is likely to have.
  • 38.
    4. Clustering Unlike classificationand prediction, which analyze class-labeled data objects or attributes, clustering analyzes data objects without consulting an identified class label. In general, the class labels do not exist in the training data simply because they are not known to begin with. Clustering can be used to generate these labels. The objects are clustered based on the principle of maximizing the intra-class similarity and minimizing the interclass similarity. That is, clusters of objects are created so that objects inside a cluster have high similarity in contrast with each other, but are different objects in other clusters. Each Cluster that is generated can be seen as a class of objects, from which rules can be inferred. Clustering can also facilitate classification formation, that is, the organization of observations into a hierarchy of classes that group similar events together.
  • 39.
    5. Regression  Regressioncan be defined as a statistical modeling method in which previously obtained data is used to predicting a continuous quantity for new observations. This classifier is also known as the Continuous Value Classifier. There are two types of regression models: Linear regression and multiple linear regression models. 6. Artificial Neural network (ANN) Classifier Method  An artificial neural network (ANN) also referred to as simply a “Neural Network” (NN), could be a process model supported by biological neural networks. It consists of an interconnected collection of artificial neurons. A neural network is a set of connected input/output units where each connection has a weight associated with it.
  • 40.
    7. Outlier Detection A database may contain data objects that do not comply with the general behavior or model of the data. These data objects are Outliers. The investigation of OUTLIER data is known as OUTLIER MINING. An outlier may be detected using statistical tests which assume a distribution or probability model for the data, or using distance measures where objects having a small fraction of “close” neighbors in space are considered outliers. Rather than utilizing factual or distance measures, deviation-based techniques distinguish exceptions/outlier by inspecting differences in the principle attributes of items in a group. 8.Genetic algorithm  Genetic algorithms are adaptive heuristic search algorithms that belong to the larger part of evolutionary algorithms. Genetic algorithms are based on the ideas of natural selection and genetics. These are intelligent exploitation of random search provided with historical data to direct the search into the region of better performance in solution space. They are commonly used to generate high-quality solutions for optimization problems and search problems.
  • 41.
    Frequent Item setin Data set (Association Rule Mining) INTRODUCTION:  Frequent item sets, also known as association rules, are a fundamental concept in association rule mining, which is a technique used in data mining to discover relationships between items in a dataset. The goal of association rule mining is to identify relationships between items in a dataset that occur frequently together.  A frequent item set is a set of items that occur together frequently in a dataset. The frequency of an item set is measured by the support count, which is the number of transactions or records in the dataset that contain the item set. For example, if a dataset contains 100 transactions and the item set {milk, bread} appears in 20 of those transactions, the support count for {milk, bread} is 20.
  • 42.
     Association rulemining algorithms, such as Apriori or FP-Growth, are used to find frequent item sets and generate association rules. These algorithms work by iteratively generating candidate item sets and pruning those that do not meet the minimum support threshold. Once the frequent item sets are found, association rules can be generated by using the concept of confidence, which is the ratio of the number of transactions that contain the item set and the number of transactions that contain the antecedent (left-hand side) of the rule.  Frequent item sets and association rules can be used for a variety of tasks such as market basket analysis, cross-selling and recommendation systems. However, it should be noted that association rule mining can generate a large number of rules, many of which may be irrelevant or uninteresting. Therefore, it is important to use appropriate measures such as lift and conviction to evaluate the interestingness of the generated rules.
  • 43.
    Apriori algorithm  Apriorialgorithm is given by R. Agrawal and R. Srikant in 1994 for finding frequent itemsets in a dataset for boolean association rule. Name of the algorithm is Apriori because it uses prior knowledge of frequent itemset properties. We apply an iterative approach or level- wise search where k-frequent itemsets are used to find k+1 itemsets.  To improve the efficiency of level-wise generation of frequent itemsets, an important property is used called Apriori property which helps by reducing the search space. Apriori Property – All non-empty subset of frequent itemset must be frequent. The key concept of Apriori algorithm is its anti-monotonicity of support measure. Apriori assumes that Before we start understanding the algorithm, go through some definitions which are explained in my previous post.
  • 44.
    FP-Tree  The frequent-patterntree (FP-tree) is a compact data structure that stores quantitative information about frequent patterns in a database. Each transaction is read and then mapped onto a path in the FP-tree. This is done until all transactions have been read. Different transactions with common subsets allow the tree to remain compact because their paths overlap.  A frequent Pattern Tree is made with the initial item sets of the database. The purpose of the FP tree is to mine the most frequent pattern. Each node of the FP tree represents an item of the item set.  The root node represents null, while the lower nodes represent the item sets. The associations of the nodes with the lower nodes, that is, the item sets with the other item sets, are maintained while forming the tree.
  • 45.
    Graph Mining: Frequentsub-graph mining: requent subgraph mining, which consists of discovering interesting patterns in graphs. This task is important since data is naturally represented as graph in many domains (e.g. social networks, chemical molecules, map of roads in a country). It is thus desirable to analyze graph data to discover interesting, unexpected, and useful patterns, that can be used to understand the data or take decisions. What is a graph? A graph is a set of vertices and edges, having some labels.
  • 46.
     This graphcontains four vertices (depicted as yellow circles). These vertices have labels such as “10” and “11”. These labels provide information about the vertices.  Now, besides vertices, a graph also contains edges. The edges are the lines between the vertices, here represented by thick black lines. Edges also have some labels. In this example, four labels are used, which are 20, 21, 22 and 23. These labels represents different types of relationships between vertices. Edge labels do not need to be unique. Types of graphs: connected and disconnected  Many different types of graphs can be found in real-life. Graphs are either connected or disconnected. Let me explain this with an example. Consider the two following graphs:
  • 47.
    The graph onthe left is said to be a connected graph because by following the edges, it is possible to go from any vertex to any other vertices. A connected graph in this context is a graph where it is possible to go from any city to any other cities by following the roads. If a graph is not connected, it is said to be a disconnected graph.
  • 48.
    Types of graphs:directed and undirected It is also useful to distinguish between directed and undirected graphs. In an undirected graph, edges are bidirectional, while in a directed graph, the edges can be unidirectional or bidirectional. Let’s illustrate this idea with an example.
  • 49.
     The graphon the left is undirected, while the graph on the right is directed. What are some real-life examples of a directed graph? For example, consider a graph where vertices are locations and edges are roads. Some roads can be travelled in both directions while some roads may be travelled in only a single direction (“one-way” roads in a city).  Some data mining algorithms are designed to work only with undirected graphs, directed graphs, or support both. Software for data mining  R is a language and environment for statistical computing and graphics. It is a GNU project which is similar to the S language and environment which was developed at Bell Laboratories (formerly AT&T, now Lucent Technologies) by John Chambers and colleagues.  R can be considered as a different implementation of S. There are some important differences, but much code written for S runs unaltered under R.
  • 50.
     R providesa wide variety of statistical (linear and nonlinear modelling, classical statistical tests, time-series analysis, classification, clustering, …) and graphical techniques, and is highly extensible. The S language is often the vehicle of choice for research in statistical methodology, and R provides an Open Source route to participation in that activity.  One of R’s strengths is the ease with which well-designed publication- quality plots can be produced, including mathematical symbols and formulae where needed. Great care has been taken over the defaults for the minor design choices in graphics, but the user retains full control.  R is available as Free Software under the terms of the Free Software Foundation’s GNU General Public License in source code form. It compiles and runs on a wide variety of UNIX platforms and similar systems (including FreeBSD and Linux), Windows and MacOS.
  • 51.
     WEKA -an open source software provides tools for data preprocessing, implementation of several Machine Learning algorithms, and visualization tools so that you can develop machine learning techniques and apply them to real-world data mining problems. What WEKA offers is summarized in the following diagram −
  • 52.
    Sample applications ofdata mining :  Marketing. Data mining is used to explore increasingly large databases and to improve market segmentation. By analysing the relationships between parameters such as customer age, gender, tastes, etc., it is possible to guess their behaviour in order to direct personalised loyalty campaigns. Data mining in marketing also predicts which users are likely to unsubscribe from a service, what interests them based on their searches, or what a mailing list should include to achieve a higher response rate.  Retail. Supermarkets, for example, use joint purchasing patterns to identify product associations and decide how to place them in the aisles and on the shelves. Data mining also detects which offers are most valued by customers or increase sales at the checkout queue.  Banking. Banks use data mining to better understand market risks. It is commonly applied to credit ratings and to intelligent anti-fraud systems to analyse transactions, card transactions, purchasing patterns and customer financial data. Data mining also allows banks to learn more about our online preferences or habits to optimise the return on their marketing campaigns, study the performance of sales channels or manage regulatory compliance obligations.
  • 53.
     Medicine. Datamining enables more accurate diagnostics. Having all of the patient's information, such as medical records, physical examinations, and treatment patterns, allows more effective treatments to be prescribed. It also enables more effective, efficient and cost-effective management of health resources by identifying risks, predicting illnesses in certain segments of the population or forecasting the length of hospital admission. Detecting fraud and irregularities, and strengthening ties with patients with an enhanced knowledge of their needs are also advantages of using data mining in medicine.  Television and radio. There are networks that apply real time data mining to measure their online television (IPTV) and radio audiences. These systems collect and analyse, on the fly, anonymous information from channel views, broadcasts and programming. Data mining allows networks to make personalised recommendations to radio listeners and TV viewers, as well as get to know their interests and activities in real time and better understand their behaviour. Networks also gain valuable knowledge for their advertisers, who use this data to target their potential customers more accurately.
  • 54.
    Introduction to TextMining, Web Mining, Spatial Mining, Temporal Mining: 1.Text Mining: Text mining and text analysis identifies textual patterns and trends within unstructured data through the use of machine learning, statistics, and linguistics. By transforming the data into a more structured format through text mining and text analysis, more quantitative insights can be found through text analytics. 2.Web Mining: Web Mining is the process of Data Mining techniques to automatically discover and extract information from Web documents and services. The main purpose of web mining is discovering useful information from the World-Wide Web and its usage patterns.
  • 55.
    3.Spatial Mining: Thegoal of spatial data mining is to discover potentially useful, interesting, and non-trivial patterns from spatial data-sets (e.g., GPS trajectory of smartphones). Spatial data mining is societally important having applications in public health, public safety, climate science, etc. 4.Temporal Mining : Temporal data mining can be defined as “process of knowledge discovery in temporal databases that enumerates structures (temporal patterns or models) over the temporal data, and any algorithm that enumerates temporal patterns from, or fits models to, temporal data is a temporal data mining algorithm”
  • 56.