What is aData Warehouse?
A Data Warehouse is a collection of data gathered
and organized so that it can easily by analyzed,
extracted, synthesized, and otherwise be used for
the purposes of further understanding the data.
A Data warehouse is a subject-oriented, integrated,
time- variant and non-volatile collection of data in
support of management's decision making process
3.
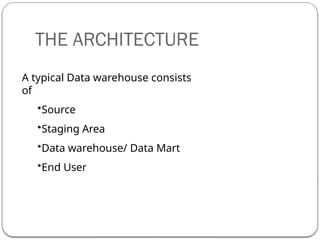
THE ARCHITECTURE
A typicalData warehouse consists
of
•Source
•Staging Area
•Data warehouse/ Data Mart
•End User
General Stages ofData Warehouse
5
Off line Operational Database
o Data warehouses are developed by copying the data off an
operational system to another server where the processing
load of reporting against the copied data does not impact the
operational system's performance.
Off line DataWarehouse
o Data warehouses are updated from data in the operational
systems on a regular basis and the data warehouse data is
stored in a data structure designed to facilitate reporting.
6.
Real TimeData Warehouse
o Data warehouses at this stage are updated every
time
an operational system performs a transaction
Integrated Data Warehouse
o Data warehouses at this stage are updated every
time an operational system performs a transaction.
The data warehouses then generate transactions
that are passed back into the operational systems.
General Stages of Data Warehouse
6
7.
Types of DataWarehouse
7
Enterprise Data Warehouse
o provide a control Data Base for decision support
through out the enterprise.
Operational data store
o has a broad enterprise under scope but unlike a
real enterprise DW. Data is refreshed in rare real
time and used for routine business activity.
Data Mart
o is a sub part of Data Warehouse. It support a
particular reason or it is design for particular lines
of business.
8.
Data Mart
8
Adata mart is a smaller version of a
data warehouse
• Usually containing data related to a single unit
of an organization
Usually data mart focuses on the
requirements of only one department or
business function of a company
Data mart can be a useful first step to a
full- scale data warehouse
9.
Why creating DataMart?
9
To provide data for users in a single department
To improve end-user response time due to the reduction
in the volume of data
Building a data mart is simpler compared with
establishing a corporate data warehouse
The cost of implementing data marts is normally less
than implementing a data warehouse
Users of a data mart are more clearly defined and can be
more easily targeted
Benefits of datawarehousing
11
A data warehouse provides a common data model
for all data of interest regardless of the data's source
Prior to loading data into the data
warehouse, inconsistencies are identified
and resolved.
Information in the data warehouse is under the
control of data warehouse users so that, even if the
source system data is purged over time, the
information in the warehouse can be stored safely
for extended periods of time.
12.
Benefits of datawarehousing
12
Data warehouses can work in conjunction with and, hence,
enhance the value of operational business applications, notably
customer relationship management (CRM) systems.
Data warehouses facilitate decision support system
applications such as trend reports, exception reports, and
reports that show actual performance versus goals.
Data warehouses provide retrieval of data without
slowing down operational systems.
13.
Disadvantages of data
warehouses
13
The data warehouse is usually not static.
Maintenance costs are high.
Data warehouses can get outdated relatively
quickly.
There is often a fine line between data warehouses
and operational systems. Duplicate, expensive
functionality may be developed. Or, functionality may
be developed in the data warehouse that, in
retrospect, should have been developed in the
operational systems and vice versa..
14.
Business intelligence
14
Businessintelligence (BI) refers to skills,
technologies, applications and practices used to help
a business acquire a better understanding of its
commercial context. Business intelligence may also
refer to the collected information itself.
BI applications provide historical, current, and
predictive views of business operations. Common
functions of business intelligence applications are
reporting, OLAP, analytics, data mining, business
performance management, benchmarks, text
mining, and predictive analytics.
15.
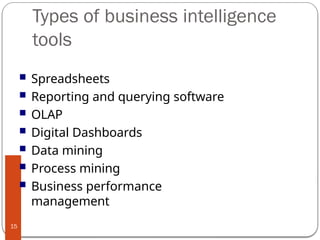
Types of businessintelligence
tools
15
Spreadsheets
Reporting and querying software
OLAP
Digital Dashboards
Data mining
Process mining
Business performance
management
16.
Data mining
16
Datamining is the process of extracting hidden
patterns from large amounts of data. It is commonly
used in a wide range of profiling practices, such as
marketing, surveillance, fraud detection and scientific
discovery.
As more data is gathered, with the amount of data
doubling every three years, data mining is becoming
an increasingly important tool to transform this data
into information. It is commonly used in a wide range
of profiling practices, such as marketing, surveillance,
fraud detection and scientific discovery.
Data mining can be applied to data sets of any size.
17.
Data integration
17
Dataintegration is the process of combining data
residing at different sources and providing the user
with a unified view of these data .
Data integration appears with increasing
frequency as the volume and the need to share
existing data explodes.
It has been the focus of extensive theoretical work
and numerous open problems remain to be solved.
In management practice, data integration is
frequently called Enterprise Information
Integration.
18.
OLAP & OLTP
OLAPOLTP database
Designed for analysis of
business measures by category
and attributes.
Designed for real time business
operations.
Optimized for bulk loads and
large, complex, unpredictable
queries that access many rows
per table.
Optimized for a common set of
transactions, usually adding or
retrieving a single row at a time
per table.
Loaded with consistent, valid
data; requires no real time
validation.
Optimized for validation of
incoming data during
transactions; uses validation
data tables.
Supports few concurrent
users relative to OLTP.
Supports thousands of
concurrent users.
19.
Analysis Services
A middle-tierserver for OLAP and data
mining; manages multi-dimensional
cubes of data for analysis and provides
rapid client access; allows you to create
data mining models from both OLAP and
relational data sources
Star Schema
Thestar schema is perhaps the
simplest data warehouse schema. It is
called a star schema because the entity-
relationship diagram of this schema
resembles a star, with points radiating
from a central table. The center of the
star consists of a large fact table and
the points of the star are the dimension
tables
22.
Example: Star Schema
22
PropertySale
TimeID(FK)
PropertyID (FK)
BranchID (FK)
BuyerID (FK)
PromotionID
(FK) StaffID (FK)
OwnerID (FK)
OfferPrice
SellingPrice
SaleCommission
SaleRevenue
Property
PropertyID (PK)
Type
Street
City
Province
Country
Postcode
Buyer
BuyerID (PK)
Name
Type
City
Province
Country
Staff
StaffID (PK)
Name
Position
Gender
City
Province
Country
Owner
OwnerID (PK)
Name
Type
City
Province
Country
BranchID (PK)
Type
City
Province
Country
Branch
PromotionID
(PK) Name
Type
Promotion
TimeID (PK)
Day
Week
Month
Year
Time
Fact Table
Dimension
Tables
Dimension
Tables
23.
Snowflake Schema
23
Snowflakeschema is a variant of the star schema
where dimension tables contain normalized data
o e.g. ‘city’ and ‘province’ can be splitted
as separated
tables to normalize dimension tables
o ‘Starflake’ schema is a hybrid structure that
contains a mixture of star (denormalized)
and snowflake (normalized) schemas
This allows dimension tables to be present in both
forms for
different query requirements
24.
Example: Snowflake Schema
24
PropertySale
TimeID(FK)
PropertyID (FK)
BranchID (FK)
BuyerID (FK)
PromotionID
(FK) StaffID (FK)
OwnerID (FK)
OfferPrice
SellingPrice
SaleCommission
SaleRevenue
BranchID (PK)
Type
CityID (FK)
Branch
Dimension Tables Fact Table
Province (PK)
Country
Province
CityID (PK)
CityName
Province (FK)
City
25.
In astar schema every dimension will have a primary
key.
In a star schema, a dimension table will not have any
parent table.
Whereas in a snow flake schema, a dimension
table will have one or more parent tables.
Hierarchies for the dimensions are stored in the
dimensional table itself in star schema.
Whereas hierarchies are broken into separate tables
in snow flake schema. These hierarchies helps to
drill down the data from topmost hierarchies to
Important aspects of Star
Schema & Snow Flake Schema
26.
Dimension Modeling
Dimensionalmodeling is a technique for
conceptualizing and visualizing data models as a set
of measures that are described by common aspects
of the business.
It is especially useful for summarizing and
rearranging the data and presenting views of the
data to support data analysis.
Dimensional modeling focuses on numeric data,
such as values, counts, weights, balances, and
occurrences.
27.
27
Multidimensional Data Model
(MDM)
Focused on a collection of numeric
measures.
Each measure depends on a set of
dimensions
Data are presented as multidimensional
array
28.
Unified Dimensional Model
(UDM)
The role of a Unified Dimensional Model (UDM) is to
provide a bridge between the user and the data
sources.
A UDM is constructed over one or more physical
data sources, and then the end user issues
queries against the UDM using one of a variety
of client tools.
Advantages of creating UDM
More readily understood model of the data
Isolation from heterogeneous backend data sources
Improved performance for summary type queries.
28
Fact Table
Containnumeric measures of the business
Contains facts and connected to dimensions
two types of
columns facts
or measures
foreign keys to
dimension
tables
May contain date-
stamped data
A fact table might
31.
Steps in designingFact Table
Identify a business process for analysis(like sales).
Identify measures or facts (sales dollar).
Identify dimensions for facts(product dimension, location
dimension, time dimension, organization dimension).
List the columns that describe each dimension.(region
name, branch name, region name).
Determine the lowest level of summary in a fact
table(sales dollar).
32.
Types of Facts(Measures)
Additive - Measures that can be added across all
dimensions.
Semi Additive - Measures that can be added across
few dimensions and not with others.
Non Additive - Measures that cannot be added
across all dimensions.
33.
Dimension Tables
Adimension is a structure, often composed of one
or more hierarchies, that categorizes data.
Dimensional attributes help to describe the
dimensional value. They are normally descriptive,
textual values. Several distinct dimensions,
combined with facts, enable you to answer business
questions. Commonly used dimensions are
customers, products, and time.
34.
Dimension Tables
Containtextual information that represents
attributes of the business
Contain relatively static data
Are joined to fact table through a foreign
key reference
Are usually smaller than fact tables
MEASURES
A measureis a numeric attribute of a fact,
representing the performance or behavior of the
business relative to the dimensions. The actual
numbers are called as variables.
A measure is determined by combinations of the
members of the dimensions and is located on facts.
Examples of Measures:
o Quantity Sold
o Unit Price
o Amount Sold
o Profit
37.
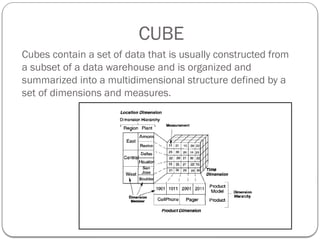
CUBE
Cubes contain aset of data that is usually constructed from
a subset of a data warehouse and is organized and
summarized into a multidimensional structure defined by a
set of dimensions and measures.
38.
Advantages of SSASCubes
SSAS is fast even on a large volume of data
SSAS calculated measures are fast execution-wise
and easy
reusable
They are defined centrally in the SSAS database, and
the
reports pick and choose the calculated measures
they want.
39.
39
ROLAP: Relational OLAP
Special schema design: star, snowflake
Special indexes: bitmap, multi-table join
Special tuning: maximize query
throughput
Proven technology (relational model,
DBMS), tend to outperform specialized
MDDB especially on large data sets
Products
o IBM DB2, Oracle, Sybase IQ, RedBrick, Informix
40.
Advantages:
o It canhandle large amounts of data, ROLAP itself
places
no limitation on data amount
Disadvantages:
o Performance can be slow. Because each ROLAP
report is essentially a SQL query (or multiple
SQL queries) in the relational database, the
query time can be long if the underlying data
size is large .
o It is difficult to perform complex calculations .
ROLAP: Relational OLAP
41.
CS 336
41
MOLAP: MultiDimensional OLAP
MDDB: a special-purpose data model
Facts stored in multi-dimensional
arrays
Dimensions used to index array
Sometimes on top of relational DB
Products
o Pilot, Arbor Essbase, Gentia
42.
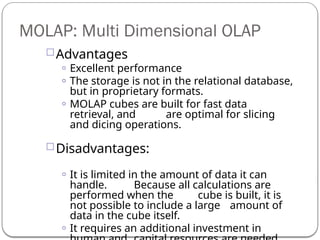
Advantages
o Excellent performance
oThe storage is not in the relational database,
but in proprietary formats.
o MOLAP cubes are built for fast data
retrieval, and are optimal for slicing
and dicing operations.
Disadvantages:
o It is limited in the amount of data it can
handle. Because all calculations are
performed when the cube is built, it is
not possible to include a large amount of
data in the cube itself.
o It requires an additional investment in
MOLAP: Multi Dimensional OLAP
43.
Hybrid OLAP(HOLAP) refers to technologies
that combine MOLAP and ROLAP.
Advantages
o For summary-type information,
HOLAP leverages cube
technology for faster performance.
o When detail information is needed,
HOLAP can "drill through" from the
cube into the underlying relational
data.
HOLAP: Hybrid OLAP