Downloaded 39 times

![18
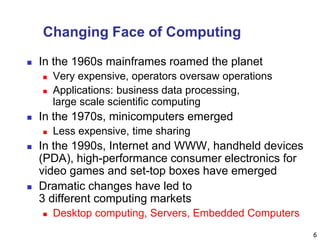
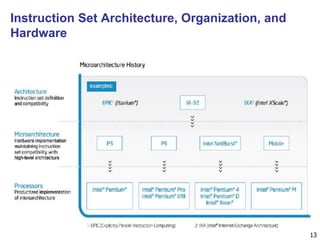
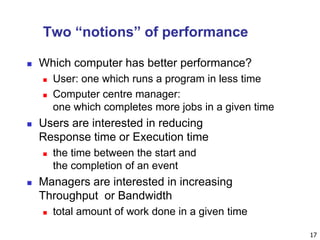
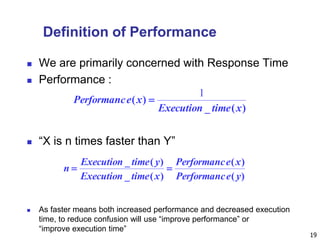
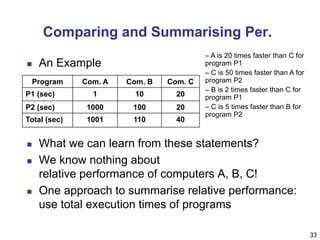
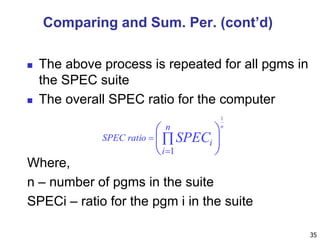
An Example
Which has higher performance?
Time to deliver 1 passenger?
B is 6.5/3 = 2.2 times faster
No. of passengers delivered per hour?
A is 72/44 = 1.6 times faster
Plane DC to Paris
[hour]
Top Speed
[mph]
Passe
-ngers
Throughput
[p/h]
A 6.5 610 470 72
(=470/6.5)
B 3 1350 132 44 (=132/3)](https://image.slidesharecdn.com/unit-i-introduction-161122133729/85/Unit-i-introduction-18-320.jpg)
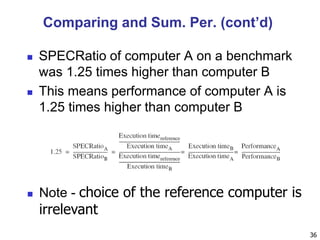
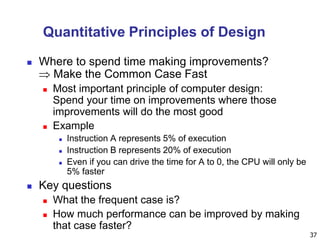
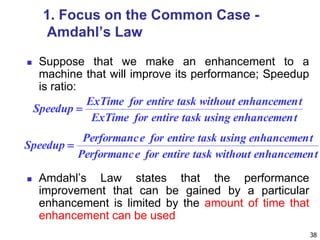

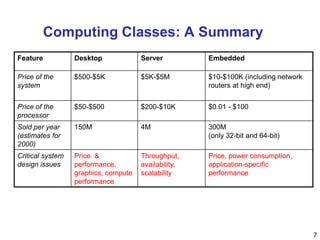
The document provides an introduction to fundamentals of computer design. It discusses the evolution of computers from large room-sized machines to handheld devices. It outlines three main classes of computing - desktops, servers, and embedded systems - and highlights their key design considerations and performance metrics. The quantitative principles of computer design involve measuring execution time and its components, such as instruction count and clock cycles per instruction, to evaluate and compare performance.