Download as PDF, PPTX
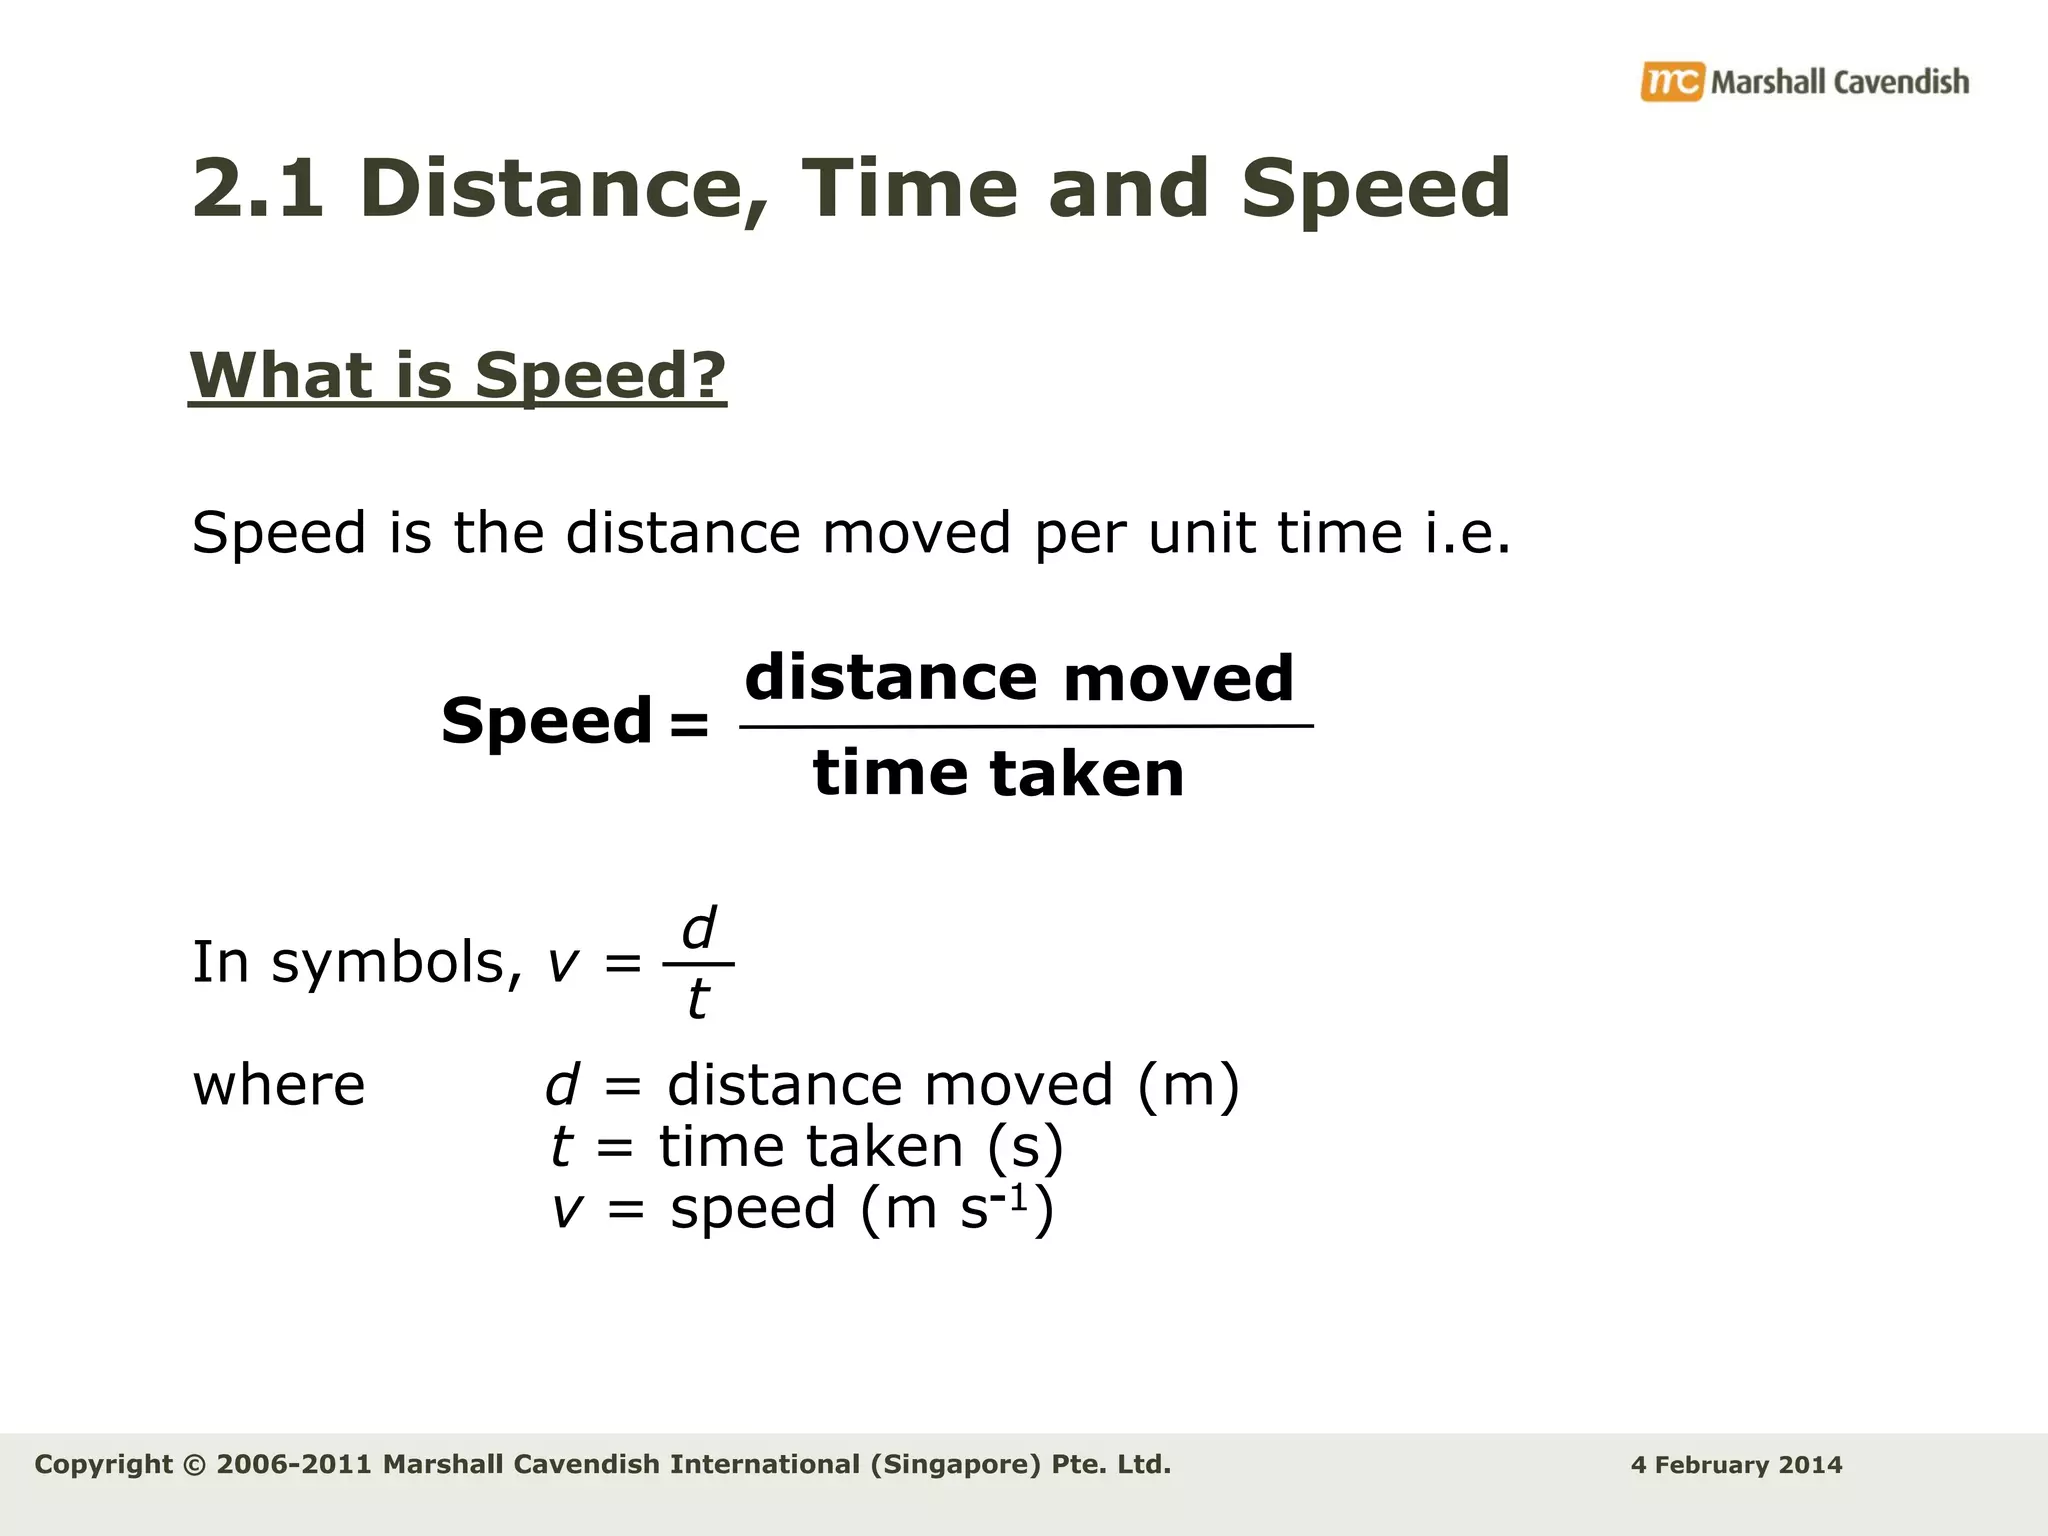
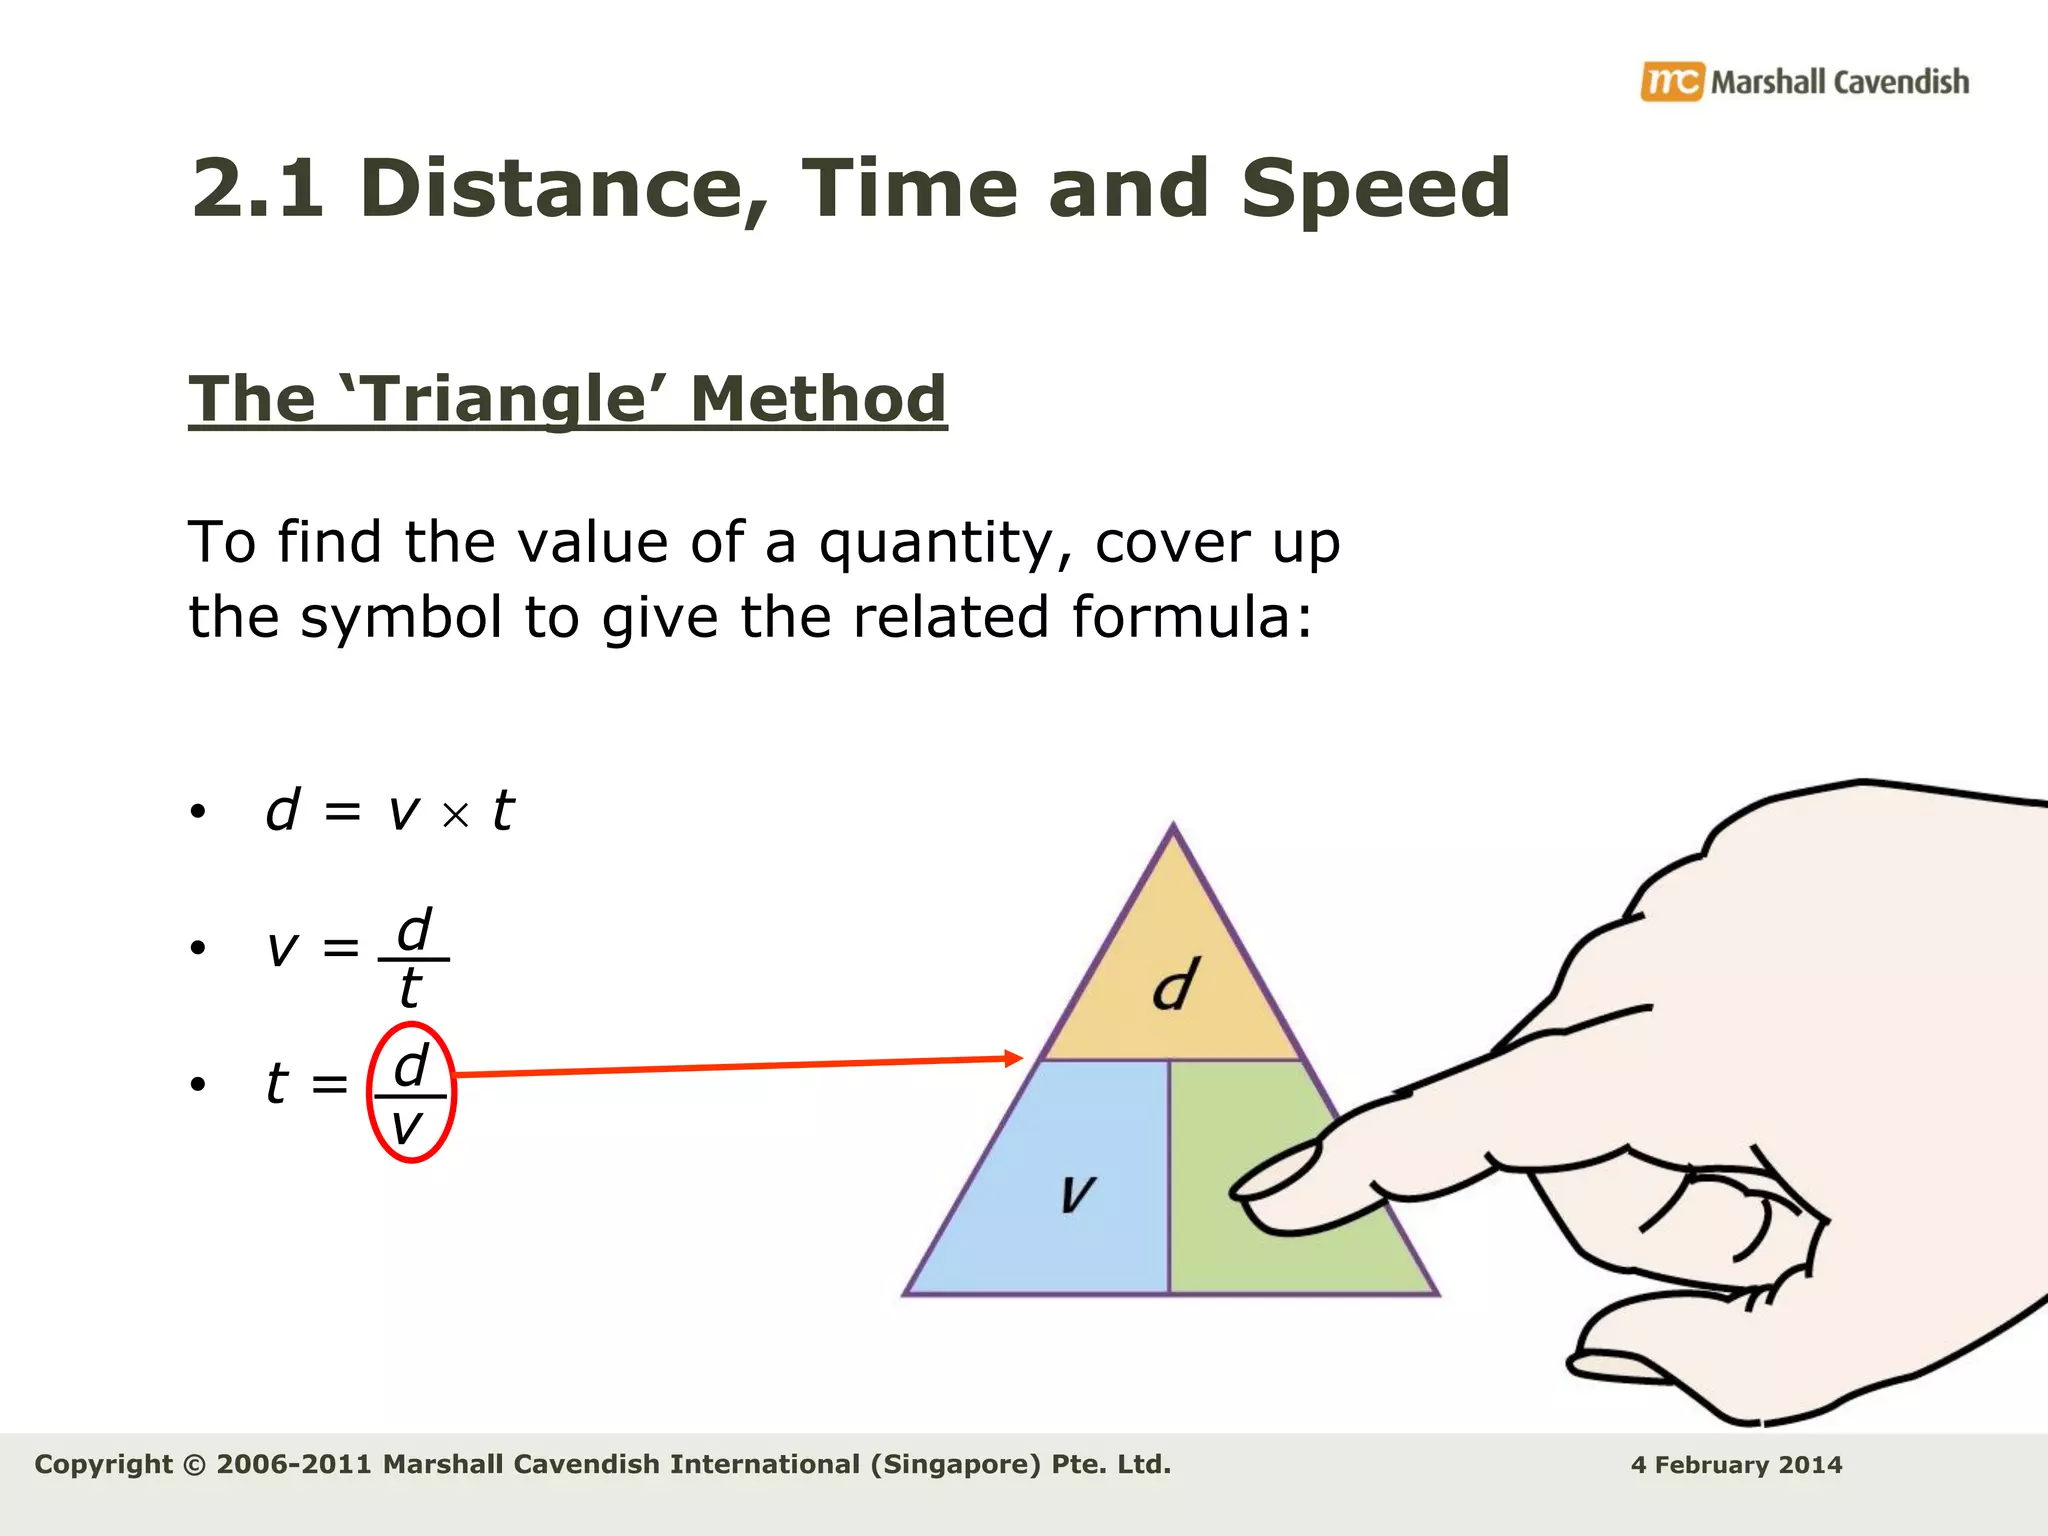
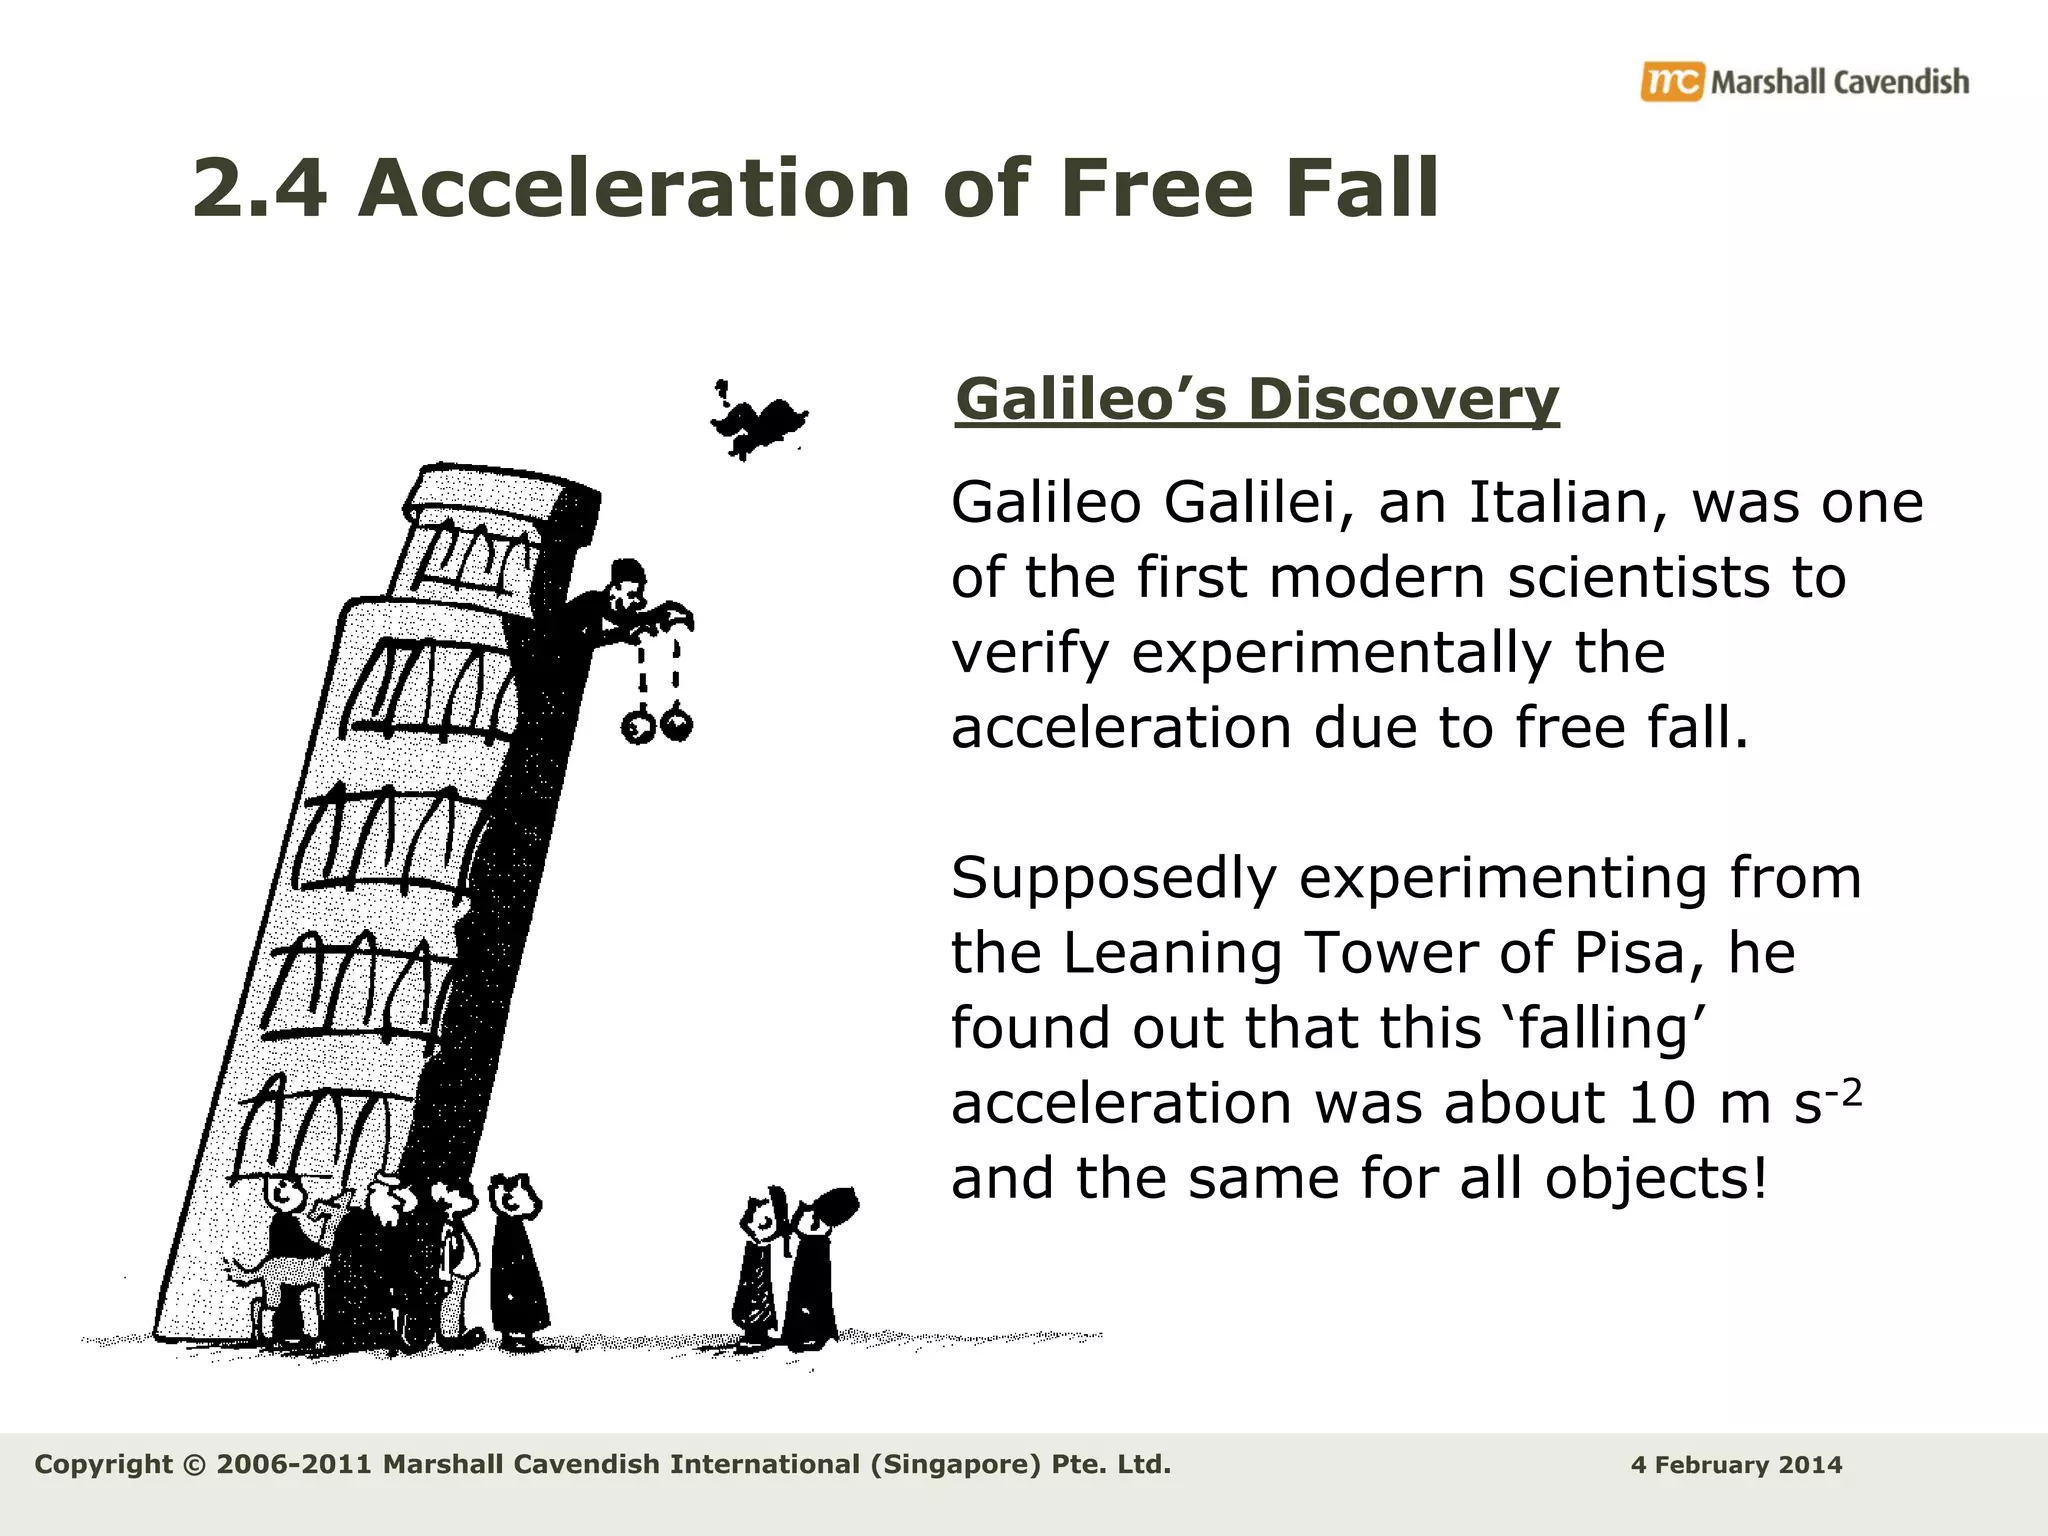
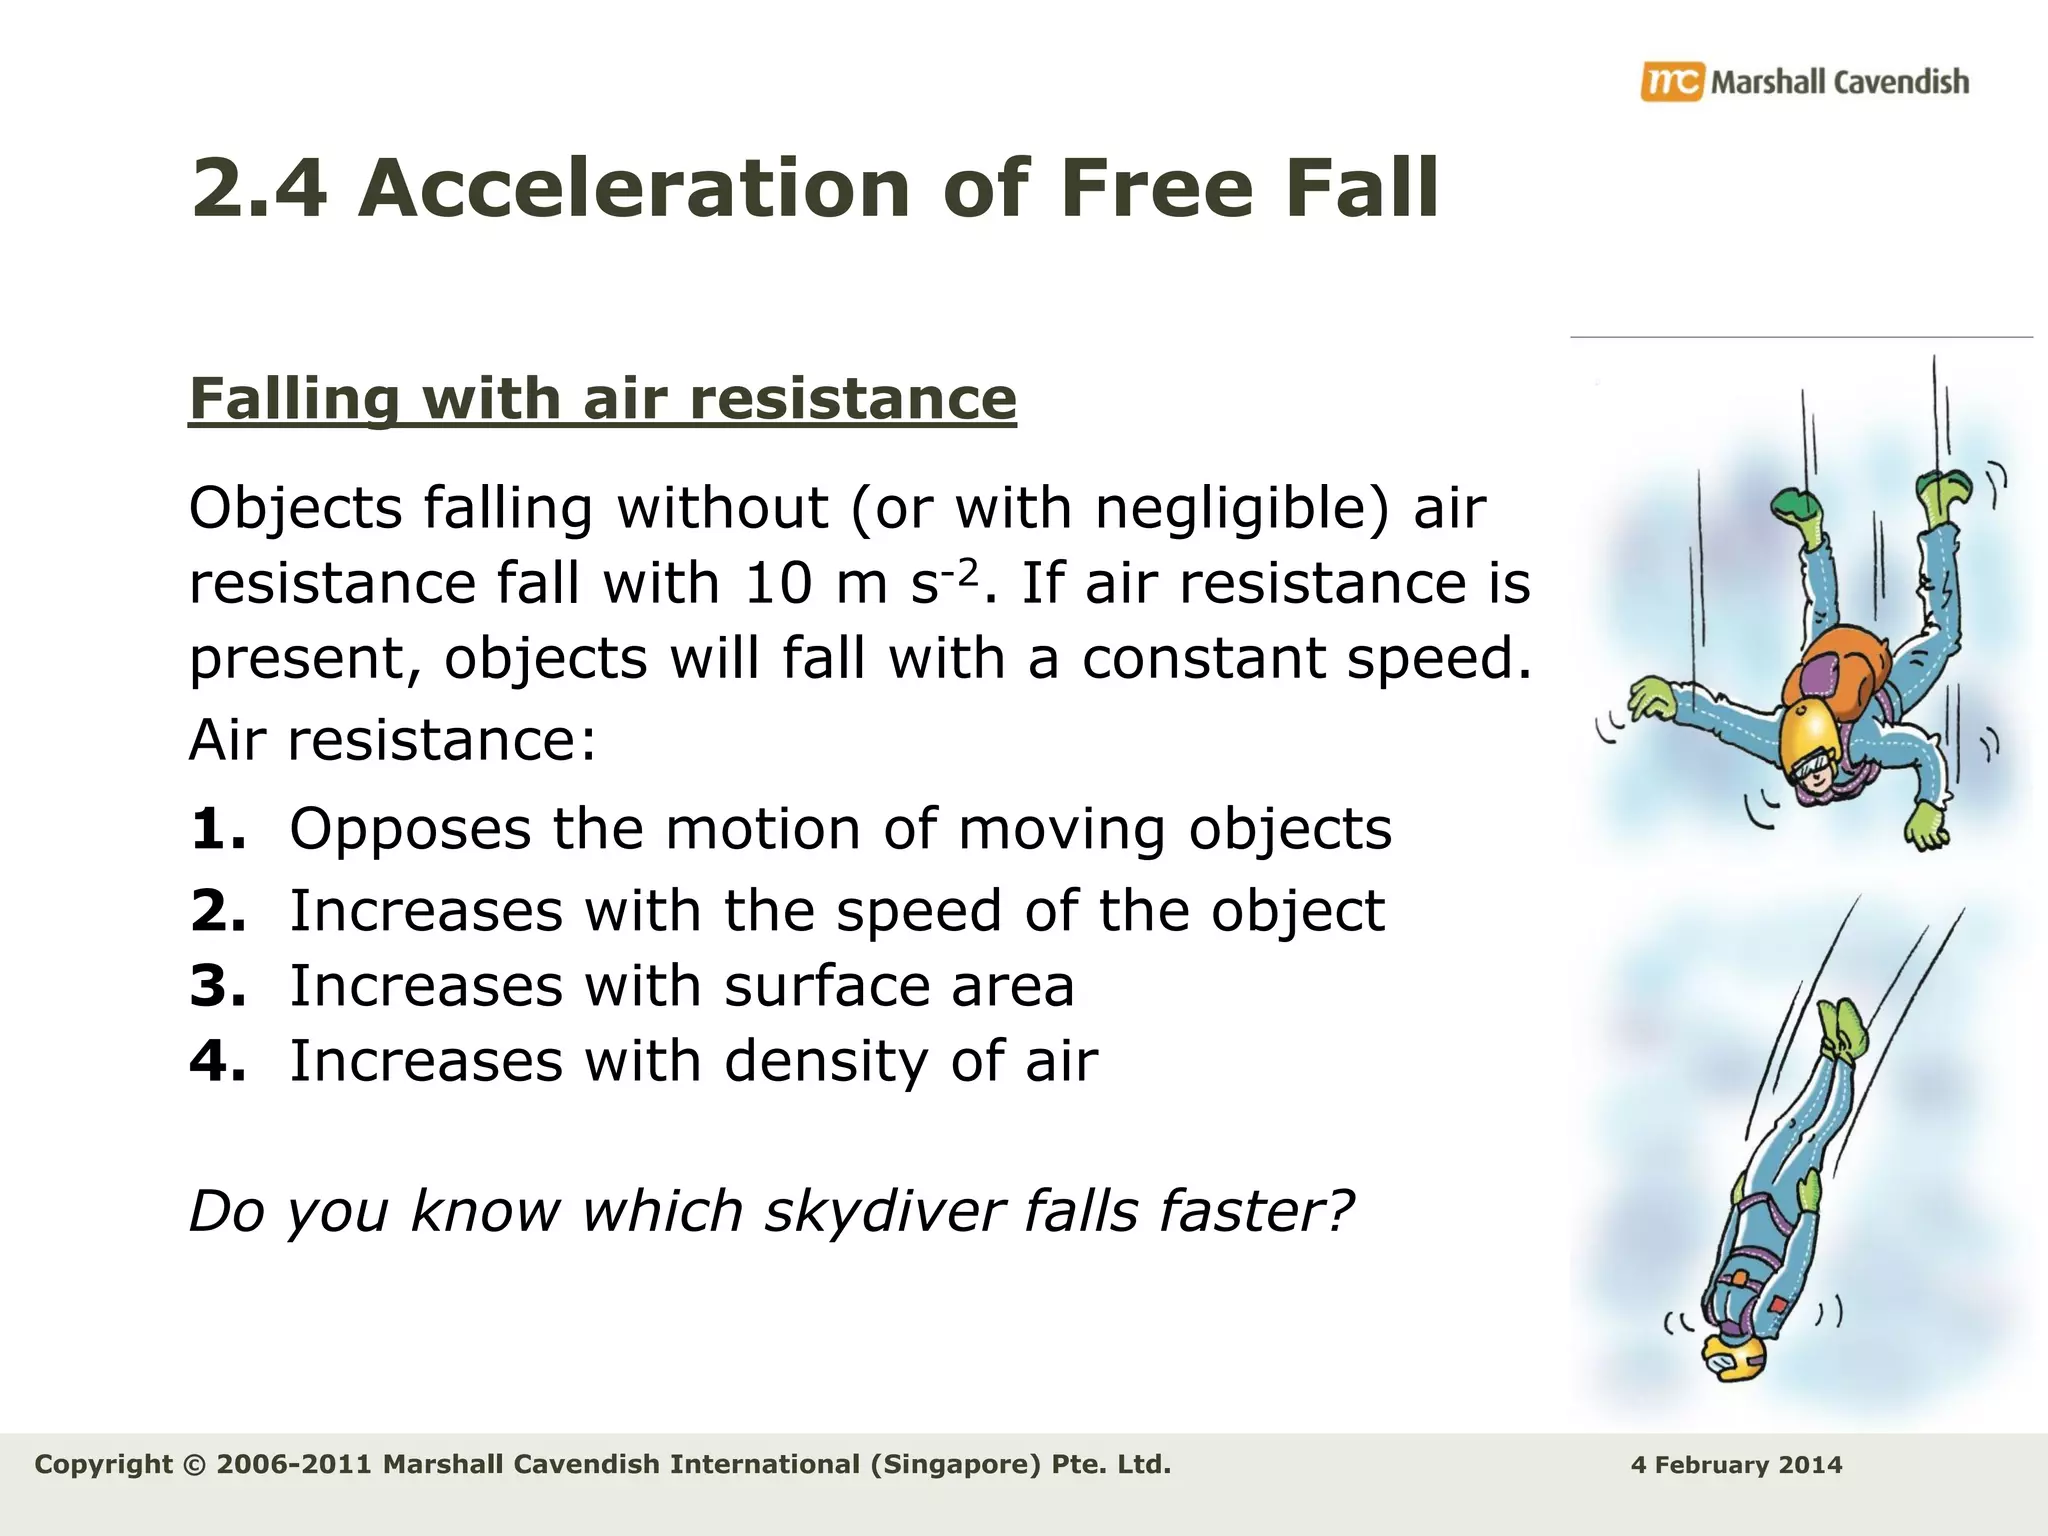

This document provides an overview of key concepts related to kinematics including distance, time, speed, velocity, acceleration, and free fall. It begins by defining speed and describing how to calculate average speed. It then discusses velocity and acceleration, explaining how to calculate changes in velocity and acceleration. Graphs of distance-time, speed-time and their interpretations are presented. The document concludes by discussing Galileo's discovery of the acceleration of free fall and how air resistance affects falling objects.


![Topic 1 - Forces and Motion [Autosaved].pptx](https://cdn.slidesharecdn.com/ss_thumbnails/topic1-forcesandmotionautosaved-231219145058-b924d3b6-thumbnail.jpg?width=640&height=640&fit=bounds)


