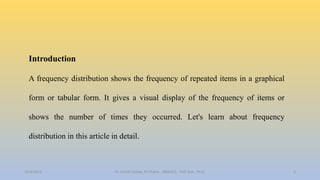
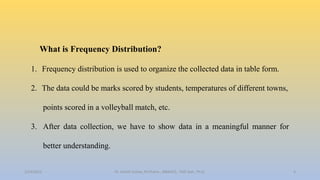
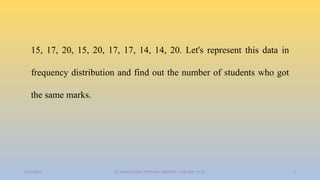
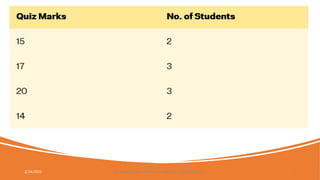
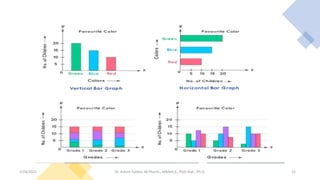
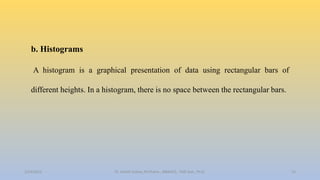
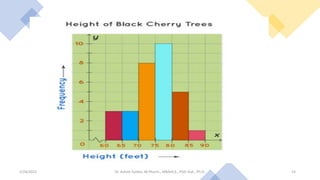
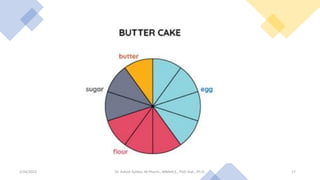
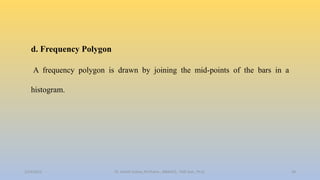
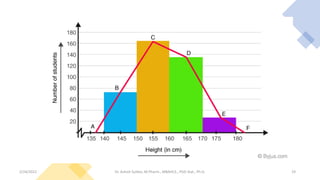
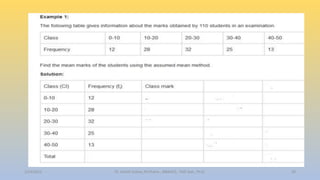
The document discusses frequency distribution, which organizes collected data into a table showing the frequency of items or values. It provides an example of students' quiz scores organized into a frequency distribution table showing the number of students who scored each mark. The document also discusses various graphical representations of frequency distributions, including bar graphs, histograms, pie charts, and frequency polygons, which provide visual displays of the frequency of data values.