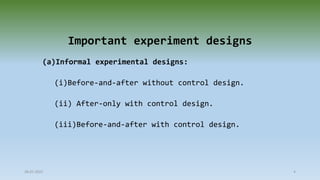
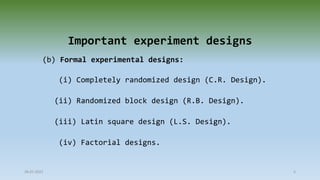
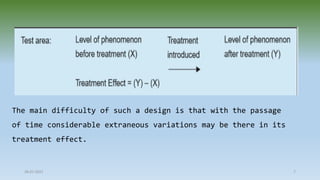
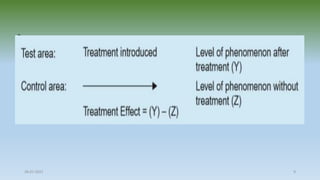
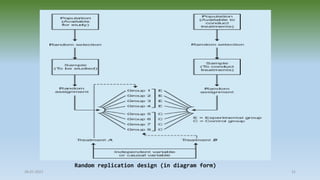
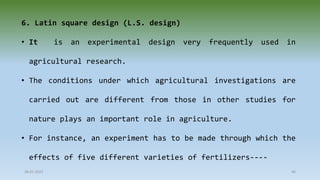
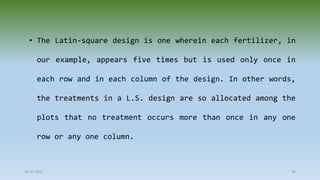
This document discusses different types of experimental designs, including informal and formal designs. Informal designs use less sophisticated analysis based on magnitude differences, while formal designs offer more control and use statistical analysis. Important informal designs are before-and-after without control, after-only with control, and before-and-after with control. Formal designs discussed include completely randomized, randomized block, Latin square, and factorial designs. Random replication design provides control for extraneous variables and randomizes differences among experiment conductors.
This document discusses optimization techniques used in pharmaceutical development. It defines optimization as making a formulation or process perfect by finding the best use of resources while considering all influencing factors. It describes independent and dependent variables, different optimization methods like evolutionary operation, simplex method, and statistical experimental designs including factorial, response surface, and Plackett-Burman designs. The advantages of optimization include determining important variables, measuring interactions, and allowing extrapolation to find the best product. Optimization has applications in formulation development, dissolution testing, tablet coating, and capsule preparation.
This document provides an overview of Design of Experiments (DOE) and the Box-Behnken design. It defines key terms like factors, responses, levels, and noise variables. It explains the different types of experimental designs like factorial, fractional factorial, screening, and response surface methodology. It describes the Box-Behnken design as a central composite design used to build a quadratic model and optimize factors. Several examples of applications in areas like adsorption processes and analytical methods optimization are also mentioned.
Experimental design involves planning experiments to describe or explain variations in information under different hypothesized conditions. The goal is to predict outcomes by introducing changes to preconditions and observing their effects. Key aspects of experimental design include selecting suitable variables, planning statistically optimal conditions given constraints, and establishing validity, reliability and replicability. Experimental designs aim to minimize confounding variables and allow inferences about relationships between independent and dependent variables. Common types of designs include between subjects, completely randomized, factorial, matched-pairs, quasi-experimental, longitudinal, cross-sectional, pretest-posttest, randomized block and randomized controlled trial designs. Completely randomized designs randomly assign subjects to groups to study primary factor effects without considering nuisance variables. Randomized complete block designs divide subjects
This document discusses various optimization techniques used in pharmaceutical development. It begins with defining optimization and providing an outline of topics to be covered, including key terms, parameters, experimental designs, applied methods, and references. Experimental designs discussed include factorial, response surface, central composite, Box-Behnken, Plackett-Burman, and Taguchi designs. Applied optimization methods include classic optimization techniques using calculus as well as statistical methods like EVOP. The objective of pharmaceutical optimization is to develop the optimal formulation while reducing costs through fewer experiments.
Optimization through statistical response surface methodsChristy George
The document summarizes the optimization of baicalin-loaded solid lipid nanoparticles using response surface methodology. A central composite design was employed to optimize the formulation using two factors - the amount of stearic acid and the amount of polyoxyl 40 hydrogenated castor oil. The design consisted of 20 experimental runs to determine the effects of the factors on the dependent variables of encapsulation efficiency and particle size. Optimization of the formulation led to improved drug loading and release characteristics.
This document discusses various optimization techniques used in pharmaceutical product development and processes. It defines optimization as making something as perfect, effective or functional as possible. It describes classic optimization methods, statistical experimental designs like factorial designs and response surface methodology. It discusses how design of experiments is used to study the relationship between factors and responses. The document concludes that optimization techniques have immense potential in developing pharmaceutical products and processes more efficiently with fewer resources.
This document summarizes key aspects of different types of experimental designs:
1) Completely Randomized Design (CRD) is used when experimental material is limited and homogeneous. It has a simple layout but provides no local control for environmental variation.
2) Randomized Block Design (RBD) controls for environmental variation between blocks but only in one direction. It allows for more treatments than CRD.
3) Latin Square Design (LSD) controls variation in two directions by arranging treatments in rows and columns. It provides more accurate results than CRD and RBD for a small number of treatments.
4) Split Plot Design (SPD) studies multiple factors simultaneously at different levels of precision by dividing plots into
Experiments
A Quick History of Design of Experiments
Why We Use Experimental Designs
What is Design of Experiment
How Design of Experiment contributes
Terminology
Analysis Of Variation (ANOVA)
Basic Principle of Design of Experiments
Some Experimental Designs
Chetan dhal-Optimization techniques in pharmaceutics, formulation and processingChetan Dhal
This document provides an overview of optimization techniques used in pharmaceutical formulation and processing. It discusses key optimization parameters like variables (independent and dependent) and problem types (constrained and unconstrained). Classical optimization methods like response surface methodology are described. The document focuses on experimental design techniques like factorial designs (full and fractional), response surface methodology using central composite design and Box-Behnken design, and adding center points. It provides examples of different types of experimental designs and how they are used to optimize pharmaceutical processes and formulations.
The document discusses optimization in pharmaceutical formulation and processing. It defines optimization as choosing the best alternative from available options. Optimization in pharmacy involves formulating drug products using the best combination of ingredients and processing parameters. Experimental design techniques are used to optimize multiple variables. Response surface methodology and central composite designs are commonly used to model quadratic relationships between variables. The document outlines different types of experimental designs and their applications in pharmaceutical optimization.
This document discusses various optimization techniques used in pharmaceutical product development including EVOP method, statistical designs like simplex method and response surface methodology, contour design, and factorial designs. It provides details on each technique such as the basic concepts, advantages, disadvantages and examples. EVOP method involves making small repeated changes to a formulation to optimize it but requires more time. Statistical designs help optimize formulations with 1-3 variables. Contour design uses constraints to optimize multiple response variables. Response surface methodology uses statistical techniques to build empirical models and optimize responses influenced by several variables. Factorial designs study the effects of individual and interacting input parameters on experimental outcomes.
The document discusses fractional factorial designs, which use a fraction of the total number of combinations in a full factorial design to reduce the number of required runs. It describes how effects become confounded in fractional designs and how design resolution relates to confounding. It provides examples of 2-level and 3-level fractional factorial designs, and discusses other types of designs like Plackett-Burman, central composite, and Taguchi designs. The key benefits of fractional factorial designs are reducing the number of required runs when there are many factors to investigate.
various applied optimization techniques and their role in pharmaceutical scie...aakankshagupta07
[1] Various optimization techniques and their role in pharmaceutical sciences was presented. Key terms, objectives, advantages, and types of optimization techniques were discussed. [2] Classical techniques like factorial designs and response surface methodology were compared to applied techniques like evolutionary operation, simplex lattice, and Lagrangian methods. [3] Examples of using simplex and Lagrangian methods to optimize tablet formulations based on factors like disintegrants and lubricants were provided to illustrate applications of these optimization techniques.
Use of Definitive Screening Designs to Optimize an Analytical MethodPhilip Ramsey
discusses using a definitive screening design to characterize and optimize a glycoprofiling method and compares the definitive screening results to a much larger central composite design results
Basic Concepts of Experimental Design & Standard Design ( Statistics )Hasnat Israq
This gives the basic description of Design and Analysis of Experiment . This is one of the most important topic in Statistics and also for Mathematics and for Researchers-Scientists
S1 - Process product optimization using design experiments and response surfa...CAChemE
An intensive practical course mainly for PhD-students on the use of designs of experiments (DOE) and response surface methodology (RSM) for optimization problems. The course covers relevant background, nomenclature and general theory of DOE and RSM modelling for factorial and optimisation designs in addition to practical exercises in Matlab. Due to time limitations, the course concentrates on linear and quadratic models on the k≤3 design dimension. This course is an ideal starting point for every experimental engineering wanting to work effectively, extract maximal information and predict the future behaviour of their system.
Mikko Mäkelä (DSc, Tech) is a postdoctoral fellow at the Swedish University of Agricultural Sciences in Umeå, Sweden and is currently visiting the Department of Chemical Engineering at the University of Alicante. He is working in close cooperation with Paul Geladi, Professor of Chemometrics, and using DOE and RSM for process optimization mainly for the valorization of industrial wastes in laboratory and pilot scales.”
Res 351 final exam guide 9) In the Southeast, the potato chip market share h...sankarfinal
9) In the Southeast, the potato chip market share held by the Lays brand is 46%. This is an example of _____.
A. a research question
B. a descriptive hypothesis
C. a relational hypothesis
D. an explanatory hypothesis
This document provides information on general factor factorial designs. It defines factorial designs as experiments that study the effects of two or more factors by investigating all possible combinations of the factors' levels. Factorial designs are more efficient than one-factor-at-a-time experiments and allow for the estimation of factor effects at different levels of other factors. However, factorial designs become prohibitively large as the number of factors increases and can be difficult to interpret when interactions are present. The document also provides examples of designing two-factor factorial experiments using completely randomized and randomized complete block designs.
The document discusses Taguchi screening designs, which are a type of experimental design used in product development to identify the main factors affecting a process using a minimal number of tests. It explains key terms like experimental design, screening design, and Taguchi method. The document compares screening designs to full factorials and lists advantages and disadvantages of each. It provides details on how to set up and analyze Taguchi screening designs, including determining variables and levels, selecting a screening design, setting up the test matrix, analyzing main effects plots, and confirming results. Resources on experimental design are also listed.
Res 351 final exam guide 9) In the Southeast, the potato chip market share he...laksminarayanakmpv
9) In the Southeast, the potato chip market share held by the Lays brand is 46%. This is an example of _____.
A. a research question
B. a descriptive hypothesis
C. a relational hypothesis
D. an explanatory hypothesis
PREDICTING CLASS-IMBALANCED BUSINESS RISK USING RESAMPLING, REGULARIZATION, A...IJMIT JOURNAL
We aim at developing and improving the imbalanced business risk modeling via jointly using proper
evaluation criteria, resampling, cross-validation, classifier regularization, and ensembling techniques.
Area Under the Receiver Operating Characteristic Curve (AUC of ROC) is used for model comparison
based on 10-fold cross validation. Two undersampling strategies including random undersampling (RUS)
and cluster centroid undersampling (CCUS), as well as two oversampling methods including random
oversampling (ROS) and Synthetic Minority Oversampling Technique (SMOTE), are applied. Three highly
interpretable classifiers, including logistic regression without regularization (LR), L1-regularized LR
(L1LR), and decision tree (DT) are implemented. Two ensembling techniques, including Bagging and
Boosting, are applied on the DT classifier for further model improvement. The results show that, Boosting
on DT by using the oversampled data containing 50% positives via SMOTE is the optimal model and it can
achieve AUC, recall, and F1 score valued 0.8633, 0.9260, and 0.8907, respectively.
The document discusses various optimization methods used in the pharmaceutical industry including evolutionary operations, simplex method, Lagrangian method, search method, and canonical analysis. It provides examples of how each method can be applied to optimize different parameters of a tablet formulation such as concentrations of excipients, compression force, and disintegrant levels to minimize disintegration time and friability while meeting constraints. The search method example involves using a five-factor central composite design to optimize tablet properties and identify the best formulation based on constraints for multiple response variables.
Optimization techniques and various method of optimization
Full Factorial Design
Introduction to Contour Plots
Introduction of Response Surface Design
Classification
Characteristics of Design
Matrix and analysis of design with case study
Equation of Full and Reduced mathematical models in experimental designs
Central Composite designs
Taguchi and mixtures designs
Application of experimental designs in pharmacology for reduction of animal
The document provides information on the basic principles of experimental design, including replication, randomization, and local control. It then discusses the completely randomized design (CRD) in detail. The CRD allocates treatments randomly across experimental units. It has advantages like maximum use of units and simple analysis, but disadvantages like more experimental error. The document also introduces the randomized block design (RBD) which controls for variation among blocks. The RBD stratifies the experimental area into blocks and allocates treatments randomly within each block.
The document discusses the steps for conducting a response surface methodology (RSM) experiment using central composite design (CCD). It involves determining independent and dependent variables, selecting an appropriate CCD, conducting the experiment runs according to the design, analyzing the data using statistical methods to develop a mathematical model and check its adequacy, and using the model to optimize responses. Key aspects of RSM and CCD covered include developing the design, analyzing results through ANOVA and regression, and checking model validity.
This document provides an introduction to design of experiments. It discusses how industrial engineering draws upon various fields like mathematics, physical sciences, and social sciences. It also discusses key concepts like systems, factors and treatments, the P diagram, and noise factors. The goal of experimental design is to specify, predict, and evaluate results from integrated systems through designing and analyzing experiments.
types and concept of experimental research design .pptxssuserb9efd7
The document discusses different types of research designs, including exploratory, descriptive, and experimental designs. It provides examples of each type and explains their purposes. The document also covers informal experimental designs like before-after and after-only designs as well as formal designs like completely randomized, randomized block, Latin square, and factorial designs. It explains how to implement each design and which statistical analyses can be used. The conclusion emphasizes that a strong research design contains a clear problem statement, data collection procedures, details on the study population, and plans for data analysis.
This document discusses research design and experimental research design. It defines research design and its purpose. There are four main types of research design: exploratory, descriptive, diagnostic, and experimental. Experimental research design tests hypotheses about causal relationships between variables. There are informal and formal experimental designs. Informal designs include before-after, after-only, and before-after with control. Formal designs include completely randomized, randomized block, Latin square, and factorial designs. The document provides details about each design type.
This document discusses different types of research designs, including experimental and non-experimental designs. Experimental designs include within-group designs, between-group designs (such as two-group, multi-group, and factorial designs), and small N designs. Non-experimental designs discussed are quasi-experiments, correlational designs, and pseudo-experiments. The document provides details on the characteristics and advantages/disadvantages of each type of design.
FORMAL RESEARCH DESIGN Research methodologyMayuri vadher
This document discusses various formal research designs used in market research and methodology. It describes the basic principles of formal experimental design including replication, randomization, and local control. It then defines and provides examples of different types of formal designs like completely randomized design, randomized block design, Latin square design, and factorial designs. Factorial designs allow determining the main effects of two or more factors in a single experiment and permit other comparisons of interest. Complex factorial designs are used for experiments with more than two factors.
Research design refers to the plan and structure of an investigation aimed at answering research questions. The plan outlines steps from developing hypotheses to analyzing data. Structure provides a framework relating study elements. Research design expresses the problem structure and investigation plan used to obtain evidence on relationships.
The basic purposes of research design are to provide answers to research questions and maximize experimental variance. Common designs include experimental and control groups with random assignment, as well as quasi-experimental designs using techniques like propensity score matching when randomization is not possible. Proper research design, whether experimental or quasi-experimental, aims to estimate treatment impacts while controlling for confounding factors.
This document discusses different experimental designs used in analysis of variance (ANOVA). It describes the completely randomized design, randomized block design, Latin square design, and factorial design. For each design, it covers key aspects like blocking, randomization, replication, and advantages/disadvantages. The goal of experimental designs is to reduce experimental errors and improve precision when investigating relationships between independent and dependent variables.
The document discusses optimization techniques used in pharmaceutical formulation and processing. It describes how optimization aims to find the best formulation and processing conditions by systematically varying factors and levels. Various experimental designs like factorial designs and response surface methodology are used to optimize multiple variables. Optimization helps develop formulations that meet requirements while allowing efficient mass production.
The document discusses key principles of experimental design, including replication, randomization, and local control. It then summarizes different types of experimental designs such as completely randomized design, randomized block design, Latin square design, and factorial designs. Key points about each design are highlighted, along with examples to illustrate how they are applied.
Experimental Design presentation slides for level 400.pptxSethKoomson1
for agriculture research bbbbbbbbbbbbbbbbbbbbbbbbbbbbbbbbbbbbbbbbbbbbbbbbbbbbbbbbbbbbbbbbbbbbbbbbbbbbbbbbbbbbbbbbbbbbbbbbbbbbbbbbbbbbbbbbbbbbbbbbbbbbbbbbbbbbbbbbbbbbbbbbbbbbbbbbbbbbbbbbbbbbbbbbbbbbbbbbbbbbbbbbbbbbbbbbbbbbbbbbbbbbbbb
Understanding the Experimental Research Design(Part II)DrShalooSaini
This Power Point Presentation has been made while referring to the research books written by eminent, renowned and expert authors as mentioned in the references section. The purpose of this Presentation is to help the research students in developing an insight about the Experimental Research Design(Part- II).
1) The document discusses experimental design and introduces three basic principles: randomization, replication, and local control.
2) It then describes three common techniques for experimental design: completely randomized design (CRD), randomized block design (RBD), and Latin square design.
3) CRD is explained as the simplest design where all treatments are randomly assigned among experimental subjects, allowing equal probability of any treatment. It is suitable when experimental materials are homogeneous.
1) The document describes a unit on repeated measures designs, including a review of standard repeated measures analyses using linear models and multi-level modeling, as well as an alternative approach.
2) Key features of repeated measures designs are discussed, such as having more than one observation per participant. Advantages and challenges like order effects are also reviewed.
3) Methods for analyzing repeated measures data using linear models by first transforming the data into wide format using differences and averages are described and compared to a multi-level modeling approach.
This document discusses various optimization techniques used in pharmaceutical formulation and processing. It begins with introducing concepts of optimization and defining optimization parameters such as independent and dependent variables. It then describes different experimental design approaches including classical optimization, statistical design of experiments, and various optimization methods like evolutionary operations, simplex method, and Lagrangian method. Specific examples are provided to illustrate full factorial design and simplex optimization approach.
FIDUCIAL POINTS DETECTION USING SVM LINEAR CLASSIFIERScsandit
Currently, there is a growing interest from the scientific and/or industrial community in respect
to methods that offer solutions to the problem of fiducial points detection in human faces. Some
methods use the SVM for classification, but we observed that some formulations of optimization
problems were not discussed. In this article, we propose to investigate the performance of
mathematical formulation C-SVC when applied in fiducial point detection system. Futhermore,
we explore new parameters for training the proposed system. The performance of the proposed
system is evaluated in a fiducial points detection problem. The results demonstrate that the
method is competitive.
This document discusses research design and measurement. It defines research design and describes exploratory, descriptive, and experimental designs. Exploratory research is used to better understand undefined problems, descriptive research accurately describes variables, and experimental research tests hypotheses about causal relationships. Informal designs like before-after and after-only designs are less sophisticated, while formal designs like completely randomized and randomized block designs offer more control using statistics. Key concepts are also defined, like independent and dependent variables, and principles of experimental design like replication and randomization are explained.
Optimal design & Population mod pyn.pptxPawanDhamala1
This document discusses optimal design and population modeling. It begins with an introduction to optimal design, noting that it allows parameters to be estimated without bias and with minimum variance. The advantages of optimal design are that it reduces experimentation costs by allowing statistical models to be estimated with fewer runs. It then describes different types of optimal designs such as A, C, D, and E optimality. The document next discusses population modeling, explaining that it is a tool for integrating data to aid drug development decisions. It notes the key components of population models are structural models, stochastic models, and covariate models. Structural models describe the response over time using algebraic or differential equations, while stochastic models describe variability and covariate models influence factors like dem
The document discusses different research design frameworks, including classical experimental design, cross-sectional design, and quantitative-qualitative design. For classical experimental design, it describes the key elements of having an experimental and control group, manipulating an independent variable, pre-testing and post-testing, and comparing results. Cross-sectional design is more common in social sciences and uses statistical analysis rather than manipulation. Quantitative design seeks to objectively explain social facts while qualitative design understands social phenomena from participant perspectives. The appropriate design depends on the research question, level of control, and type of data.
The document discusses various experimental research designs used in empirical studies. It defines key concepts like independent variables, dependent variables, and test units. It then describes different types of research designs including pre-experimental designs (one-shot case study, one group pre-test post-test), quasi-experimental designs (time series, multiple time series), true experimental designs (pre-test post-test control group, Solomon four-group design), and statistical designs (completely randomized design, randomized block design, Latin square design, factorial design). Examples are provided for each design to illustrate how they are applied in experiments.
This document defines and explains different types of experimental research designs used in causal research. It discusses the key concepts of independent variables, dependent variables, test units, and extraneous variables. It then categorizes and describes different experimental designs including pre-experimental, true experimental, quasi-experimental, and statistical designs. For each design, it provides an example and explanation of how the design is implemented and its advantages/limitations.
This document discusses experimental design in statistics. It defines experimental design as a planned interference by the researcher to manipulate events rather than just observe them. It discusses key principles of experimental design like replication and randomization. It also describes different types of experimental designs like completely randomized design, randomized block design, and Latin square design; and notes that researchers use experimental designs to make causal inferences and rule out alternative explanations. The goal of experimental design is to gain unambiguous information about what factors cause the effects being studied.
Unti 1 bp801 t ga correlation worksheet24022022ashish7sattee
The document contains instructions for calculating Pearson's correlation coefficient from sample data and calculating multiple correlation coefficients from additional sample data. It provides data sets with marks in pharmacognosy and statistics, as well as data for variables X1, X2, and X3. The goal is to calculate the correlation coefficients and interpret the values.
Unit ibp801 t l multiple correlation a24022022ashish7sattee
The multiple correlation coefficient denotes the correlation between one variable and multiple other variables. It is represented as R1.234...k, where 1 is the variable being correlated and 2, 3, 4, etc. are the other variables. As an example, R1.23 would represent correlating variable 1 with variables 2 and 3 simultaneously by creating a linear combination of 2 and 3. The document then discusses using multiple correlation to correlate academic achievement with a linear combination of anxiety and intelligence.
Unit i bp801 t k spearman coefficient of correlation24022022ashish7sattee
The Spearman's rank correlation coefficient is a nonparametric measure of the monotonic relationship between two ranked variables. It assesses how well the relationship between two variables can be described using a monotonic function. Unlike Pearson's correlation, the Spearman's correlation does not assume a linear relationship between variables and can be used when assumptions of interval/ratio scaling and bivariate normality are not met. The Spearman's correlation measures statistical dependence between two variables using a monotonic function to represent their relationship.
Unit i bp801 t j introduction to correlation 24022022ashish7sattee
This document provides an introduction to correlation. It defines correlation as quantifying the relationship between two quantitative variables. A positive correlation means high values of one variable are associated with high values of the other, while a negative correlation means high values of one variable are associated with low values of the other. The document uses a data set measuring socioeconomic status and bicycle helmet use across neighborhoods to illustrate these concepts. It shows the data follows a negative correlation, with higher socioeconomic status associated with lower helmet use. The correlation coefficient is introduced as a measure of the strength and direction of correlation.
Unit 1 bp801 t g correlation analysis24022022ashish7sattee
Correlation is a statistical measure that indicates the extent to which two or more variables fluctuate together. A positive correlation indicates that the variables increase or decrease in parallel, while a negative correlation indicates that one variable increases as the other decreases. A correlation of -0.97 represents a strong negative correlation, while 0.10 represents a weak positive correlation. Correlations above 0.4 are generally considered relatively strong. Even if there is no linear relationship between two variables, it does not necessarily mean that no relationship exists at all.
Unit 1 bp801 t f standard deviation 24022022ashish7sattee
Standard deviation is a measure of how dispersed the values in a data set are from the mean. It is calculated as the square root of the variance, which is the average of the squared distances from the mean. A lower standard deviation indicates values are closer to the mean, while a higher standard deviation means values are more spread out from the mean. Standard deviation can be used to calculate both grouped and ungrouped data, as well as discrete and continuous variables.
The document discusses the statistical concept of range. Range is defined as the difference between the highest and lowest values in a data set. To calculate range, values must first be arranged from lowest to highest. Range is then found using the formula: Range = Highest Value - Lowest Value. While range indicates variability, it can be misleading when outliers are present, as a single extreme value will impact the calculated range. Two examples are provided to demonstrate calculating range.
The mode is the value that occurs most frequently in a data set. It represents the observation with the highest frequency. For an ungrouped data set, the mode is the value with the maximum number of occurrences. A data set can have no mode, one mode (unimodal), or multiple modes (bimodal, trimodal, or multimodal). When data is grouped, the mode is calculated using the frequency and limits of the modal class along with the preceding and succeeding classes. There is also an empirical relationship between the mean, median, and mode of a data set.
Unit 1 bp801 t c median with solved examplesashish7sattee
The document defines and provides examples to illustrate the median, which represents the middle-most value of a data set. The median is calculated by arranging the data points in ascending order and selecting the middle value for an odd number of points, or averaging the two middle values for an even number of points. The median is useful for summarizing large data sets with a single value and is less influenced by outliers than the mean. Examples are provided to demonstrate calculating the median for both discrete and grouped data.
Unit 1 bp801 t b frequency distributionashish7sattee
The document discusses frequency distribution, which organizes collected data into a table showing the frequency of items or values. It provides an example of students' quiz scores organized into a frequency distribution table showing the number of students who scored each mark. The document also discusses various graphical representations of frequency distributions, including bar graphs, histograms, pie charts, and frequency polygons, which provide visual displays of the frequency of data values.
Unit 1 BP801T a introduction mean median mode ashish7sattee
This document provides information and examples for calculating various statistical measures - mean, median, mode, range - from data sets. It explains that the mean is the average found by adding all values and dividing by the number of values, the median is the middle number of a data set arranged in order, and the mode is the most frequently occurring value. Examples are given to demonstrate calculating each measure from sets of test score data. Frequency and cumulative frequency are also defined.
Standard deviation is a measure of how dispersed data values are from the mean. It is calculated as the square root of the variance, which is the average of the squared differences from the mean. A lower standard deviation means values are closer to the mean, while a higher standard deviation means values are more spread out from the mean. The document provides steps to calculate standard deviation for both grouped and ungrouped data, as well as formulas for finding the standard deviation of a sample or entire population.
Unit 1 BP801T t h multiple correlation examplesashish7sattee
- The document discusses multiple correlation and the multiple correlation coefficient.
- Multiple correlation is the study of the combined influence of two or more variables on a single variable.
- The multiple correlation coefficient is defined as the simple correlation coefficient between a variable and its estimate based on two or more other variables.
- A formula is derived for the multiple correlation coefficient that incorporates the total correlation coefficients between each variable pair.
MRM301T Research Methodology and Biostatistics: Euthanasia An Indian perspec...ashish7sattee
In our society, the palliative care and quality of life issues in patients with terminal illnesses like advanced cancer and AIDS have become an important concern for clinicians.
Parallel to this concern has arisen another controversial issue-euthanasia or “mercy –killing” of terminally ill patients.
MRM301T Research Methodology and Biostatistics: Confidentiality 1 22102021ashish7sattee
Ethicists rely heavily on case studies for research and teaching, but using patient information without consent raises confidentiality issues. Obtaining consent is difficult as patients may be incompetent, sensitive details are often essential to cases, and harms include violation of privacy. While public interest in medical ethics exists, there is no consensus on what constitutes public interest to justify publication without consent. Balancing privacy protections with contributions to ethical discussions remains challenging.
This document provides an overview of statistical tools used in research. It begins with an introduction to statistics and discusses descriptive and inferential statistics. Descriptive statistics summarize data through measures like the mean, median and mode, while inferential statistics make inferences about a population based on a sample. Both parametric and non-parametric statistical tests are covered. Common parametric tests include the t-test and ANOVA, which assume a normal distribution, while non-parametric tests like the chi-squared test are used when distributions are unknown. The document also reviews variables, types of data, statistical software options and includes examples and quizzes.
LAND USE LAND COVER AND NDVI OF MIRZAPUR DISTRICT, UPRAHUL
This Dissertation explores the particular circumstances of Mirzapur, a region located in the
core of India. Mirzapur, with its varied terrains and abundant biodiversity, offers an optimal
environment for investigating the changes in vegetation cover dynamics. Our study utilizes
advanced technologies such as GIS (Geographic Information Systems) and Remote sensing to
analyze the transformations that have taken place over the course of a decade.
The complex relationship between human activities and the environment has been the focus
of extensive research and worry. As the global community grapples with swift urbanization,
population expansion, and economic progress, the effects on natural ecosystems are becoming
more evident. A crucial element of this impact is the alteration of vegetation cover, which plays a
significant role in maintaining the ecological equilibrium of our planet.Land serves as the foundation for all human activities and provides the necessary materials for
these activities. As the most crucial natural resource, its utilization by humans results in different
'Land uses,' which are determined by both human activities and the physical characteristics of the
land.
The utilization of land is impacted by human needs and environmental factors. In countries
like India, rapid population growth and the emphasis on extensive resource exploitation can lead
to significant land degradation, adversely affecting the region's land cover.
Therefore, human intervention has significantly influenced land use patterns over many
centuries, evolving its structure over time and space. In the present era, these changes have
accelerated due to factors such as agriculture and urbanization. Information regarding land use and
cover is essential for various planning and management tasks related to the Earth's surface,
providing crucial environmental data for scientific, resource management, policy purposes, and
diverse human activities.
Accurate understanding of land use and cover is imperative for the development planning
of any area. Consequently, a wide range of professionals, including earth system scientists, land
and water managers, and urban planners, are interested in obtaining data on land use and cover
changes, conversion trends, and other related patterns. The spatial dimensions of land use and
cover support policymakers and scientists in making well-informed decisions, as alterations in
these patterns indicate shifts in economic and social conditions. Monitoring such changes with the
help of Advanced technologies like Remote Sensing and Geographic Information Systems is
crucial for coordinated efforts across different administrative levels. Advanced technologies like
Remote Sensing and Geographic Information Systems
9
Changes in vegetation cover refer to variations in the distribution, composition, and overall
structure of plant communities across different temporal and spatial scales. These changes can
occur natural.
How to Add Chatter in the odoo 17 ERP ModuleCeline George
In Odoo, the chatter is like a chat tool that helps you work together on records. You can leave notes and track things, making it easier to talk with your team and partners. Inside chatter, all communication history, activity, and changes will be displayed.
বাংলাদেশের অর্থনৈতিক সমীক্ষা ২০২৪ [Bangladesh Economic Review 2024 Bangla.pdf] কম্পিউটার , ট্যাব ও স্মার্ট ফোন ভার্সন সহ সম্পূর্ণ বাংলা ই-বুক বা pdf বই " সুচিপত্র ...বুকমার্ক মেনু 🔖 ও হাইপার লিংক মেনু 📝👆 যুক্ত ..
আমাদের সবার জন্য খুব খুব গুরুত্বপূর্ণ একটি বই ..বিসিএস, ব্যাংক, ইউনিভার্সিটি ভর্তি ও যে কোন প্রতিযোগিতা মূলক পরীক্ষার জন্য এর খুব ইম্পরট্যান্ট একটি বিষয় ...তাছাড়া বাংলাদেশের সাম্প্রতিক যে কোন ডাটা বা তথ্য এই বইতে পাবেন ...
তাই একজন নাগরিক হিসাবে এই তথ্য গুলো আপনার জানা প্রয়োজন ...।
বিসিএস ও ব্যাংক এর লিখিত পরীক্ষা ...+এছাড়া মাধ্যমিক ও উচ্চমাধ্যমিকের স্টুডেন্টদের জন্য অনেক কাজে আসবে ...
How to Setup Warehouse & Location in Odoo 17 InventoryCeline George
In this slide, we'll explore how to set up warehouses and locations in Odoo 17 Inventory. This will help us manage our stock effectively, track inventory levels, and streamline warehouse operations.
हिंदी वर्णमाला पीपीटी, hindi alphabet PPT presentation, hindi varnamala PPT, Hindi Varnamala pdf, हिंदी स्वर, हिंदी व्यंजन, sikhiye hindi varnmala, dr. mulla adam ali, hindi language and literature, hindi alphabet with drawing, hindi alphabet pdf, hindi varnamala for childrens, hindi language, hindi varnamala practice for kids, https://www.drmullaadamali.com
Exploiting Artificial Intelligence for Empowering Researchers and Faculty, In...Dr. Vinod Kumar Kanvaria
Exploiting Artificial Intelligence for Empowering Researchers and Faculty,
International FDP on Fundamentals of Research in Social Sciences
at Integral University, Lucknow, 06.06.2024
By Dr. Vinod Kumar Kanvaria
Walmart Business+ and Spark Good for Nonprofits.pdfTechSoup
"Learn about all the ways Walmart supports nonprofit organizations.
You will hear from Liz Willett, the Head of Nonprofits, and hear about what Walmart is doing to help nonprofits, including Walmart Business and Spark Good. Walmart Business+ is a new offer for nonprofits that offers discounts and also streamlines nonprofits order and expense tracking, saving time and money.
The webinar may also give some examples on how nonprofits can best leverage Walmart Business+.
The event will cover the following::
Walmart Business + (https://business.walmart.com/plus) is a new shopping experience for nonprofits, schools, and local business customers that connects an exclusive online shopping experience to stores. Benefits include free delivery and shipping, a 'Spend Analytics” feature, special discounts, deals and tax-exempt shopping.
Special TechSoup offer for a free 180 days membership, and up to $150 in discounts on eligible orders.
Spark Good (walmart.com/sparkgood) is a charitable platform that enables nonprofits to receive donations directly from customers and associates.
Answers about how you can do more with Walmart!"
Main Java[All of the Base Concepts}.docxadhitya5119
This is part 1 of my Java Learning Journey. This Contains Custom methods, classes, constructors, packages, multithreading , try- catch block, finally block and more.
Strategies for Effective Upskilling is a presentation by Chinwendu Peace in a Your Skill Boost Masterclass organisation by the Excellence Foundation for South Sudan on 08th and 09th June 2024 from 1 PM to 3 PM on each day.
2. Experimental design refers to the framework or structure
of an experiment and as such there are several
experimental designs. We can classify experimental
designs into two broad categories, viz., informal
experimental designs and formal experimental designs.
28-07-2021 2
3. Informal experimental designs are those designs that
normally use a less sophisticated form of analysis based
on differences in magnitudes, whereas formal
experimental designs offer relatively more control and
use precise statistical procedures for analysis.
28-07-2021 3
4. Important experiment designs
(a)Informal experimental designs:
(i)Before-and-after without control design.
(ii) After-only with control design.
(iii)Before-and-after with control design.
28-07-2021 4
6. 1.Before-and-after without control design: In such a design a
single test group or area is selected and the dependent
variable is measured before the introduction of the
treatment. The treatment is then introduced and the
dependent variable is measured again after the treatment has
been introduced. The effect of the treatment would be equal
to the level of the phenomenon after the treatment minus the
level of the phenomenon before the treatment. The design can
be represented thus:
28-07-2021 6
7. The main difficulty of such a design is that with the passage
of time considerable extraneous variations may be there in its
treatment effect.
28-07-2021 7
8. 2. After-only with control design: In this design two groups
or areas (test area and control area) are selected and the
treatment is introduced into the test area only. The dependent
variable is then measured in both the areas at the same time.
Treatment impact is assessed by subtracting the value of the
dependent variable in the control area from its value in the
test area. This can be exhibited in the following form:
28-07-2021 8
10. • The basic assumption in such a design is that the two areas
are identical with respect to their behaviour towards the
phenomenon considered.
• If this assumption is not true, there is the possibility of
extraneous variation entering into the treatment effect.
However, data can be collected in such a design without the
introduction of problems with the passage of time.
28-07-2021 10
11. • In this respect the design is superior to before-and-after
without control design.
28-07-2021 11
12. 28-07-2021 12
QUIZ.1
__________________experimental designs are those designs
that normally use a less sophisticated form of analysis
based on differences in magnitudes, whereas formal
experimental designs offer relatively more control and use
precise statistical procedures for analysis.
A. informal
b. formal
c. hypothesis
d. descriptive
13. 3. Before-and-after with control design:
• In this design two areas are selected and the dependent
variable is measured in both the areas for an identical
time-period before the treatment.
• The treatment is then introduced into the test area
only, and the dependent variable is measured in both for
an identical time-period after the introduction of the
treatment.
28-07-2021 13
14. 3. The treatment effect is determined by subtracting
the change in the dependent variable in the control
area from the change in the dependent variable in test
area. This design can be shown in this way:
28-07-2021 14
16. This design is superior to the above two designs for the
simple reason that it avoids extraneous variation resulting
both from the passage of time and from non-comparability of
the test and control areas. But at times, due to lack of
historical data, time or a comparable control area, we
should prefer to select one of the first two informal
designs stated above.
28-07-2021 16
18. 4. Completely randomized design (C.R. design):
a. Involves only two principles viz., the principle of
replication and the principle of randomization of experimental
designs. It is the simplest possible design and its procedure
of analysis is also easier.
b. The essential characteristic of the design is that subjects
are randomly assigned to experimental treatments (or vice-
versa). For instance, if we have 10 subjects and if we wish to
test 5 under treatment A and 5 under treatment B,----
28-07-2021 18
19. 4. Completely randomized design (C.R. design):
• ---the randomization process gives every possible group of
5 subjects selected from a set of 10 an equal opportunity
of being assigned to treatment A and treatment B.
c. One-way analysis of variance (or one-way ANOVA)* is used
to analyse such a design.
d. Even unequal replications can also work in this design. It
provides maximum number of degrees of freedom to the
error.
28-07-2021 19
20. Such a design is generally used when experimental areas
happen to be homogeneous.
e. Technically, when all the variations due to uncontrolled
extraneous factors are included under the heading of chance
variation, we refer to the design of experiment as C.R.
design.
28-07-2021 20
21. 28-07-2021 21
QUIZ.2
___________ is the design in which two areas are
selected and the dependent variable is measured in both
the areas for an identical time-period before the
treatment.
a. before-and-before with control design
B. before-and-after with control design
c. after- and-after with control design
d. after -and-before with control design
22. (i)Two-group simple randomized design:
In a two-group simple randomized design, first of all
the population is defined and then from the population a
sample is selected randomly.
Further, requirement of this design is that items, after
being selected randomly from the population, be randomly
assigned to the experimental and control groups---
28-07-2021 22
23. --(Such random assignment of items to two groups is
technically described as principle of randomization).
Thus, this design yields two groups as representatives
of the population. In a diagram form this design can
be shown in this way:
28-07-2021 23
24. 28-07-2021 24
QUIZ.3
In a ________group simple randomized design, first of
all the population is defined and then from the
population a sample is selected randomly.
a. five
b. one
C. two
d. three
26. Since in the sample randomized design the elements
constituting the sample are randomly drawn from the same
population and randomly assigned to the experimental and
control groups, it becomes possible to draw conclusions on
the basis of samples applicable for the population.
The two groups (experimental and control groups) of such a
design are given different treatments of the independent
variable.
28-07-2021 26
27. This design of experiment is quite common in research
studies concerning behavioural sciences.
The merit of such a design is that it is simple and
randomizes the differences among the sample items. But the
limitation of it is that the individual differences among
those conducting the treatments are not eliminated, i.e.,
it does not control the extraneous variable and as such the
result of the experiment may not depict a correct picture.
28-07-2021 27
28. This can be illustrated by taking an example.
Suppose the researcher wants to compare two groups of
students who have been randomly selected and randomly
assigned. Two different treatments viz., the usual
training and the specialised training are being given to
the two groups.
The researcher hypothesises greater gains for the group
receiving specialised training.
28-07-2021 28
29. To determine this, he tests each group before and after
the training, and then compares the amount of gain for the
two groups to accept or reject his hypothesis.
This is an illustration of the two-groups randomized
design, wherein individual differences among students are
being randomized.
But this does not control the differential effects of the
extraneous independent variables---
28-07-2021 29
30. -----(in this case, the individual differences among those
conducting the training programme).
28-07-2021 30
32. 28-07-2021 32
Random replications design:
• The limitation of the two-group randomized design is
usually eliminated within the random replications design.
• In the illustration just cited above the teacher
differences on the dependent variable were ignored, i.e.,
the extraneous variable was not controlled. But in a
random replications design, the effect of such differences
are minimised (or reduced) by providing a number of
repetitions for each treatment. Each repetition is
technically called a ‘replication’.
33. 28-07-2021 33
• Random replication design serves two purposes viz.,
it provides controls for the differential effects of
the extraneous independent variables and secondly, it
randomizes any individual differences among those
conducting the treatments. Diagrammatically we can
illustrate the random replications design thus in
above diagram.
34. 28-07-2021 34
QUIZ.4
_______provides controls for the differential effects of the
extraneous independent variables and secondly, it randomizes
any individual differences among those conducting the
treatments.
a. non-random replication design
b. inferential research design
c. Hypothesis design
D. random replication design
35. 28-07-2021 35
• From the diagram it is clear that there are two populations
in the replication design.
• The sample is taken randomly from the population available
for study and is randomly assigned to, say, four
experimental and four control groups.
• Similarly, sample is taken randomly from the population
available to conduct experiments---
36. 28-07-2021 36
• ---(because of the eight groups eight such
individuals be selected) and the eight
individuals so selected should be randomly
assigned to the eight groups.
37. 28-07-2021 37
• Generally, equal number of items are put in each group so
that the size of the group is not likely to affect the
result of the study.
• Variables relating to both population characteristics are
assumed to be randomly distributed among the two groups.
Thus, this random replication design is, in fact, an
extension of the two-group simple randomized design.
38. 28-07-2021 38
5. Randomized block design (R.B. design)
• It is an improvement over the C.R. design. In the R.B.
design the principle of local control can be applied
along with the other two principles of experimental
designs.
• In the R.B. design, subjects are first divided into
groups, known as blocks, such that within each group---
39. 28-07-2021 39
----the subjects are relatively homogeneous in respect
to some selected variable. The variable selected for
grouping the subjects is one that is believed to be
related to the measures to be obtained in respect of the
dependent variable.
40. 28-07-2021 40
The number of subjects in a given block would be equal
to the number of treatments and one subject in each
block would be randomly assigned to each treatment.
In general, blocks are the levels at which we hold the
extraneous factor fixed, so that its contribution to
the total variability of data can be measured.
41. 28-07-2021 41
The main feature of the R.B. design is that in this
each treatment appears the same number of times in
each block. The R.B. design is analysed by the two-way
analysis of variance (two-way ANOVA)* technique.
42. 28-07-2021 42
Let us illustrate the R.B. design with the help of an
example. Suppose four different forms of a
standardised test in statistics were given to each of
five students (selected one from each of the five I.Q.
blocks) and following are the scores which they
obtained.
44. 28-07-2021 44
If each student separately randomized the order in which
he or she took the four tests (by using random numbers or
some similar device), we refer to the design of this
experiment as a R.B. design.
The purpose of this randomization is to take care of such
possible extraneous factors (say as fatigue) or perhaps
the experience gained from repeatedly taking the test.
46. 28-07-2021 46
6. Latin square design (L.S. design)
• It is an experimental design very frequently used in
agricultural research.
• The conditions under which agricultural investigations are
carried out are different from those in other studies for
nature plays an important role in agriculture.
• For instance, an experiment has to be made through which the
effects of five different varieties of fertilizers----
47. 28-07-2021 47
-----on the yield of a certain crop, say wheat, it to be
judged.
• In such a case the varying fertility of the soil in
different blocks in which the experiment has to be performed
must be taken into consideration; otherwise the results
obtained may not be very dependable because the output
happens to be the effect not only of fertilizers,
48. 28-07-2021 48
but it may also be the effect of fertility of soil.
Similarly, there may be impact of varying seeds on the yield.
To overcome such difficulties, the L.S. design is used when
there are two major extraneous factors such as the varying
soil fertility and varying seeds.
49. 28-07-2021 49
• The Latin-square design is one wherein each fertilizer, in
our example, appears five times but is used only once in
each row and in each column of the design. In other words,
the treatments in a L.S. design are so allocated among the
plots that no treatment occurs more than once in any one
row or any one column.
50. 28-07-2021 50
• locking factors may be represented through rows and
columns (one through rows and the other through columns).
• The following is a diagrammatic form of such a design in
respect of, say, five types of fertilizers, viz., A, B, C,
D and E and the two blocking factor viz., the varying soil
fertility and the varying seeds:
52. 28-07-2021 52
• The above diagram clearly shows that in a L.S. design the
field is divided into as many blocks as there are
varieties of fertilizers and then each block is again
divided into as many parts as there are varieties of
fertilizers in such a way that each of the fertilizer
variety is used in each of the block (whether column-wise
or row-wise) only once.
53. 28-07-2021 53
• The analysis of the L.S. design is very similar to the
two-way ANOVA technique.
55. 28-07-2021 55
• The merit of this experimental design is that it enables
differences in fertility gradients in the field to be
eliminated in comparison to the effects of different
varieties of fertilizers on the yield of the crop. But
this design suffers from one limitation, and it is that
although each row and each column represents equally all
fertilizer varieties, there may be considerable difference
in the row and column means both up and across the field.
56. 28-07-2021 56
• Thus, in other words, means that in L.S. design we must
assume that there is no interaction between treatments and
blocking factors.
57. 28-07-2021 57
• This defect can, however, be removed by taking the means
of rows and columns equal to the field mean by adjusting
the results.
• Another limitation of this design is that it requires
number of rows, columns and treatments to be equal. This
reduces the utility of this design. In case of (2 × 2)
L.S. design, there are no degrees of freedom available
for the mean square error and hence the design cannot be
used.
58. 28-07-2021 58
• If treatments are 10 or more, than each row and each
column will be larger in size so that rows and columns
may not be homogeneous.
• This may make the application of the principle of
local control ineffective. Therefore, L.S. design of
orders (5 × 5) to (9 × 9) are generally used.
59. 28-07-2021 59
7. Factorial designs:
Factorial designs are used in experiments where the
effects of varying more than one factor are to be
determined.
They are specially important in several economic and
social phenomena where usually a large number of factors
affect a particular problem.
60. 28-07-2021 60
7. Factorial designs can be of two types:
(i)simple factorial designs and (ii) complex factorial
designs. We take them separately
https://explorable.com/factorial-design
61. 28-07-2021 61
(i)Simple factorial designs:
In case of simple factorial designs, we consider the
effects of varying two factors on the dependent variable,
but when an experiment is done with more than two factors,
we use complex factorial designs.
Simple factorial design is also termed as a ‘two-factor-
factorial design’, whereas complex factorial design is
known as ‘multifactor-factorial design.’
62. 28-07-2021 62
Simple factorial design may either be a 2 × 2 simple
factorial design, or it may be, say, 3 × 4 or 5 × 3 or the
like type of simple factorial design. We illustrate some
simple factorial designs as under:
63. 28-07-2021 63
Illustration 1: (2 × 2 simple factorial
design).
A 2 × 2 simple factorial design can graphically
be depicted as follows:
64. 28-07-2021 64
QUIZ.7
____________are used in experiments where the effects of
varying more than one factor are to be determined.
a. center of gravity designs
b. central composite design
C. factorial designs
d. star designs
65. 28-07-2021 65
In this design the extraneous variable to be controlled
by homogeneity is called the control variable and the
independent variable, which is manipulated, is called
the experimental variable.
Then there are two treatments of the experimental
variable and two levels of the control variable.
66. 28-07-2021 66
As such there are four cells into which the sample is
divided. Each of the four combinations would provide one
treatment or experimental condition. Subjects are
assigned at random to each treatment in the same manner
as in a randomized group design. The means for different
cells may be obtained along with the means for different
rows and columns.
67. 28-07-2021 67
Means of different cells represent the mean scores for the
dependent variable and the column means in the given design
are termed the main effect for treatments without taking
into account any differential effect that is due to the
level of the control variable. Similarly, the row means in
the said design are termed the main effects for levels
without regard to treatment.
68. 28-07-2021 68
Thus, through this design we can study the main effects
of treatments as well as the main effects of levels.
An additional merit of this design is that one can
examine the interaction between treatments and levels,
through which one may say whether the treatment and
levels are independent of each other or they are not so.
69. 28-07-2021 69
The following examples make clear the interaction
effect between treatments and levels. The data
obtained in case of two (2 × 2) simple factorial
studies may be as given in Fig.
72. 28-07-2021 72
All the above figures (the study I data and the study II data) represent
the respective means. Graphically, these can be represented as shown in Fig
73. 28-07-2021 73
The graph relating to Study I indicates that there is an
interaction between the treatment and the level which, in
other words, means that the treatment and the level are not
independent of each other.
The graph relating to Study II shows that there is no
interaction effect which means that treatment and level in
this study are relatively independent of each other.
74. 28-07-2021 74
QUIZ.8
An additional merit of ______________ design is that one
can examine the interaction between treatments and levels,
through which one may say whether the treatment and levels
are independent of each other or they are not so.
a. box-behken
b. equiradial
c. optimal
D. factorial
75. 28-07-2021 75
The 2 × 2 design need not be restricted in the manner as
explained above i.e., having one experimental variable
and one control variable, but it may also be of the type
having two experimental variables or two control
variables.
For example, a college teacher compared the effect of the
classsifies as well as the introduction of the new---
76. 28-07-2021 76
-----instruction technique on the learning of research
methodology.
For this purpose he conducted a study using a 2 × 2
simple factorial design. His design in the graphic form
would be as follows:
78. 28-07-2021 78
But if the teacher uses a design for comparing males and
females and the senior and junior students in the college
as they relate to the knowledge of research methodology,
in that case we will have a 2 × 2 simple factorial design
wherein both the variables are control variables as no
manipulation is involved in respect of both the variables.
79. 28-07-2021 79
Illustration 2: (4 × 3 simple factorial design).
The 4 × 3 simple factorial design will usually include four
treatments of the experimental variable and three levels of the
control variable. Graphically it may take the following form:
80. 28-07-2021 80
• This model of a simple factorial design includes four
treatments viz., A, B, C, and D of the experimental
variable and three levels viz., I, II, and III of the
control variable and has 12 different cells as shown
above.
• This shows that a 2 × 2 simple factorial design can be
generalised to any number of treatments and levels.
82. 28-07-2021 82
In such a design the means for the columns provide the
researcher with an estimate of the main effects for
treatments and the means for rows provide an estimate
of the main effects for the levels.
Such a design also enables the researcher to determine
the interaction between treatments and levels.
83. 28-07-2021 83
QUIZ.9
A _____simple factorial design can be generalised to any
number of treatments and levels.
A. 2 × 2
b. 2 × 2
c. 2 × 2
d. 2 × 2
84. 28-07-2021 84
(ii) Complex factorial designs:
Experiments with more than two factors at a time
involve the use of complex factorial designs. A design
which considers three or more independent variables
simultaneously is called a complex factorial design.
In case of three factors with one experimental---
85. 28-07-2021 85
------variable having two treatments and two control
variables, each one of which having two levels, the
design used will be termed 2 × 2 × 2 complex factorial
design which will contain a total of eight cells as shown
below in Fig.
87. 28-07-2021 87
QUIZ.10
A design which considers three or more independent
variables simultaneously is called a_________________.
a. complex mixture design.
B. complex factorial design.
c. Simple taguchi design.
d. cotter design.