
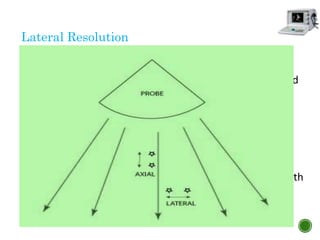
![PROBE
Consists of piezoelectric transducer
Device which converts electrical energy to sound energy
[Pulse ] and vice versa [Echo]
Basic Components –
Piezoelectric plate
Backing layer
Acoustic matching layer
Acoustic lens
INSTRUMEN
TATION](https://image.slidesharecdn.com/bikusg-160808013044/85/Ocular-Ultrasonography-Ophthalmic-Ultrasonography-Ocular-USG-Ophthalmic-USG-Ophthalmic-Ultrasound-Ocular-Ultrasound-healthkura-com-26-320.jpg)
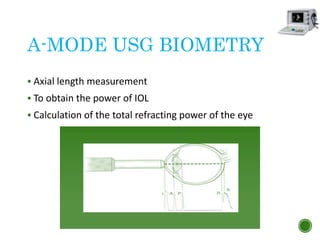


The document presents an in-depth overview of ophthalmic ultrasonography, including its historical development, principles, and clinical applications in ophthalmology. Key topics discussed include A-scan and B-scan techniques, advantages of using ultrasound in eye examinations, and the physics underlying ultrasound wave behavior. It also covers the factors influencing echo generation, various imaging techniques, and the instrumentation used, alongside indications for use and common sources of error in procedures.


