Dr. Riq Parra presents an overview of his program, Ultrashort Pulse (USP) Laser -- Matter Interactions, at the AFOSR 2013 Spring Review. At this review, Program Officers from AFOSR Technical Divisions will present briefings that highlight basic research programs beneficial to the Air Force.
The peer-reviewed International Journal of Engineering Inventions (IJEI) is started with a mission to encourage contribution to research in Science and Technology. Encourage and motivate researchers in challenging areas of Sciences and Technology.
Role of electromagnetic Radiation in Remote SensingNzar Braim
Role of electromagnetic Radiation in Remote Sensing
It should be clear by now that the electromagnetic waves are originator and
carrier of information in Earth observation. The information content of the products delivered by a given type of sensor is essentially related to the parameters, mainly frequency (or wavelength) and polarization, characterizing the observing system, including the geometry at which data are acquired. Therefore, the specifications of an EO system, which include the type of sensor, the band of operation, the observation angle, etc.
EM spectrum, or Electromagnetic spectrum is an organized representation of the EM waves, we are surrounded with, The order of the waves is arranged in accordance with the length of their wavelengths. For more information view the complete deck.
This content was presented by me in Sathayabama University, India as an Invited talk in a DBT sponsored training program which covers the generalized about the Raman Scattering technique.
Chemistry ppt on magnetic radiation and youngs experiment vishalmhaske13
the powerpoint is about electromagnetic radiation and its types and example with its configuration and also images to identify the different magnetic radiation
It also include its advantage and its disadvantages and uses.
In second topic includes youngs experiment and its uses and derivation and formula
the paper focuses on the fabrication and characterization of heterostructures using transition metal dichalcogenide (TMDC) monolayers. The authors describe the process of mechanical exfoliation to obtain thin flakes of TMDC material, which are then placed on a viscoelastic polydimethylsiloxane film. These monolayers are subsequently stamped onto a silicon wafer covered with thermal oxide to create heterobilayers .
The paper also discusses the use of ultrafast optical-pump/terahertz-probe near-field microscopy to study these heterostructures. The authors explain that this technique allows them to investigate the electric near fields and scattered fields of the emitted waveforms, as well as the photo-induced polarizability .
The experimental setup involves a high-average-power, low-noise Yb:YAG thin-disc oscillator, which generates terahertz probe pulses through optical rectification of 200-fs-long pulses. These pulses are centered at a wavelength of 1,030 nm and are generated in a gallium phosphide crystal .
The paper likely includes additional details on the experimental procedures, data analysis, and results obtained from the terahertz near-field microscopy experiments. It may also discuss the potential applications and implications of the findings
Builder.ai Founder Sachin Dev Duggal's Strategic Approach to Create an Innova...Ramesh Iyer
In today's fast-changing business world, Companies that adapt and embrace new ideas often need help to keep up with the competition. However, fostering a culture of innovation takes much work. It takes vision, leadership and willingness to take risks in the right proportion. Sachin Dev Duggal, co-founder of Builder.ai, has perfected the art of this balance, creating a company culture where creativity and growth are nurtured at each stage.
Dev Dives: Train smarter, not harder – active learning and UiPath LLMs for do...UiPathCommunity
💥 Speed, accuracy, and scaling – discover the superpowers of GenAI in action with UiPath Document Understanding and Communications Mining™:
See how to accelerate model training and optimize model performance with active learning
Learn about the latest enhancements to out-of-the-box document processing – with little to no training required
Get an exclusive demo of the new family of UiPath LLMs – GenAI models specialized for processing different types of documents and messages
This is a hands-on session specifically designed for automation developers and AI enthusiasts seeking to enhance their knowledge in leveraging the latest intelligent document processing capabilities offered by UiPath.
Speakers:
👨🏫 Andras Palfi, Senior Product Manager, UiPath
👩🏫 Lenka Dulovicova, Product Program Manager, UiPath
Accelerate your Kubernetes clusters with Varnish CachingThijs Feryn
A presentation about the usage and availability of Varnish on Kubernetes. This talk explores the capabilities of Varnish caching and shows how to use the Varnish Helm chart to deploy it to Kubernetes.
This presentation was delivered at K8SUG Singapore. See https://feryn.eu/presentations/accelerate-your-kubernetes-clusters-with-varnish-caching-k8sug-singapore-28-2024 for more details.
JMeter webinar - integration with InfluxDB and GrafanaRTTS
Watch this recorded webinar about real-time monitoring of application performance. See how to integrate Apache JMeter, the open-source leader in performance testing, with InfluxDB, the open-source time-series database, and Grafana, the open-source analytics and visualization application.
In this webinar, we will review the benefits of leveraging InfluxDB and Grafana when executing load tests and demonstrate how these tools are used to visualize performance metrics.
Length: 30 minutes
Session Overview
-------------------------------------------
During this webinar, we will cover the following topics while demonstrating the integrations of JMeter, InfluxDB and Grafana:
- What out-of-the-box solutions are available for real-time monitoring JMeter tests?
- What are the benefits of integrating InfluxDB and Grafana into the load testing stack?
- Which features are provided by Grafana?
- Demonstration of InfluxDB and Grafana using a practice web application
To view the webinar recording, go to:
https://www.rttsweb.com/jmeter-integration-webinar
Epistemic Interaction - tuning interfaces to provide information for AI supportAlan Dix
Paper presented at SYNERGY workshop at AVI 2024, Genoa, Italy. 3rd June 2024
https://alandix.com/academic/papers/synergy2024-epistemic/
As machine learning integrates deeper into human-computer interactions, the concept of epistemic interaction emerges, aiming to refine these interactions to enhance system adaptability. This approach encourages minor, intentional adjustments in user behaviour to enrich the data available for system learning. This paper introduces epistemic interaction within the context of human-system communication, illustrating how deliberate interaction design can improve system understanding and adaptation. Through concrete examples, we demonstrate the potential of epistemic interaction to significantly advance human-computer interaction by leveraging intuitive human communication strategies to inform system design and functionality, offering a novel pathway for enriching user-system engagements.
UiPath Test Automation using UiPath Test Suite series, part 3DianaGray10
Welcome to UiPath Test Automation using UiPath Test Suite series part 3. In this session, we will cover desktop automation along with UI automation.
Topics covered:
UI automation Introduction,
UI automation Sample
Desktop automation flow
Pradeep Chinnala, Senior Consultant Automation Developer @WonderBotz and UiPath MVP
Deepak Rai, Automation Practice Lead, Boundaryless Group and UiPath MVP
Neuro-symbolic is not enough, we need neuro-*semantic*Frank van Harmelen
Neuro-symbolic (NeSy) AI is on the rise. However, simply machine learning on just any symbolic structure is not sufficient to really harvest the gains of NeSy. These will only be gained when the symbolic structures have an actual semantics. I give an operational definition of semantics as “predictable inference”.
All of this illustrated with link prediction over knowledge graphs, but the argument is general.
Slack (or Teams) Automation for Bonterra Impact Management (fka Social Soluti...Jeffrey Haguewood
Sidekick Solutions uses Bonterra Impact Management (fka Social Solutions Apricot) and automation solutions to integrate data for business workflows.
We believe integration and automation are essential to user experience and the promise of efficient work through technology. Automation is the critical ingredient to realizing that full vision. We develop integration products and services for Bonterra Case Management software to support the deployment of automations for a variety of use cases.
This video focuses on the notifications, alerts, and approval requests using Slack for Bonterra Impact Management. The solutions covered in this webinar can also be deployed for Microsoft Teams.
Interested in deploying notification automations for Bonterra Impact Management? Contact us at sales@sidekicksolutionsllc.com to discuss next steps.
Elevating Tactical DDD Patterns Through Object CalisthenicsDorra BARTAGUIZ
After immersing yourself in the blue book and its red counterpart, attending DDD-focused conferences, and applying tactical patterns, you're left with a crucial question: How do I ensure my design is effective? Tactical patterns within Domain-Driven Design (DDD) serve as guiding principles for creating clear and manageable domain models. However, achieving success with these patterns requires additional guidance. Interestingly, we've observed that a set of constraints initially designed for training purposes remarkably aligns with effective pattern implementation, offering a more ‘mechanical’ approach. Let's explore together how Object Calisthenics can elevate the design of your tactical DDD patterns, offering concrete help for those venturing into DDD for the first time!
The Art of the Pitch: WordPress Relationships and SalesLaura Byrne
Clients don’t know what they don’t know. What web solutions are right for them? How does WordPress come into the picture? How do you make sure you understand scope and timeline? What do you do if sometime changes?
All these questions and more will be explored as we talk about matching clients’ needs with what your agency offers without pulling teeth or pulling your hair out. Practical tips, and strategies for successful relationship building that leads to closing the deal.
State of ICS and IoT Cyber Threat Landscape Report 2024 previewPrayukth K V
The IoT and OT threat landscape report has been prepared by the Threat Research Team at Sectrio using data from Sectrio, cyber threat intelligence farming facilities spread across over 85 cities around the world. In addition, Sectrio also runs AI-based advanced threat and payload engagement facilities that serve as sinks to attract and engage sophisticated threat actors, and newer malware including new variants and latent threats that are at an earlier stage of development.
The latest edition of the OT/ICS and IoT security Threat Landscape Report 2024 also covers:
State of global ICS asset and network exposure
Sectoral targets and attacks as well as the cost of ransom
Global APT activity, AI usage, actor and tactic profiles, and implications
Rise in volumes of AI-powered cyberattacks
Major cyber events in 2024
Malware and malicious payload trends
Cyberattack types and targets
Vulnerability exploit attempts on CVEs
Attacks on counties – USA
Expansion of bot farms – how, where, and why
In-depth analysis of the cyber threat landscape across North America, South America, Europe, APAC, and the Middle East
Why are attacks on smart factories rising?
Cyber risk predictions
Axis of attacks – Europe
Systemic attacks in the Middle East
Download the full report from here:
https://sectrio.com/resources/ot-threat-landscape-reports/sectrio-releases-ot-ics-and-iot-security-threat-landscape-report-2024/
2. first transmission through the water layer is shown with two
successive echoes. The times-of-flight are 44.19 and 44.22
s, respectively, between the first two echoes and the two
subsequent ones. The time is measured with the cross-
correlation function between echoes. The difference between
the time measurement gives the order of the experimental
errors that are mainly due to the slight shape difference of
the echoes Fig. 2 . This observation proves that there is a
transfer of energy between the time-gated microwave and
ultrasonic waves near the air–liquid interface.
B. Frequency domain
The shape of the gate that modulates the microwave was
acquired and is shown in Fig. 3 a and its spectrum in Fig.
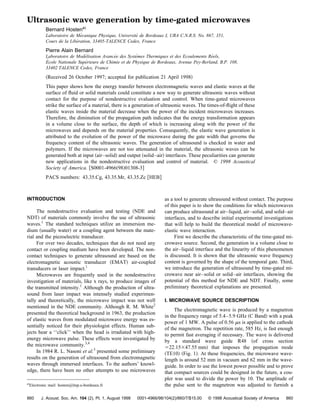
FIG. 1. Experimental arrangement to generate ultrasonic wave in water. 3 b . The bandwidth upper limit of this pulse is limited to
around 1 MHz. Figure 4 compares the frequency domain of
power at the end of the waveguide varying from 0 to 100 the first echo generated by the microwave and by the gen-
kW. Another coupler diverted a small part of this energy to a erator in the pulse-echo mode. The frequency spectrum of
milliwattmeter HP 436A in order to measure the micro- the ultrasonic wave generated by the microwave and filtered
wave power delivered at the end of the waveguide. by the transducer receiver is comprised at 6 dB between
0.1 and 0.8 MHz. Then it seems reasonable to assume that
the frequency content of the ultrasonic wave generated by
II. EXPERIMENTAL VERIFICATION OF ULTRASONIC
WAVE GENERATION the microwave source is controlled by the shape of the gate.
In the future, it will be more convenient to use a broadband
A. Generation at the air–liquid interface receiver, such as a laser probe.
Figure 1 presents the apparatus used to observe the gen-
eration of ultrasonic waves in water. Ultrasonic waves are
C. Linearity
received by an immersion transducer at a central frequency
of 1 MHz Panametrics V302 . The distance between the end Figure 5 presents the evolution of the peak amplitude of
of the microwave guide and the water surface is d2 20 mm . the first echo generated by the microwave function of the
The distance d1 33 mm is easily determined using the ul- instantaneous power of the microwave, in the range of 0 to
trasonic transducer in pulse-echo mode and measuring the 100 kW. This corresponds to a mean power of 0 to 34 W.
times-of-flight between echoes reflected by the water surface. The energy transformation between microwave and ultra-
The time-of-flight between the two first echoes is 44.35 s sound is a linear phenomenon in this energy range.
velocity in water 1.49 mm/ s at 22 °C . The amplification of the receiver was around 40 dB.
Figure 2 presents the time history of the ultrasonic wave Clearly low power sources can be used in the future to gen-
generated by the microwave at the interface air–water. The erate ultrasonic waves in liquids.
FIG. 2. Ultrasonic waves generated by
microwave at the air/water interface.
861 J. Acoust. Soc. Am., Vol. 104, No. 2, Pt. 1, August 1998 B. Hosten and P. A. Bernard: Ultrasonic wave generation 861
3. FIG. 3. a Time history of the gate. b Frequency spectrum of the gate.
D. Shift of the time-of-flight versus power III. GENERATION AT THE INTERFACE AIR–SOLID
AND SOLID–AIR
It is noticeable to consider time-of-flight as a function of
source power. This time should be around 22.1 s according A. Weakly absorbing materials
to the previous measurement. This cannot be known abso- The experimental setup Fig. 1 is slightly modified to
lutely because there is an uncertainty between the trigger investigate ultrasonic wave generation in a solid. A contact
position and the beginning of the magnetron oscillation. transducer Panametrics 101; Central frequency 0.5 MHz is
However, the waveforms at various amounts of power can be connected to the solid through a coupling medium Fig. 7 .
compared. As shown in Fig. 6, the times-of-flight decrease as The receiver is replaced by a more powerful amplifier Pana-
the power increases. If a source region between microwave metrics 5058 PR; Gain: 60 dB since the ultrasonic wave
and elastic wave is considered near the surface, one can as- amplitudes in the solid were much smaller than in water.
sume that the source region depth is increasing with power Using the pulse-echo technique, the time-of-flight for a
and the propagation distance of the ultrasonic wave is de- round trip in a block of PVC was found equal to 25.6 s.
creased. This depth can be estimated to around 370 m 0.25 This value corresponds to a thickness of 29.5 mm with a
s in water for 50 kW and is about 100 times smaller than longitudinal wave velocity of 2.3 mm/ s. Figure 8 presents
the electromagnetic wavelength. the ultrasonic echoes generated by the microwave source at a
It is important to notice that the oscilloscope was trig- power of 100 kW. Although the noise in this waveform
gered by the gate, with no variation of the trigger position. could be easily suppressed by averaging, it is presented in
However, if one expects a slight supplementary delay when this way to estimate the signal-to-noise ratio.
the power is increased, the shift would be the reverse of what The time-of-flight of the first echo U 1 is about 12 s.
it is shown in Fig. 6. This measurement is not accurate since the beginning of the
echo is not well defined, nevertheless it proves that the
FIG. 4. Modulus of the frequency spectrum. Solid line: first ultrasonic echo
generated by the microwave. Dashed line: first ultrasonic echo generated by FIG. 5. Peak amplitude of the first echo generated by the microwave versus
the generator in the pulse-echo mode. power.
862 J. Acoust. Soc. Am., Vol. 104, No. 2, Pt. 1, August 1998 B. Hosten and P. A. Bernard: Ultrasonic wave generation 862
4. FIG. 6. First echoes generated by the electromagnetic wave for various values of the electromagnetic power.
source is located near the upper surface of the plate. The sponds to an estimated source region depth of 1 mm
measurement of the delay between echoes U 1 and U 2 is (velocity 1.7 mm/ s) which is much larger than in water.
more accurate since it is possible to isolate each echo with a This must be explained by the attenuation of microwaves
temporal window and to measure the delay by a standard which is much larger in water than in PVC.
cross-correlation procedure. The result, 25.6 s, is identical
to the measure made with the pulse-echo technique. B. Reflecting materials
Another echo L 1 appears between U 1 and U 2 . The ar-
rival time of this echo, approximately 25 s, corresponds to As for optical waves, metals are almost pure reflectors
a round trip inside the plate. That means there is an impor- for electromagnetic waves. To observe the generation of ul-
tant source of ultrasonic waves located near the lower sur- trasonic waves in metal, the PVC plate was replaced by a
face. The delay 12.5 s between the echoes U 1 and L 1 is 49.3-mm-thick plate made of aluminum. The corresponding
slightly less than the time-of-flight for one trip inside the waveform is not shown here because the ultrasonic echoes
plate. Therefore the sources at upper and lower surfaces are were corrupted by in the ambient electromagnetic noise, but
located in a volume with a small thickness. The accurate with a better setup one can imagine producing ultrasonic
measurement of the source region depth must be performed waves in metals from electromagnetic waves. To enhance the
with a more precise setup since its value seems much smaller production of ultrasound, a 2-mm-thick water layer was
than in the case of water. poured on the surface. The waveform is presented in Fig. 10.
By using a more absorbing material, it is easier to reveal The ultrasound amplitude was so important that the gain of
the presence of this source region. The PVC is replaced by a the receiver was set to 0 dB. The first arrival time
1-cm-thick plate made of paraffin wax with 10% carbon ( 8.2 s) in the first echo is only slightly larger than one
powder. The waveforms, presented in Fig. 9, show the varia- trip in the aluminum plate ( 7.8 s). There is generation of
tion of the amplitude and the time-of-flight of one echo as ultrasound everywhere in the water layer and almost at the
a function of the electromagnetic wave power. As previ- water–aluminum interface.
ously, the time-of-flight is decreased when the power is
increased. The difference is the order of 1 s which corre-
FIG. 7. Experimental setup to generate and receive the ultrasonic wave in FIG. 8. Ultrasonic waves generated by microwave source at air/solid and
solid. solid/air interfaces electromagnetic power 100 kW .
863 J. Acoust. Soc. Am., Vol. 104, No. 2, Pt. 1, August 1998 B. Hosten and P. A. Bernard: Ultrasonic wave generation 863
5. FIG. 9. Ultrasonic wave generated in a plate made of paraffin wax with 10% carbon powder.
In order to explore the possible application to the in situ ii The transduction is linear and occurs in a zone near
nondestructive evaluation of metallic materials, a very thin the interface.
layer of paint was sprayed on the aluminum surface. The iii The source region depth depends on the material
gain of the receiver was again increased to 60 dB. The wave- properties and the power of the electromagnetic wave.
form in Fig. 11 shows the noise due to the electromagnetic The higher the power or the higher the absorption of
pulse and a first echo arriving at around 8 s. This result is the electromagnetic wave, the deeper the source re-
promising for NDE applications since structures are often gion. Its depth is much smaller than the penetration
painted. depth of the microwave inside the material, since the
microwave wavelength is much larger than the source
region.
IV. MODEL
Laser impacts also create elastic waves via several
To build a model for the interaction between electro- mechanisms: radiation pressure, electrostriction, Brillouin
magnetic waves and elastic waves more precise experiments scattering, and thermoelastic expansion. The latter is domi-
and investigations are necessary. However, the following ex- nant under normal circumstances. These mechanisms and
perimental considerations will be useful to develop a model: their applications are completely described in literature and
i The evolution of the electromagnetic wave power cre- textbooks.6,7 In addition, the presence of a ‘‘precursor’’ was
ates elastic waves in a frequency domain imposed by observed in laser generation and explained with one- or two-
the gate width. dimensional models,2,8,9 taking into account the presence of a
FIG. 10. Ultrasonic wave generated at the water/aluminum surface electromagnetic power 100 kW .
864 J. Acoust. Soc. Am., Vol. 104, No. 2, Pt. 1, August 1998 B. Hosten and P. A. Bernard: Ultrasonic wave generation 864
6. FIG. 11. Ultrasonic wave generated at the paint/aluminum surface electromagnetic power 100 kW .
source buried below the surface. The ‘‘precursor’’ appear- V. CONCLUSIONS
ance is equivalent to what is observed from the evolution of
This paper highlights the transformation of energy be-
times-of-flight Fig. 6 . Since the electromagnetic source is
tween electromagnetic waves and elastic waves through the
large in comparison with the ultrasonic wavelength, it is con-
surface of liquid or solid materials.
ceivable that the one-dimensional model would be
The experimental considerations lead to a one-
appropriate.2,8,9
dimensional thermoelastic model. More experiments must be
As explained in Ref. 9, a nonfocused laser source in the
conducted to link the electromagnetic and elastic material
thermoelastic regime generates two waves located at both
properties to the elastic waves characteristics. These experi-
faces of the plate. A similar analysis would be appropriate
mental observations will permit us to model the energy trans-
for a microwave source. The stress induced by a tempera-
formation in order to estimate the penetration depth, to pre-
ture rise T is given by
dict the response of any material and to consider the
u x,t applications to the nondestructive evaluation of materials.
x,t C T, 1 Ultrasonic waves can be generated at interface air–solid
x
and also solid–air. If the electromagnetic attenuation is not
where u is the normal displacement in the ultrasonic field, C too significant, the electromagnetic wave can generate ultra-
is the diagonal component of the rigidity tensor in the x sound inside the materials in a zone located near a cavity or
direction normal to the interface, and is the thermal stress a delamination. Clearly, some important applications to the
coefficient. The interfaces at x 0 and x L are stress free, nondestructive testing of material can be accomplished.
then (0,t) 0 and (L,t) 0. Equation 1 implies there is There is a very large spectrum of applications since the
a displacement gradient at x 0 and x L. Therefore, two gate width and shape of the microwave can be controlled to
waves are produced at both interfaces if the material does not produce lower frequency content. In the other way, ultra-
absorb too much of the electromagnetic energy. If the ab- sonic waves with very high frequency content can be pro-
sorption is negligible, the spatial dependence of T is weak, duced with shorter pulses and even a monocycle pulse
and the second term on the right-hand side in the wave equa- source.10
tion
2 2 ACKNOWLEDGMENTS
u x,t u x,t T
C 2 The authors gratefully acknowledge the CEL Centre
t2 x2 x
d’Essais des Landes for supplying the time-gated micro-
can be neglected and the waves are produced near the inter- wave source and the help of Bernard Desvergnes, Jean Bran-
faces. If the absorption increases, this term is responsible for dier, Jean-Claude Devant and Stephane Lallement.
the buried sources of ultrasounds and the depth of the gen-
eration zone increases. 1
Proceedings of Review of Progress in Quantitative NonDestructive Evalu-
This model seems even more appropriate for the micro- ation, edited by D. O. Thompson and D. E. Chimenti Plenum, New
waves than for the optical waves since their wavelengths are York , Vols. 1–16.
2
much larger. For instance, in this paper the microwave wave- R. M. White, ‘‘Generation of Elastic Waves by Transient Surface Heat-
ing,’’ J. Appl. Phys. 34„12…, 3559–3567 1963 .
length is larger than the thickness of the tested materials. 3
J. C. Lin, ‘‘Further Studies on the Microwaves Auditory Effect,’’ IEEE
Comparison between theory and experiment will be pre- Trans. Microwave Theory Tech. MTT-25„11…, 939–943 1977 .
4
sented in a later paper. D. Borth, ‘‘Theoretical Analysis of Acoustic Signal Generation in Mate-
865 J. Acoust. Soc. Am., Vol. 104, No. 2, Pt. 1, August 1998 B. Hosten and P. A. Bernard: Ultrasonic wave generation 865
7. rials Irradiated with Microwave Energy,’’ IEEE Trans. Microwave Theory on laser-generated ultrasound,’’ J. Acoust. Soc. Am. 88, 1494–1502
Tech. MTT-25„11…, 945–953 1977 . 1990 .
5
R. L. Nasoni, G. A. Evanoff, P. G. Halverson, and T. Bowen, ‘‘Thermoa- 9 ´
A. Henault, A. Cournoyer, F. Enguehard, and J. Bertrand, ‘‘A study of
coustic Emission by Deeply Penetrating Microwave Radiation,’’ in IEEE dynamic thermal expansion using a laser-generated ultrasound 1-d
Ultras. Symp. 1984 , pp. 633–638.
6 model,’’ Proceedings of the 9th International Conference on Photoacous-
D. A. Hutchins, ‘‘Ultrasonic generation by pulsed laser,’’ Physical Acous-
tics, edited by W. P. Mason and R. N. Thurston New York, 1988 , Vol. tic and Photothermal Phenomena, edited by S. Y. Zhang, Nanjing, China
XVIII. 1996 , pp. 370–374.
10
7
C. B. Scruby and L. E. Drain, Laser Ultrasonics Techniques and Appli- F. C. Chen and W. C. Chew, ‘‘An impulse radar nondestructive evaluation
cations Hilger, Bristol, 1990 . system,’’ in Review of Progress in QNDE Plenum, New York, 1997 ,
8
K. L. Telschow and R. J. Conant, ‘‘Optical and thermal parameter effects Vol. 16A, pp. 709–715.
866 J. Acoust. Soc. Am., Vol. 104, No. 2, Pt. 1, August 1998 B. Hosten and P. A. Bernard: Ultrasonic wave generation 866