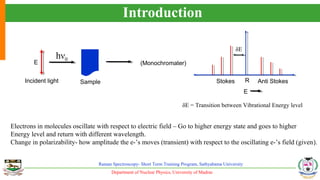
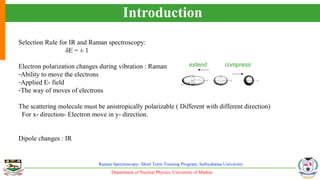
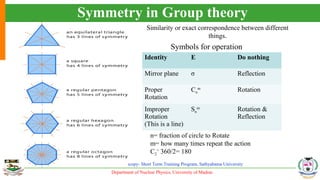
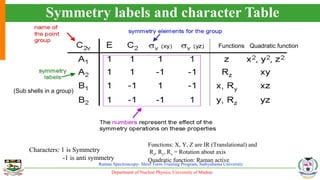
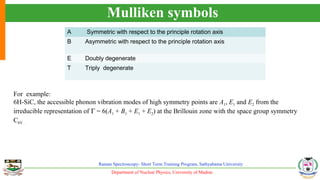
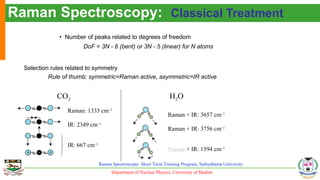
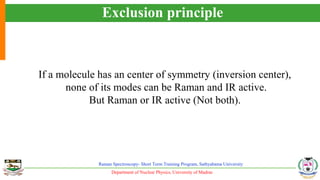
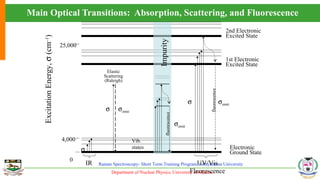
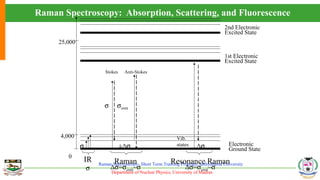
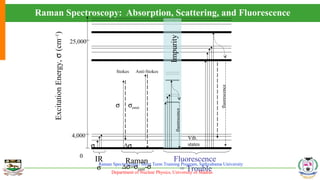
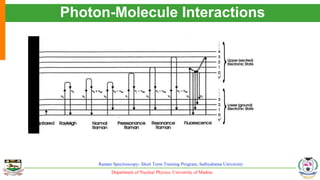
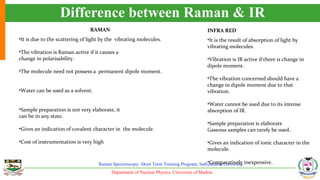
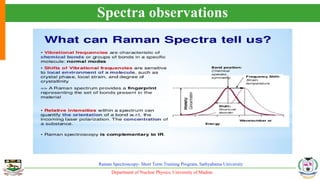
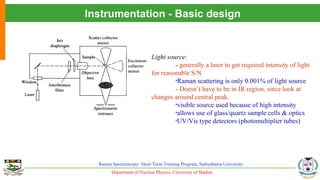
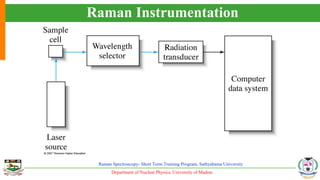
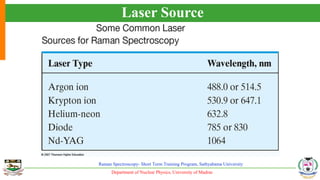
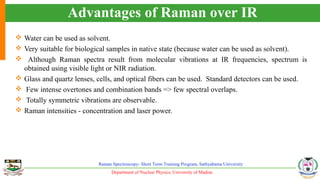
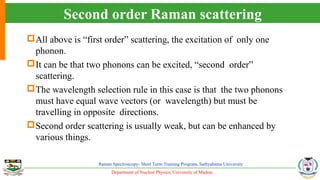
Raman Spectroscopy
(Data Analysis)
Introduction, Symmetry & Point group,
Character table, Resonance Raman,
Instrumentation and Depth profiling
K. Kamalakkannan,
University of Madras
Kamalakkannan.k.123@gmail.com
Department of Nuclear Physics, University of Madras
Raman Spectroscopy- Short Term Training Program, Sathyabama University
Introduction
 When monochromatic radiation is incident upon a sample then this light will interact with the sample in some
fashion. It may be reflected, absorbed or scattered in some manner.
 We discussing about the scattering, the species present scatter a fraction of the beam in all directions, which
gives information about molecular structure
 In 1928, the Indian physicist C. V. Raman discovered that the visible wavelength of a small fraction of the
radiation scattered by certain molecules differs from that of the incident beam and furthermore that the shifts in
wavelength depend upon the chemical structure of the molecules responsible for the scattering.
Department of Nuclear Physics, University of Madras
Raman Spectroscopy- Short Term Training Program, Sathyabama University
Introduction
Department of Nuclear Physics, University of Madras
Raman Spectroscopy- Short Term Training Program, Sathyabama University
Introduction
Raman is based on scattering. The sample is irradiated with a
coherent source, typically a laser. Most of the radiation is elastically
scattered (called the Rayleigh scatter).
A small portion is in elastically scattered (Raman scatter, composed
of Stokes and anti-Stokes portions). This latter portion is what we
are particularly interested in because it contains the information in
which we are interested.
Department of Nuclear Physics, University of Madras
Raman Spectroscopy- Short Term Training Program, Sathyabama University
Introduction
hν0
Incident light
E
Sample
(Monochromater)
E
R Anti StokesStokes
δE
δE = Transition between Vibrational Energy level
Electrons in molecules oscillate with respect to electric field – Go to higher energy state and goes to higher
Energy level and return with different wavelength.
Change in polarizability- how amplitude the e-’s moves (transient) with respect to the oscillating e-’s field (given).
Department of Nuclear Physics, University of Madras
Raman Spectroscopy- Short Term Training Program, Sathyabama University
Introduction
Selection Rule for IR and Raman spectroscopy:
δE = ± 1
Electron polarization changes during vibration : Raman
-Ability to move the electrons
-Applied E- field
-The way of moves of electrons
The scattering molecule must be anistropically polarizable ( Different with different direction)
For x- direction- Electron move in y- direction.
Dipole changes : IR
extend compress
Department of Nuclear Physics, University of Madras
Raman Spectroscopy- Short Term Training Program, Sathyabama University
Symmetry and Character Table-
Introduction
Department of Nuclear Physics, University of Madras
Raman Spectroscopy- Short Term Training Program, Sathyabama University
Symmetry in Group theory
Symbols for operation
Identity E Do nothing
Mirror plane σ Reflection
Proper
Rotation
Cn
m
Rotation
Improper
Rotation
(This is a line)
Sn
m
Rotation &
Reflection
n= fraction of circle to Rotate
m= how many times repeat the action
C2
=
360/2= 180
Similarity or exact correspondence between different
things.
Department of Nuclear Physics, University of Madras
Raman Spectroscopy- Short Term Training Program, Sathyabama University
Symmetry labels and character Table
Functions Quadratic function
(Sub shells in a group)
Characters: 1 is Symmetry
-1 is anti symmetry
Functions: X, Y, Z are IR (Translational) and
Rz, Ry, Rx = Rotation about axis
Quadratic function: Raman active
Department of Nuclear Physics, University of Madras
Raman Spectroscopy- Short Term Training Program, Sathyabama University
Mulliken symbols
A Symmetric with respect to the principle rotation axis
B Asymmetric with respect to the principle rotation axis
E Doubly degenerate
T Triply degenerate
For example:
6H-SiC, the accessible phonon vibration modes of high symmetry points are A1, E1 and E2 from the
irreducible representation of Γ = 6(A1 + B1 + E1 + E2) at the Brillouin zone with the space group symmetry
C6V .
Department of Nuclear Physics, University of Madras
Raman Spectroscopy- Short Term Training Program, Sathyabama University
Raman Spectroscopy: Classical Treatment
• Number of peaks related to degrees of freedom
DoF = 3N - 6 (bent) or 3N - 5 (linear) for N atoms
Selection rules related to symmetry
Rule of thumb: symmetric=Raman active, asymmetric=IR active
Raman: 1335 cm–1
IR: 2349 cm–1
IR: 667 cm–1
CO2
Raman + IR: 3657 cm–1
Raman + IR: 3756 cm–1
RamanRaman + IR: 1594 cm–1
H2O
Department of Nuclear Physics, University of Madras
Raman Spectroscopy- Short Term Training Program, Sathyabama University
Exclusion principle
If a molecule has an center of symmetry (inversion center),
none of its modes can be Raman and IR active.
But Raman or IR active (Not both).
Department of Nuclear Physics, University of Madras
Raman Spectroscopy- Short Term Training Program, Sathyabama University
Main Optical Transitions: Absorption, Scattering, and Fluorescence
Electronic
Ground State
1st Electronic
Excited State
ExcitationEnergy,σ(cm–1
)
Vib.
states
4,000
25,000
0
IR
2nd Electronic
Excited State
σ
σ σemit
fluorescence
Impurity
σemit
fluorescence
UV/Vis
Fluorescence
σemitσ
Elastic
Scattering
(Raleigh)
Department of Nuclear Physics, University of Madras
Raman Spectroscopy- Short Term Training Program, Sathyabama University
Raman Spectroscopy: Absorption, Scattering, and Fluorescence
Electronic
Ground State
1st Electronic
Excited State
Vib.
states
4,000
25,000
0
IR
σ
σ σemit
2nd Electronic
Excited State
Raman
∆σ=σemit–σ
σ ±∆σ ∆σ
Resonance Raman
∆σ=σemit–σ
Stokes Anti-Stokes
Department of Nuclear Physics, University of Madras
Raman Spectroscopy- Short Term Training Program, Sathyabama University
Raman Spectroscopy: Absorption, Scattering, and Fluorescence
ExcitationEnergy,σ(cm–1
)
Vib.
states
4,000
25,000
0
fluorescence
IR
σ
σ σemit
Raman
∆σ=σemit-σ
σ ∆σ
fluorescence
Impurity
Fluorescence
= Trouble
Stokes Anti-Stokes
Department of Nuclear Physics, University of Madras
Raman Spectroscopy- Short Term Training Program, Sathyabama University
Photon-Molecule Interactions
Department of Nuclear Physics, University of Madras
Raman Spectroscopy- Short Term Training Program, Sathyabama University
Fluorescence Background in Raman Scattering
Department of Nuclear Physics, University of Madras
Raman Spectroscopy- Short Term Training Program, Sathyabama University
Resonance Raman scattering
••
TTm
omoh
heele
cleco
ouup
pwwe
e
Gss
Gaal
eleini
n
tzQQ
tzuua
aipip
sscc
hh
ssG
Gaal
eleoo
uu
enen
ccee
mm



t
eteQi
gtztz
hHH
higQ
uuaa
atatm
mww
ppoo
eeoo
uuee




Hin
Hine
eaag
geew
w••

Qtz
plplSt
zQSa
auum
maae
einin
dowd
owww
•• ••
gingi
nOO
non-resonant Raman
g1
g0
Stokes
resonance
virtual level
Vis
resonant Raman
g1
g0
Stokes
electronic
resonance
virtual level
Vis
ev
Department of Nuclear Physics, University of Madras
Raman Spectroscopy- Short Term Training Program, Sathyabama University
Example: β-Carotin
•
•




Q
t
z
S
p
l
Q
t
z
S
p
l
a
a
u
u
m
m
a
a
e
e
i
n
i
n
d
o
w
d
o
w
w
w






















i
n
i
n
H
H
e
e
a
a
g
g
e
e
w
w
•
•























i
g
i
g
H
h
t
e
h
t
e
Q
Q
t
z
H
t
z
u
u
a
a
m
a
t
a
t
m
w
w
p
p
o
o
e
e
o
o
u
u
e
e
G
s
G
s
a
a
o
l
e
o
l
e
u
u
c
e
n
c
e
n
e
e
m
m
•
•
•
•
i
n
i
n
O
g
O
g
G
s
G
s
a
a
l
e
l
e
i
n
i
n
Q
t
z
Q
t
z
u
u
a
a
i
p
i
p
s
s
c
c
h
h
T
m
o
T
m
non-resonant Raman
resonance
resonant Raman
v=1 v=1
v=0 v=0
Stokes Stokes
electronic
resonance
virtual level virtual level
Vis Vis
514nm 632nm
Wavelength (nm)
Department of Nuclear Physics, University of Madras
Raman Spectroscopy- Short Term Training Program, Sathyabama University
Resonance Raman scattering
Department of Nuclear Physics, University of Madras
Raman Spectroscopy- Short Term Training Program, Sathyabama University
Raman vs Infrared Spectra
Department of Nuclear Physics, University of Madras
Raman Spectroscopy- Short Term Training Program, Sathyabama University
Difference between Raman & IR
RAMANAN
•It is due to the scattering of light by the vibrating molecules.
•The vibration is Raman active if it causes a
change in polarisability.
•The molecule need not possess a permanent dipole moment.
•Water can be used as a solvent.
•Sample preparation is not very elaborate, it
can be in any state.
•Gives an indication of covalent character in the molecule.
•Cost of instrumentation is very high
INFRA RED
•It is the result of absorption of light by
vibrating molecules.
•Vibration is IR active if there is change in
dipole moment.
•The vibration concerned should have a
change in dipole moment due to that
vibration.
•Water cannot be used due to its intense
absorption of IR.
•Sample preparation is elaborate
Gaseous samples can rarely be used.
•Gives an indication of ionic character in the
molecule.
•Comparatively inexpensive.
Department of Nuclear Physics, University of Madras
Raman Spectroscopy- Short Term Training Program, Sathyabama University
Spectra observations
Department of Nuclear Physics, University of Madras
Raman Spectroscopy- Short Term Training Program, Sathyabama University
Instrumentation - Basic design
Light source:
- generally a laser to get required intensity of light
for reasonable S/N
•Raman scattering is only 0.001% of light source
- Doesn’t have to be in IR region, since look at
changes around central peak.
•visible source used because of high intensity
•allows use of glass/quartz sample cells & optics
•UV/Vis type detectors (photomultiplier tubes)
Department of Nuclear Physics, University of Madras
Raman Spectroscopy- Short Term Training Program, Sathyabama University
Raman Instrumentation
Department of Nuclear Physics, University of Madras
Raman Spectroscopy- Short Term Training Program, Sathyabama University
Laser Source
Department of Nuclear Physics, University of Madras
Raman Spectroscopy- Short Term Training Program, Sathyabama University
Advantages of Raman over IR
 Water can be used as solvent.
 Very suitable for biological samples in native state (because water can be used as solvent).
 Although Raman spectra result from molecular vibrations at IR frequencies, spectrum is
obtained using visible light or NIR radiation.
 Glass and quartz lenses, cells, and optical fibers can be used. Standard detectors can be used.
 Few intense overtones and combination bands => few spectral overlaps.
 Totally symmetric vibrations are observable.
 Raman intensities - concentration and laser power.
Department of Nuclear Physics, University of Madras
Raman Spectroscopy- Short Term Training Program, Sathyabama University
Second order Raman scattering
All above is “first order” scattering, the excitation of only one
phonon.
It can be that two phonons can be excited, “second order”
scattering.
The wavelength selection rule in this case is that the two phonons
must have equal wave vectors (or wavelength) but must be
travelling in opposite directions.
Second order scattering is usually weak, but can be enhanced by
various things.
Department of Nuclear Physics, University of Madras
Raman Spectroscopy- Short Term Training Program, Sathyabama University
Raman spectra of nanocrystalline GaN
0 1000 2000 3000 4000
frequency, cm-1
a-GaN:O+
a-GaN:O
nx-GaN:H
nx-GaN
325 nm
OH
N
2
Si
O
order
GaN
2nd
3rd
order
Department of Nuclear Physics, University of Madras
Raman Spectroscopy- Short Term Training Program, Sathyabama University
Can be determine…..
 Structure of the crystal
 Carrier concentration by peak shift
 Depth profiling- Structure disorder in depth wise- Confocal Raman- Transparent samples
 Amorphous behavior- Peak intensity
 Defect quantification- Normalization
 Quantification of disorder- Effect of various parameter: Doping, Implantation, Radiation damage etc.,
Department of Nuclear Physics, University of Madras
Raman Spectroscopy- Short Term Training Program, Sathyabama University
Depth profiling
Optically transparent samples can be studied in the z-direction.
Therefore confocal Raman microscopy is an extremely useful technique,
because it allows nondestructive sample investigation in the third dimension
yielding subsurface information without the need of sample preparation such
as a microtome cut. By moving the laser focus in z-direction either a
complete 2D or even 3D depth profile of a structured sample.
Department of Nuclear Physics, University of Madras
Raman Spectroscopy- Short Term Training Program, Sathyabama University
Depth profiling
The confocal microscope combines focused illumination with spatially filtered
detection, to collect photons that originate from a diffraction-limited sample volume and
reject photons that originate from outside that region. This arrangement ensures that
only light coming from the focal plane entirely reaches the detector. This accounts
for the confocal Raman microprobe’s ability to discriminate between parts of the sample
that are not at the same depth, thus allowing optical sectioning.
Thank You
Department of Nuclear Physics, University of Madras
Raman Spectroscopy- Short Term Training Program, Sathyabama University
Surface-Enhanced Raman Spectroscopy (SERS)
Surface enhanced Raman spectroscopy involves obtaining Raman spectra in the
usual way on samples that are adsorbed on the surface of colloidal metal particles
(usually silver, gold, or copper) or on roughened surfaces of pieces of these metals. For
reasons that are not fully understood, the Raman lines of the adsorbed molecule are
often enhanced by a factor of 103
to 106
. When surface enhancement is combined with
the resonance enhancement technique discussed in the previous section, the net
increase in signal intensity is roughly the product of the intensity produced by each of
the techniques. Consequently, detection limits in the 10-9
to 10-12
M range have been
observed.
Department of Nuclear Physics, University of Madras
Raman Spectroscopy- Short Term Training Program, Sathyabama University
.
Probability of Emission Observed Intensity
Raleigh scattering >> Stokes >> anti-Stokes
difference in population of energy levels of vibrational transitions
Department of Nuclear Physics, University of Madras
Raman Spectroscopy- Short Term Training Program, Sathyabama University
Comparison of Raman and IR Spectra
Department of Nuclear Physics, University of Madras
Raman Spectroscopy- Short Term Training Program, Sathyabama University
Department of Nuclear Physics, University of Madras
Raman Spectroscopy- Short Term Training Program, Sathyabama University
Dispersion for InN
The vibrations are waves, labelled phonons, with wave vector
q =2 /wavelength (of the phonon)
That can range from -p/a to +p/a, a the lattice constant ≈ 0.5 nm. If
there are N ions in a unit cell then there are 3N different vibrational
modes, each with its own frequency, for each value of wave vector.
So we can draw a “dispersion curve”.
Department of Nuclear Physics, University of Madras
Raman Spectroscopy- Short Term Training Program, Sathyabama University
Dispersion for InN
The phonon “dispersion”, meaning the frequency as a function of wavelength, is usually
plotted as frequency vs (wavelength)-1, across the Brillouin zone. Then infinite
wavelength is at zero, the zone centre, commonly labeled the (gamma) point. It’s the
frequencies along the left-hand edge that have infinite wavelength.
In a perfect crystal only the zone centre phonons can be Raman active, and
usually not even all of those are.
Department of Nuclear Physics, University of Madras
Raman Spectroscopy- Short Term Training Program, Sathyabama University
Raman Spectroscopy
 1923 – Inelastic light scattering is predicted by A. Smekel
 1928 – Landsberg and Mandelstam see unexpected frequency
shifts in scattering from quartz
 1928 – C.V. Raman and K.S. Krishnan see “feeble fluorescence”
from neat solvents
 1930 –1930 – C.V. Raman wins Nobel Prize in PhysicsC.V. Raman wins Nobel Prize in Physics
 1961 – Invention of laser makes Raman experiments reasonable1961 – Invention of laser makes Raman experiments reasonable
 1977 – Surface-enhanced Raman scattering (SERS) is discovered1977 – Surface-enhanced Raman scattering (SERS) is discovered
 1997 – Single molecule SERS is possible1997 – Single molecule SERS is possible

Raman spectroscopy- General Talak

  • 1.
    Raman Spectroscopy (Data Analysis) Introduction,Symmetry & Point group, Character table, Resonance Raman, Instrumentation and Depth profiling K. Kamalakkannan, University of Madras Kamalakkannan.k.123@gmail.com
  • 2.
    Department of NuclearPhysics, University of Madras Raman Spectroscopy- Short Term Training Program, Sathyabama University Introduction  When monochromatic radiation is incident upon a sample then this light will interact with the sample in some fashion. It may be reflected, absorbed or scattered in some manner.  We discussing about the scattering, the species present scatter a fraction of the beam in all directions, which gives information about molecular structure  In 1928, the Indian physicist C. V. Raman discovered that the visible wavelength of a small fraction of the radiation scattered by certain molecules differs from that of the incident beam and furthermore that the shifts in wavelength depend upon the chemical structure of the molecules responsible for the scattering.
  • 3.
    Department of NuclearPhysics, University of Madras Raman Spectroscopy- Short Term Training Program, Sathyabama University Introduction
  • 4.
    Department of NuclearPhysics, University of Madras Raman Spectroscopy- Short Term Training Program, Sathyabama University Introduction Raman is based on scattering. The sample is irradiated with a coherent source, typically a laser. Most of the radiation is elastically scattered (called the Rayleigh scatter). A small portion is in elastically scattered (Raman scatter, composed of Stokes and anti-Stokes portions). This latter portion is what we are particularly interested in because it contains the information in which we are interested.
  • 5.
    Department of NuclearPhysics, University of Madras Raman Spectroscopy- Short Term Training Program, Sathyabama University Introduction hν0 Incident light E Sample (Monochromater) E R Anti StokesStokes δE δE = Transition between Vibrational Energy level Electrons in molecules oscillate with respect to electric field – Go to higher energy state and goes to higher Energy level and return with different wavelength. Change in polarizability- how amplitude the e-’s moves (transient) with respect to the oscillating e-’s field (given).
  • 6.
    Department of NuclearPhysics, University of Madras Raman Spectroscopy- Short Term Training Program, Sathyabama University Introduction Selection Rule for IR and Raman spectroscopy: δE = ± 1 Electron polarization changes during vibration : Raman -Ability to move the electrons -Applied E- field -The way of moves of electrons The scattering molecule must be anistropically polarizable ( Different with different direction) For x- direction- Electron move in y- direction. Dipole changes : IR extend compress
  • 7.
    Department of NuclearPhysics, University of Madras Raman Spectroscopy- Short Term Training Program, Sathyabama University Symmetry and Character Table- Introduction
  • 8.
    Department of NuclearPhysics, University of Madras Raman Spectroscopy- Short Term Training Program, Sathyabama University Symmetry in Group theory Symbols for operation Identity E Do nothing Mirror plane σ Reflection Proper Rotation Cn m Rotation Improper Rotation (This is a line) Sn m Rotation & Reflection n= fraction of circle to Rotate m= how many times repeat the action C2 = 360/2= 180 Similarity or exact correspondence between different things.
  • 9.
    Department of NuclearPhysics, University of Madras Raman Spectroscopy- Short Term Training Program, Sathyabama University Symmetry labels and character Table Functions Quadratic function (Sub shells in a group) Characters: 1 is Symmetry -1 is anti symmetry Functions: X, Y, Z are IR (Translational) and Rz, Ry, Rx = Rotation about axis Quadratic function: Raman active
  • 10.
    Department of NuclearPhysics, University of Madras Raman Spectroscopy- Short Term Training Program, Sathyabama University Mulliken symbols A Symmetric with respect to the principle rotation axis B Asymmetric with respect to the principle rotation axis E Doubly degenerate T Triply degenerate For example: 6H-SiC, the accessible phonon vibration modes of high symmetry points are A1, E1 and E2 from the irreducible representation of Γ = 6(A1 + B1 + E1 + E2) at the Brillouin zone with the space group symmetry C6V .
  • 11.
    Department of NuclearPhysics, University of Madras Raman Spectroscopy- Short Term Training Program, Sathyabama University Raman Spectroscopy: Classical Treatment • Number of peaks related to degrees of freedom DoF = 3N - 6 (bent) or 3N - 5 (linear) for N atoms Selection rules related to symmetry Rule of thumb: symmetric=Raman active, asymmetric=IR active Raman: 1335 cm–1 IR: 2349 cm–1 IR: 667 cm–1 CO2 Raman + IR: 3657 cm–1 Raman + IR: 3756 cm–1 RamanRaman + IR: 1594 cm–1 H2O
  • 12.
    Department of NuclearPhysics, University of Madras Raman Spectroscopy- Short Term Training Program, Sathyabama University Exclusion principle If a molecule has an center of symmetry (inversion center), none of its modes can be Raman and IR active. But Raman or IR active (Not both).
  • 13.
    Department of NuclearPhysics, University of Madras Raman Spectroscopy- Short Term Training Program, Sathyabama University Main Optical Transitions: Absorption, Scattering, and Fluorescence Electronic Ground State 1st Electronic Excited State ExcitationEnergy,σ(cm–1 ) Vib. states 4,000 25,000 0 IR 2nd Electronic Excited State σ σ σemit fluorescence Impurity σemit fluorescence UV/Vis Fluorescence σemitσ Elastic Scattering (Raleigh)
  • 14.
    Department of NuclearPhysics, University of Madras Raman Spectroscopy- Short Term Training Program, Sathyabama University Raman Spectroscopy: Absorption, Scattering, and Fluorescence Electronic Ground State 1st Electronic Excited State Vib. states 4,000 25,000 0 IR σ σ σemit 2nd Electronic Excited State Raman ∆σ=σemit–σ σ ±∆σ ∆σ Resonance Raman ∆σ=σemit–σ Stokes Anti-Stokes
  • 15.
    Department of NuclearPhysics, University of Madras Raman Spectroscopy- Short Term Training Program, Sathyabama University Raman Spectroscopy: Absorption, Scattering, and Fluorescence ExcitationEnergy,σ(cm–1 ) Vib. states 4,000 25,000 0 fluorescence IR σ σ σemit Raman ∆σ=σemit-σ σ ∆σ fluorescence Impurity Fluorescence = Trouble Stokes Anti-Stokes
  • 16.
    Department of NuclearPhysics, University of Madras Raman Spectroscopy- Short Term Training Program, Sathyabama University Photon-Molecule Interactions
  • 17.
    Department of NuclearPhysics, University of Madras Raman Spectroscopy- Short Term Training Program, Sathyabama University Fluorescence Background in Raman Scattering
  • 18.
    Department of NuclearPhysics, University of Madras Raman Spectroscopy- Short Term Training Program, Sathyabama University Resonance Raman scattering •• TTm omoh heele cleco ouup pwwe e Gss Gaal eleini n tzQQ tzuua aipip sscc hh ssG Gaal eleoo uu enen ccee mm    t eteQi gtztz hHH higQ uuaa atatm mww ppoo eeoo uuee     Hin Hine eaag geew w••  Qtz plplSt zQSa auum maae einin dowd owww •• •• gingi nOO non-resonant Raman g1 g0 Stokes resonance virtual level Vis resonant Raman g1 g0 Stokes electronic resonance virtual level Vis ev
  • 19.
    Department of NuclearPhysics, University of Madras Raman Spectroscopy- Short Term Training Program, Sathyabama University Example: β-Carotin • •     Q t z S p l Q t z S p l a a u u m m a a e e i n i n d o w d o w w w                       i n i n H H e e a a g g e e w w • •                        i g i g H h t e h t e Q Q t z H t z u u a a m a t a t m w w p p o o e e o o u u e e G s G s a a o l e o l e u u c e n c e n e e m m • • • • i n i n O g O g G s G s a a l e l e i n i n Q t z Q t z u u a a i p i p s s c c h h T m o T m non-resonant Raman resonance resonant Raman v=1 v=1 v=0 v=0 Stokes Stokes electronic resonance virtual level virtual level Vis Vis 514nm 632nm Wavelength (nm)
  • 20.
    Department of NuclearPhysics, University of Madras Raman Spectroscopy- Short Term Training Program, Sathyabama University Resonance Raman scattering
  • 21.
    Department of NuclearPhysics, University of Madras Raman Spectroscopy- Short Term Training Program, Sathyabama University Raman vs Infrared Spectra
  • 22.
    Department of NuclearPhysics, University of Madras Raman Spectroscopy- Short Term Training Program, Sathyabama University Difference between Raman & IR RAMANAN •It is due to the scattering of light by the vibrating molecules. •The vibration is Raman active if it causes a change in polarisability. •The molecule need not possess a permanent dipole moment. •Water can be used as a solvent. •Sample preparation is not very elaborate, it can be in any state. •Gives an indication of covalent character in the molecule. •Cost of instrumentation is very high INFRA RED •It is the result of absorption of light by vibrating molecules. •Vibration is IR active if there is change in dipole moment. •The vibration concerned should have a change in dipole moment due to that vibration. •Water cannot be used due to its intense absorption of IR. •Sample preparation is elaborate Gaseous samples can rarely be used. •Gives an indication of ionic character in the molecule. •Comparatively inexpensive.
  • 23.
    Department of NuclearPhysics, University of Madras Raman Spectroscopy- Short Term Training Program, Sathyabama University Spectra observations
  • 24.
    Department of NuclearPhysics, University of Madras Raman Spectroscopy- Short Term Training Program, Sathyabama University Instrumentation - Basic design Light source: - generally a laser to get required intensity of light for reasonable S/N •Raman scattering is only 0.001% of light source - Doesn’t have to be in IR region, since look at changes around central peak. •visible source used because of high intensity •allows use of glass/quartz sample cells & optics •UV/Vis type detectors (photomultiplier tubes)
  • 25.
    Department of NuclearPhysics, University of Madras Raman Spectroscopy- Short Term Training Program, Sathyabama University Raman Instrumentation
  • 26.
    Department of NuclearPhysics, University of Madras Raman Spectroscopy- Short Term Training Program, Sathyabama University Laser Source
  • 27.
    Department of NuclearPhysics, University of Madras Raman Spectroscopy- Short Term Training Program, Sathyabama University Advantages of Raman over IR  Water can be used as solvent.  Very suitable for biological samples in native state (because water can be used as solvent).  Although Raman spectra result from molecular vibrations at IR frequencies, spectrum is obtained using visible light or NIR radiation.  Glass and quartz lenses, cells, and optical fibers can be used. Standard detectors can be used.  Few intense overtones and combination bands => few spectral overlaps.  Totally symmetric vibrations are observable.  Raman intensities - concentration and laser power.
  • 28.
    Department of NuclearPhysics, University of Madras Raman Spectroscopy- Short Term Training Program, Sathyabama University Second order Raman scattering All above is “first order” scattering, the excitation of only one phonon. It can be that two phonons can be excited, “second order” scattering. The wavelength selection rule in this case is that the two phonons must have equal wave vectors (or wavelength) but must be travelling in opposite directions. Second order scattering is usually weak, but can be enhanced by various things.
  • 29.
    Department of NuclearPhysics, University of Madras Raman Spectroscopy- Short Term Training Program, Sathyabama University Raman spectra of nanocrystalline GaN 0 1000 2000 3000 4000 frequency, cm-1 a-GaN:O+ a-GaN:O nx-GaN:H nx-GaN 325 nm OH N 2 Si O order GaN 2nd 3rd order
  • 30.
    Department of NuclearPhysics, University of Madras Raman Spectroscopy- Short Term Training Program, Sathyabama University Can be determine…..  Structure of the crystal  Carrier concentration by peak shift  Depth profiling- Structure disorder in depth wise- Confocal Raman- Transparent samples  Amorphous behavior- Peak intensity  Defect quantification- Normalization  Quantification of disorder- Effect of various parameter: Doping, Implantation, Radiation damage etc.,
  • 31.
    Department of NuclearPhysics, University of Madras Raman Spectroscopy- Short Term Training Program, Sathyabama University Depth profiling Optically transparent samples can be studied in the z-direction. Therefore confocal Raman microscopy is an extremely useful technique, because it allows nondestructive sample investigation in the third dimension yielding subsurface information without the need of sample preparation such as a microtome cut. By moving the laser focus in z-direction either a complete 2D or even 3D depth profile of a structured sample.
  • 32.
    Department of NuclearPhysics, University of Madras Raman Spectroscopy- Short Term Training Program, Sathyabama University Depth profiling The confocal microscope combines focused illumination with spatially filtered detection, to collect photons that originate from a diffraction-limited sample volume and reject photons that originate from outside that region. This arrangement ensures that only light coming from the focal plane entirely reaches the detector. This accounts for the confocal Raman microprobe’s ability to discriminate between parts of the sample that are not at the same depth, thus allowing optical sectioning.
  • 33.
  • 34.
    Department of NuclearPhysics, University of Madras Raman Spectroscopy- Short Term Training Program, Sathyabama University Surface-Enhanced Raman Spectroscopy (SERS) Surface-Enhanced Raman Spectroscopy (SERS) Surface enhanced Raman spectroscopy involves obtaining Raman spectra in the usual way on samples that are adsorbed on the surface of colloidal metal particles (usually silver, gold, or copper) or on roughened surfaces of pieces of these metals. For reasons that are not fully understood, the Raman lines of the adsorbed molecule are often enhanced by a factor of 103 to 106 . When surface enhancement is combined with the resonance enhancement technique discussed in the previous section, the net increase in signal intensity is roughly the product of the intensity produced by each of the techniques. Consequently, detection limits in the 10-9 to 10-12 M range have been observed.
  • 35.
    Department of NuclearPhysics, University of Madras Raman Spectroscopy- Short Term Training Program, Sathyabama University . Probability of Emission Observed Intensity Raleigh scattering >> Stokes >> anti-Stokes difference in population of energy levels of vibrational transitions
  • 36.
    Department of NuclearPhysics, University of Madras Raman Spectroscopy- Short Term Training Program, Sathyabama University Comparison of Raman and IR Spectra
  • 37.
    Department of NuclearPhysics, University of Madras Raman Spectroscopy- Short Term Training Program, Sathyabama University
  • 38.
    Department of NuclearPhysics, University of Madras Raman Spectroscopy- Short Term Training Program, Sathyabama University Dispersion for InN The vibrations are waves, labelled phonons, with wave vector q =2 /wavelength (of the phonon) That can range from -p/a to +p/a, a the lattice constant ≈ 0.5 nm. If there are N ions in a unit cell then there are 3N different vibrational modes, each with its own frequency, for each value of wave vector. So we can draw a “dispersion curve”.
  • 39.
    Department of NuclearPhysics, University of Madras Raman Spectroscopy- Short Term Training Program, Sathyabama University Dispersion for InN The phonon “dispersion”, meaning the frequency as a function of wavelength, is usually plotted as frequency vs (wavelength)-1, across the Brillouin zone. Then infinite wavelength is at zero, the zone centre, commonly labeled the (gamma) point. It’s the frequencies along the left-hand edge that have infinite wavelength. In a perfect crystal only the zone centre phonons can be Raman active, and usually not even all of those are.
  • 40.
    Department of NuclearPhysics, University of Madras Raman Spectroscopy- Short Term Training Program, Sathyabama University Raman Spectroscopy  1923 – Inelastic light scattering is predicted by A. Smekel  1928 – Landsberg and Mandelstam see unexpected frequency shifts in scattering from quartz  1928 – C.V. Raman and K.S. Krishnan see “feeble fluorescence” from neat solvents  1930 –1930 – C.V. Raman wins Nobel Prize in PhysicsC.V. Raman wins Nobel Prize in Physics  1961 – Invention of laser makes Raman experiments reasonable1961 – Invention of laser makes Raman experiments reasonable  1977 – Surface-enhanced Raman scattering (SERS) is discovered1977 – Surface-enhanced Raman scattering (SERS) is discovered  1997 – Single molecule SERS is possible1997 – Single molecule SERS is possible

Editor's Notes