
Recommended
More Related Content
What's hot
What's hot (19)
Viewers also liked
Viewers also liked (20)
Similar to TSNDRA-2016-All-Hazard-Summary
Similar to TSNDRA-2016-All-Hazard-Summary (20)
TSNDRA-2016-All-Hazard-Summary
- 1. 2016 Tasmanian State Natural Disaster Risk Assessment: All Hazard Summary
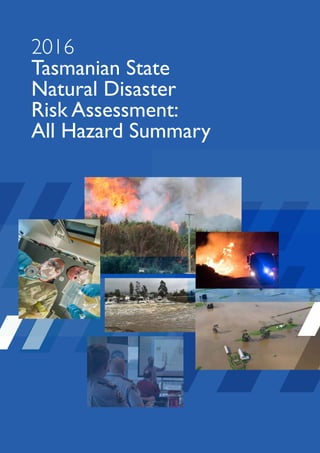
- 2. PARTNERS: SUPPORT: Cover Images, from left: Richard Bugg, Ambulance Tasmania. Department of Police, Fire & Emergency Management. Warren Frey, Tasmania Fire Service. Nigel King, Tasmania State Emergency Service. Department of Police, Fire & Emergency Management. David Reilly, ACE CRC.
- 3. Disclaimer This report was produced by the University of Tasmania in partnership with the Antarctic Climate & Ecosystems Cooperative Research Centre and RMIT University (“Contributors”). It was supported by the Tasmanian Government and the Australian Government, with funding provided under the National Partnership Agreement on Natural Disaster Resilience. This report contains the views of a wide range of stakeholders engaged as part of the risk assessment process. The views expressed are the responsibility of the University of Tasmania and are not necessarily those of the Australian Government, Tasmanian Government or other organisations that participated in the development of this report. This is research work, and as such there is potential for uncertainties in what has been presented. While every effort has been made to ensure that the material in the report is accurate, the Contributors provide no warranty, guarantee or representation that the material is accurate, complete, up to date, non-infringing or fit for a particular purpose. The use of this material is at the risk of the user. This report does not bind and organisation to any specific course of action or policy. Copyright This publication has used works provided by Australian Government Attorney-General’s Department from the publications National Emergency Risk Assessment Guidelines Handbook 10 and National Emergency Risk Assessment Guidelines Handbook 11. © Commonwealth of Australia, through the Australian Government Attorney-General’s Department, reproduced under Creative Commons Attribution 3.0 Australian Licence. The Commonwealth of Australia owns the copyright in all material produced by the Attorney-General’s Department. All material which has been sourced from these works is provided under a Creative Commons Attribution 3.0 Australian licence, with the exception of: • The Commonwealth Coat of Arms; • The Attorney-General Department’s logo; • Material specifically not provided under a Creative Commons Attribution 3.0 Australian licence; • Content supplied by third parties The details of the relevant licence conditions are available on the Creative Commons website, as is the full legal code for the CC BY 3.0 AU licence. Creative Commons Licence The University of Tasmania owns the copyright material produced in this document (except for any other copyrighted work which has been reproduced under a licence). The University grants a Creative Commons Attribution 4.0 BY licence with the exclusion of any content supplied by third parties. The details of the relevant licence conditions are available on the Creative Commons website, as is the full legal code for the CC BY 4.0. ISBN (print): 978-1-86295-858-6 ISBN (electronic): 978-2-86295-859-3 Authors: Christopher J White, Tomas Remenyi, Darryn McEvoy, Alexei Trundle and Stuart P Corney Contact: School of Engineering & ICT, Private Bag 65, Hobart, Tasmania, 7001 Tel: +61 3 6226 2135 Recommended citation: White CJ, Remenyi T, McEvoy D, Trundle A and Corney SP 2016, 2016 Tasmanian State Natural Disaster Risk Assessment: All Hazard Summary, University of Tasmania, Hobart. 2016 Tasmanian State Natural Disaster Risk Assessment / All Hazard Summary i
- 4. Image: Department of Police, Fire and Emergency Management
- 5. Executive summary This report will help the Tasmanian community be better prepared for, respond to and recover from natural disasters through an updated understanding and awareness of the natural hazards that have the most potential to impact the State. The information contained in this summary report, together with the risk register and risk treatment options provided in the accompanying risk assessment report, can be used by stakeholders and practitioners throughout the emergency management sector to inform emergency management planning. This report assesses the State level risks posed by Bushfire, Flood, Severe Storm, Landslide, Tsunami, Earthquake, Heatwave, Coastal Inundation and Pandemic Influenza ‘by sector’. Bushfire remains the greatest aggregated risk to Tasmania. It is a ‘High’ or ‘Extreme’ risk across all sectors of society, often with catastrophic consequences expected every 30 years (i.e. ‘Unlikely’ likelihood). This likelihood is expected to become more frequent with climate change. Land-use planning and building systems are strong and effective controls for each of the hazards apart from Pandemic Influenza. Limiting future development and vulnerability in known ‘at risk’ areas is considered to be the most effectve way of protecting life and property while limiting future government liability. A ‘multi-hazards’ approach to exercises and business continuity planning within government was agreed to be an important treatment option, with hazard-specific training recommended for key incident management personnel (e.g. incident controllers) as well as formalising the arrangements to guide decision-makers in times of crisis to ensure rapid decision. Executive summary 2016 Tasmanian State Natural Disaster Risk Assessment / All Hazard Summary / Executive summary iii
- 6. Contents 1 Introduction 1 1.1 Overview 2 1.2 What are Tasmania’s priority hazards? 2 2 Hazard summaries by sector 3 2.1 Summary of Tasmania’s natural disaster risks 4 2.2 All hazard comparison 4 2.3 Additional findings 6 2.3.1 Common issues and themes 6 2.3.2 A note on vulnerable populations 7 2.4 Impact of all hazards on each sector 8 2.4.1 People 8 2.4.2 Economic 11 2.4.3 Environment 14 2.4.4 Public Administration 17 2.4.5 Social Setting 19 3 Comparison with TSNDRA 2012 22 3.1 Participants 23 3.2 Figures interpretation guide 23 3.3 All hazards comparison with TSNDRA 2012 23 3.3.1 People 23 3.3.2 Economic 26 3.3.3 Environment 28 3.3.4 Public Administration 30 3.3.5 Social Setting 32 4 Conclusions 34 References 36 iv 2016 Tasmanian State Natural Disaster Risk Assessment / All Hazard Summary / Contents Contents
- 7. Section One Introduction1 Image: Chris White, University of Tasmania
- 8. 1.1 Overview This report is the all hazard summary of the 2016 Tasmanian State Natural Disaster Risk Assessment (TSNDRA 2016) report that was completed in alignment with both the Australian National Strategy for Disaster Resilience 2011 and with the Tasmania State Emergency Management Committee Strategic Directions Framework 2013. Whilst the TSNDRA 2016 report presented results ‘by hazard’ (comparing how each sector is affected by a single hazard), this summary report provides an opportunity to present the results ‘by sector’ (comparing the risk of each hazard to a single sector). This responds to the diverse needs of the community when using these results. This summary report also presents the 2016 results in comparison to those from the TSNDRA 2012, providing an opportunity to describe how the understanding and awareness of natural hazard risks affecting Tasmania may have changed through time. The main aim of this summary report is to help the Tasmanian community to be better prepared for, respond to and recover from natural disasters through an updated understanding and awareness of the natural disasters that have the most potential to impact the State. 1.2 What are Tasmania’s priority hazards? Natural disasters are defined by the Council of Australian Governments (COAG) as being: “...caused by the impact of a naturally-occurring rapid onset event that threatens or causes death, injury or damage to property or the environment and which requires significant and coordinated multi-agency and community response” This report assesses the state-level risks posed by Bushfire, Flood, Severe Storm, Landslide, Tsunami, Earthquake, Heatwave, Coastal Inundation and Pandemic Influenza. These natural hazards are considered a priority for Tasmania because they have the most potential to cause significant impacts for the State. This is supported by the historical events that are reviewed in the individual hazard summaries provided in the TSNDRA 2016 report. 1 Introduction 2 2016 Tasmanian State Natural Disaster Risk Assessment / All Hazard Summary / Introduction Section One Introduction
- 9. Section Two Hazard summaries by sector 2 Image: Tasmania State Emergency Service
- 10. 2016 2012 Maximum Risk Level: Extreme Extreme* Maximum Consequence: Catastrophic Catastrophic* Maximum Likelihood: Almost Certain Likely* Average Confidence: High N/A^ * The 2012 values have been re-calibrated following changes in methodology under NERAG 2015 ^ No average confidence values were provided inTSNDRA 2012 2.1 Summary of Tasmania’s natural disaster risks The TSNDRA 2016 reassessed the risk of bushfire, earthquake, flood, landslide, severe storm and tsunami and incorporated the first assessments of coastal inundation, heatwave and pandemic influenza. The relative likelihood and consequence each of these hazards would have on various sectors of society in a worst-case scenario were assessed. The sectors (and sub-sectors) were: People (Death; Injury); Economy (General; Industry); Environment (Species; Value); Public Administration; Social (Community Wellbeing; Cultural Significance). The overall findings of the risk assessment process and the regular themes identified across all hazards are summarised below. 2.2 All hazard comparison Although each hazard presents its own unique profile of risks to the State, an overall assessment and comparison of the total perceived risk from each hazard was requested from the stakeholders and practitioners throughout the emergency management sector. Bushfire remains the greatest aggregated risk to Tasmania. It is a ‘High’ or ‘Extreme’ risk across all sectors of society, often with catastrophic consequences expected every 30 years (i.e. ‘Unlikely’ likelihood). This likelihood is expected to become more frequent with climate change, based on anecdotal evidence from experts and the most recent climate projections1 2 , transitioning at least into the ‘Likely’ category by 2100 (and possibly into ‘Almost Certain’). Earthquake is the lowest risk hazard due to the ‘Extremely Rare’ likelihood and the ‘Moderate’ level consequences across the sectors, given the anticipated magnitude of an event. The major/catastrophic impacts are dependent on an earthquake-induced major dam failure that was deemed by experts even less likely than the earthquake itself. Interestingly, participants perceived that if the seismic monitoring system throughout Tasmania were decommissioned, all consequence and likelihood estimates would be substantially increased due to increased uncertainty in the knowledge of the hazard. It was identified that the seismic monitoring system is in urgent need of review and management as it is mostly operated by the private sector with no obligation to continue. This system ensures high confidence surrounding the likelihood of geological events, and the absence of this system would increase the risk level and priority of treatments for these hazards in future risk assessments. 2 Hazard summaries by sector 4 2016 Tasmanian State Natural Disaster Risk Assessment / All Hazard Summary / Hazard summaries by sector Section Two Hazard summaries by sector
- 11. An overall summary of the risk estimated for each hazard was requested and is presented in Figure 2.1. The overall average positions within the risk matrix do not reflect the most operationally important components of the risk profile across the hazards and within each sector. The range of risk as presented in this aggregated way is often so wide it is no longer useful for decision-making. Overall assessments require reference to a particular sector to provide context and, therefore, the remainder of the findings are presented by sector. Figure 2.1 Summary of the risk posed by each hazard as assessed in the TSNDRA 2016. The central position is the average across sectors for both consequence and likelihood. The whiskers represent the minimum and maximum ratings across all sectors for each hazard. Average Risk of Each Hazard Insignificant Minor Moderate Major Catastrophic Consequence Extremely Rare Very Rare Rare Unlikely Likely Almost Certain Likelihood B H S F T C E L P Risk Level Very Low Low Medium High Extreme Results Range Hazard Bushfire (B) Coastal Inundation (C) Earthquake (E) Flood (F) Heatwave (H) Landslide (L) Pandemic (P) Severe Storm (S) Tsunami (T) 2016 Tasmanian State Natural Disaster Risk Assessment / All Hazard Summary / Hazard summaries by sector 5 Section Two Hazard summaries by sector
- 12. 2.3 Additional findings 2.3.1 Common issues and themes During data collection, the integration of expertise and confidence into a single value of ‘Confidence’ was limiting. In some cases, experts in the field can be certain of a ‘Very Low Confidence’ rating due to either a lack of knowledge, or an understanding of complexities. Similarly, those with limited knowledge can be unaware of complexities and overestimate their confidence. This was identified as a limitation of the NERAG process. It is recommended future iterations explicitly rate the expertise of different working groups separate to confidence. With respect to controls, land-use planning, building codes/controls and settlement planning schemes/codes were identified as strong and effective controls for each of the hazards apart from pandemic influenza. Limiting future development and vulnerable uses in known at-risk areas is considered to be the most effective way of protecting life and assets and limiting future government liability at least cost. With respect to treatments, a ‘multi-hazards’ approach to exercises and business continuity planning within government was agreed to be important, with hazard-specific training recommended for key incident management personnel (e.g. incident controllers) as well as formalising the arrangements to guide decision-makers in times of crisis to ensure rapid decision. Governments typically make decisions slowly following lots of expert advice. During times of crisis, decisions need to be made quickly and decision-makers may struggle to commit to a decision. Programs that may encourage or support similar activities within the private sector were also mentioned. A multi-hazards approach to household prevention and mitigation, preparedness, response and recovery (PPRR) was also identified as a potential new treatment, such as a ‘hazard response plan’ rather than a specific household plan for each kind of hazard. Complementary to the multi-hazards approach, the frequency and severity of coincident events was identified as a knowledge gap, with broad support for further research in this area across all hazards. It was identified that hazard events do sometimes co-occur, stretching emergency response capacity statewide. Some hazards, such as heatwave and bushfire, are likely to co-occur, but this is not currently incorporated into the exercise scenarios. However, others such as bushfire and flood (as experienced in January 2016) are less obvious, with the expected likelihood of such an occurrence poorly understood, especially under the influence of climate change. It was recognised coincident events should be incorporated into the cross-agency exercise regime to ensure statewide capacity is regularly assessed under different situations to identify areas for improvement. It was noted that environmental damage from natural hazards can be substantial and control activities should consider the opportunities for maintaining a robust ecosystem, spatially distributed, which is capable of withstanding shocks. This may involve improved protection of existing forest, or active regeneration of targeted areas to improve spatial coverage of a particular kind of habitat. 6 2016 Tasmanian State Natural Disaster Risk Assessment / All Hazard Summary / Hazard summaries by sector Section Two Hazard summaries by sector
- 13. 2.3.2 A note on vulnerable populations The emergency risk management sector has traditionally approached the identification of population vulnerability from a demographic perspective, using data that reveals those most likely to suffer poorer health outcomes relative to other population groups in the wake of a disaster. These data suggest groups such as the elderly, young people, those from low socio-economic backgrounds and those with chronic health conditions are more likely to be over-represented in mortality rates and experience greater negative impact as a result of a natural disaster. While this definition is simple in approach and based on evidence, it does not necessarily capture the full picture of population vulnerability. Everyone has the potential to be vulnerable in particular circumstances and, conversely, individuals from identified vulnerable population groups can be particularly resilient. For example, an otherwise healthy individual may become vulnerable in a bushfire as they remain in danger to protect livestock and infrastructure, while an elderly individual may use their strong existing networks within the community to assist them. Alongside the recognition of identified vulnerable groups, an individual’s adaptive capacities also need to be considered. Overall health and wellbeing, the strength of connections and networks, the ability to recover with financial security, and the knowledge of how to make informed decisions all contribute to an individual’s vulnerability in preparedness (as well as recovery) from a disaster. Vulnerability and resilience are driven by context rather than definition, and are fluid and complex concepts. Agencies working in emergency management need to be aware of these issues and adapt strategies accordingly. 2016 Tasmanian State Natural Disaster Risk Assessment / All Hazard Summary / Hazard summaries by sector 7 Section Two Hazard summaries by sector
- 14. 2.4 Impact of all hazards on each sector 2.4.1 People The risk of each hazard to the sub-sectors of ‘People – Deaths’ and ‘People – Injury’ are presented in Figures 2.2 and 2.3. The highest risk hazards to people are pandemic influenza, heatwave and bushfire respectively. Seasonal influenza is a contributing factor to more than 50 deaths a year, which are routinely managed within the day-to-day capacity of the State’s health system. A pandemic influenza would be expected to increase mortality and morbidity rates to between 500 to 5,000 cases. Based on the experience of the relatively mild 2009 H1N1 pandemic influenza, it is very likely it would be a significant challenge for the health system to manage a future pandemic of similar or greater clinical severity. Similarly, heatwave has been linked to greater demand on health resources (including increased ambulance callouts) and increased morbidity and mortality in other jurisdictions. Known as the ‘silent killer’, heatwave lacks the visible cues of other hazards, which limits the public awareness around heatwave risks for both when and how individuals can or should take steps to manage themselves. Furthermore, extreme heat specifically impacts the elderly, those from low socio-economic groups and those with existing chronic conditions, populations that are over-represented in the Tasmanian community when compared to other jurisdictions. This increases the exposure of Tasmanians to heatwave hazards and the impact of the hazard. Bushfire is a highly visible, provocative hazard that has been well studied, with dedicated public awareness campaigns across the PPRR spectrum that experts believe are empowering Tasmanians to make good decisions when faced with the threat. In decreasing likelihood, landslide (debris flow), flood (major dam failure) and tsunami were all also identified as ‘Catastrophic’ risks to people. All occur rapidly within tightly constrained areas and with limited capacity for authorities to provide sufficient warnings. However, as the area affected would be constrained, it is possible for individuals to escape the hazard during the event. Storm, coastal inundation and earthquake were each assessed on the basis that some people may inadvertently put themselves in harm’s way, or that a certain level of death or severe injury cannot be avoided during dangerous situations associated with these events. 8 2016 Tasmanian State Natural Disaster Risk Assessment / All Hazard Summary / Hazard summaries by sector Section Two Hazard summaries by sector
- 15. Figure 2.2 The risk of each natural hazard to the sub-sector People – Deaths. The central position is the average across sectors for both consequence and likelihood. The whiskers represent the minimum and maximum ratings across all sectors for each hazard. People Deaths Risk of Each Hazard Insignificant Minor Moderate Major Catastrophic Consequence Extremely Rare Very Rare Rare Unlikely Likely Almost Certain Likelihood B HS F T C E L P Risk Level Very Low Low Medium High Extreme Results Range Hazard Bushfire (B) Coastal Inundation (C) Earthquake (E) Flood (F) Heatwave (H) Landslide (L) Pandemic (P) Severe Storm (S) Tsunami (T) 2016 Tasmanian State Natural Disaster Risk Assessment / All Hazard Summary / Hazard summaries by sector 9 Section Two Hazard summaries by sector
- 16. Figure 2.3 The risk of each natural hazard to the sub-sector People – Injury. The central position is the average across sectors for both consequence and likelihood. The whiskers represent the minimum and maximum ratings across all sectors for each hazard. People Injury Risk of Each Hazard Insignificant Minor Moderate Major Catastrophic Consequence Extremely Rare Very Rare Rare Unlikely Likely Almost Certain Likelihood B HS F T C E L P Risk Level Very Low Low Medium High Extreme Results Range Hazard Bushfire (B) Coastal Inundation (C) Earthquake (E) Flood (F) Heatwave (H) Landslide (L) Pandemic (P) Severe Storm (S) Tsunami (T) 10 2016 Tasmanian State Natural Disaster Risk Assessment / All Hazard Summary / Hazard summaries by sector Section Two Hazard summaries by sector
- 17. 2.4.2 Economic The risk of each hazard to the sub-sectors of ‘Economic – General’ and ‘Economic – Industry’ are presented in Figures 2.4 and 2.5. In general, the economy is expected to experience ‘Catastrophic’ losses by bushfire, tsunami and earthquake, although with very different likelihoods. Coastal inundation and flood were deemed to have ‘Major’ to ‘Catastrophic’ consequences mostly related to loss of infrastructure. Severe storm and heatwave were expected to have ‘Moderate’ to ‘Major’ impacts on agricultural yields or quality, while landslide was expected to have highly localised impacts on infrastructure. Pandemic influenza was expected to impact workers’ productivity through protracted periods of greater than normal absenteeism. Bushfires, floods and severe storms were all identified as ‘High’ or ‘Extreme’ risks to industries statewide. Tasmania’s economy can be significantly impacted by natural hazards. It was identified that some of the large resource or agricultural industries are unlikely to recover if negatively impacted by environmental hazards, choosing to cease operations in Tasmania. 2016 Tasmanian State Natural Disaster Risk Assessment / All Hazard Summary / Hazard summaries by sector 11 Section Two Hazard summaries by sector
- 18. Figure 2.4 The risk of each natural hazard to the sub-sector Economic – General. The central position is the average across sectors for both consequence and likelihood. The whiskers represent the minimum and maximum ratings across all sectors for each hazard. Economic General Risk of Each Hazard Insignificant Minor Moderate Major Catastrophic Consequence Extremely Rare Very Rare Rare Unlikely Likely Almost Certain Likelihood B H S F T C E L P Risk Level Very Low Low Medium High Extreme Results Range Hazard Bushfire (B) Coastal Inundation (C) Earthquake (E) Flood (F) Heatwave (H) Landslide (L) Pandemic (P) Severe Storm (S) Tsunami (T) 12 2016 Tasmanian State Natural Disaster Risk Assessment / All Hazard Summary / Hazard summaries by sector Section Two Hazard summaries by sector
- 19. Figure 2.5 The risk of each natural hazard to the sub-sector Economic – Industry. The central position is the average across sectors for both consequence and likelihood. The whiskers represent the minimum and maximum ratings across all sectors for each hazard. Economic Industry Risk of Each Hazard Insignificant Minor Moderate Major Catastrophic Consequence Extremely Rare Very Rare Rare Unlikely Likely Almost Certain Likelihood B H S F T C E L P Risk Level Very Low Low Medium High Extreme Results Range Hazard Bushfire (B) Coastal Inundation (C) Earthquake (E) Flood (F) Heatwave (H) Landslide (L) Pandemic (P) Severe Storm (S) Tsunami (T) 2016 Tasmanian State Natural Disaster Risk Assessment / All Hazard Summary / Hazard summaries by sector 13 Section Two Hazard summaries by sector
- 20. 2.4.3 Environment The risk of each hazard to the sub sectors of ‘Environment – Species’ and ‘Environment – Value’ are presented in Figures 2.6 and 2.7. Bushfire, flood and heatwave are the largest risks to species loss in Tasmania. Evidenced by the January 2016 fires throughout the north-west and central plateau, Tasmania is home to unique fire-intolerant ecosystems and species that are actively protected by each of the Department of Primary Industries, Parks, Water and the Environment (DPIPWE), the Tasmania Parks and Wildlife Service (PWS), the Tasmania Fire Service (TFS) and Forestry Tasmania (FT). Similarly, there a number of plant species that, due to their distribution and abundance, are at risk of extinction from relatively minor flooding events, let alone the very large events considered in these scenarios. Where bushfire and flood are usually discrete areas of impact, heatwave is very broad, possibly even statewide. The broad nature of the impact can mean significant areas of vegetation can be affected in a single event. Little is known about how heatwaves can influence particular species, or how widespread death or damage to species can be. Anecdotal evidence suggests impact is highly heterogeneous, depending on soil moisture and/or groundwater availability. Coastal inundation, tsunami and earthquake could all have some impact, with known endangered species within the areas that may be affected by each hazard; however, limited evidence exists to understand the impact of any single event. Coastal inundation may result in permanent loss of habitat. Tsunami – and earthquake-induced major dam failure may be an environmental disturbance that initiates ecosystem shifts, resulting in loss of species and value. Landslide and storm are both considered to have negligible impact on the environment. Environmental values are most at risk from bushfire, coastal inundation and flooding. While bushfire can deform and destroy fire sensitive ecosystems or organo-rich soils (such as peat-bogs), coastal inundation and flooding can result in permanent destruction of habitat substrates and subsequently the attached ecosystems. 14 2016 Tasmanian State Natural Disaster Risk Assessment / All Hazard Summary / Hazard summaries by sector Section Two Hazard summaries by sector
- 21. Figure 2.6 The risk of each natural hazard to the sub-sector Environment – Species. The central position is the average across sectors for both consequence and likelihood. The whiskers represent the minimum and maximum ratings across all sectors for each hazard. Environment Species Risk of Each Hazard Insignificant Minor Moderate Major Catastrophic Consequence Extremely Rare Very Rare Rare Unlikely Likely Almost Certain Likelihood B H S F T C E L P Risk Level Very Low Low Medium High Extreme Results Range Hazard Bushfire (B) Coastal Inundation (C) Earthquake (E) Flood (F) Heatwave (H) Landslide (L) Pandemic (P) Severe Storm (S) Tsunami (T) 2016 Tasmanian State Natural Disaster Risk Assessment / All Hazard Summary / Hazard summaries by sector 15 Section Two Hazard summaries by sector
- 22. Figure 2.7 The risk of each natural hazard to the sub-sector Environment – Value. The central position is the average across sectors for both consequence and likelihood. The whiskers represent the minimum and maximum ratings across all sectors for each hazard. Environment Value Risk of Each Hazard Insignificant Minor Moderate Major Catastrophic Consequence Extremely Rare Very Rare Rare Unlikely Likely Almost Certain Likelihood B H S F T C E L P Risk Level Very Low Low Medium High Extreme Results Range Hazard Bushfire (B) Coastal Inundation (C) Earthquake (E) Flood (F) Heatwave (H) Landslide (L) Pandemic (P) Severe Storm (S) Tsunami (T) 16 2016 Tasmanian State Natural Disaster Risk Assessment / All Hazard Summary / Hazard summaries by sector Section Two Hazard summaries by sector
- 23. 2.4.4 Public administration The risk of each hazard to Public Administration is presented in Figure 2.8. Public Administration is most at risk of catastrophic failure from bushfire, pandemic influenza and flooding. Bushfire is the greatest risk of power failure to a major centre. Flooding is the greatest risk of water supply failure. Both have the potential to destroy critical infrastructure such as roads and bridges that would require additional resources from the commonwealth to rebuild. Pandemic influenza has the greatest risk of personnel being temporarily unavailable to perform duties. Tsunami and earthquake have the potential to destroy public infrastructure such as wharves, roads and bridges. No significant risks to public administration were expected from heatwave, storm, coastal inundation or landslide. Impacts from these hazards would be localised emergencies where any loss of roads or bridges would have alternative routes available, and government is expected to have capacity to deal with additional loads experienced during these events. It must be noted ‘Landslide – Deep-Seated’ is already considered to be impacting on public administration more than once per year, increasing its likelihood from ‘Likely’ to ‘Almost Certain’. 2016 Tasmanian State Natural Disaster Risk Assessment / All Hazard Summary / Hazard summaries by sector 17 Section Two Hazard summaries by sector
- 24. Figure 2.8 The risk of each natural hazard to the sector Public Administration. The central position is the average across sectors for both consequence and likelihood. The whiskers represent the minimum and maximum ratings across all sectors for each hazard. Public Administration Risk of Each Hazard Insignificant Minor Moderate Major Catastrophic Consequence Extremely Rare Very Rare Rare Unlikely Likely Almost Certain Likelihood B H S F T C E L P Risk Level Very Low Low Medium High Extreme Results Range Hazard Bushfire (B) Coastal Inundation (C) Earthquake (E) Flood (F) Heatwave (H) Landslide (L) Pandemic (P) Severe Storm (S) Tsunami (T) 18 2016 Tasmanian State Natural Disaster Risk Assessment / All Hazard Summary / Hazard summaries by sector Section Two Hazard summaries by sector
- 25. 2.4.5 Social setting The risk of each hazard to the sub sectors of ‘Social Setting – Community Wellbeing’ and ‘Social Setting – Cultural Significance’ are presented in Figures 2.9 and 2.10. Social community wellbeing is most at risk from bushfire. Bushfires have the capacity to take lives, destroy homes, livelihoods and industries. They are a major risk to the continuation of small rural communities, with many complex ongoing social and psychological issues in play during the recovery phase (which may last years). All other hazards pose a low to moderate risk to communities, with limited long-term impacts on the existing community, certainly far less impact than changes observed and expected in human movements and demographics. Social cultural significance relates to events, locations or artefacts that are of importance to a community’s identity (and possibly related to their economic viability). The Sydney to Hobart Yacht Race, the Taste of Tasmania, AgFest, Dark MOFO, MONA FOMA and large music festivals were all explicitly mentioned in these discussions. No hazards were expected to cancel an event indefinitely, but many were believed to have the capacity to cancel the events for a single year, or force the relocation of the event. Severe storms were deemed to be the most significant hazard to this sector, presenting a ‘Likely’, ‘Major’ risk to outdoor events. Historically there have been many examples of cancellations and even more serious disasters, such as the 1998 Sydney to Hobart where six deaths initiated a permanent change to the governing systems. Bushfire has the capacity to cause cancellation of events, as human movement around the State can be impeded, or locations can be deemed unsafe due to both fire and/or smoke risk. For example: emissions from the 2013 south-east bushfires were closely monitored when coinciding with the Cadbury Marathon; the Rowing Tasmania Regatta at Lake Barrington was cancelled due to smoke in 2016; and the Overland Track Run was cancelled due to bushfire risk in 2016. The threat of coastal inundation or flooding to many events given their location on beaches or river banks was identified as unlikely. As tsunami is likely to impact Salamanca Place and this location is regularly hosting events (Salamanca Market, exhibitions, music events) it was thought that if an event occurred, it was possible to have some short-to-medium term impact on the Salamanca precinct. Heatwave is likely to occur during the festival season in Tasmania, when greater numbers of people congregate and alcohol is often consumed. This may increase risky behaviour and the likelihood of heat- stress illness. Earthquake, pandemic influenza and landslide pose a ‘Low’ risk to cultural significance, with communities considered flexible enough to either relocate or reschedule, or robust enough to endure the consequences expected. 2016 Tasmanian State Natural Disaster Risk Assessment / All Hazard Summary / Hazard summaries by sector 19 Section Two Hazard summaries by sector
- 26. Figure 2.9 The risk of each natural hazard to the sub-sector Social Setting – Community Wellbeing. The central position is the average across sectors for both consequence and likelihood. The whiskers represent the minimum and maximum ratings across all sectors for each hazard. Social Community Wellbeing Risk of Each Hazard Insignificant Minor Moderate Major Catastrophic Consequence Extremely Rare Very Rare Rare Unlikely Likely Almost Certain Likelihood B H S F T C E L P Risk Level Very Low Low Medium High Extreme Results Range Hazard Bushfire (B) Coastal Inundation (C) Earthquake (E) Flood (F) Heatwave (H) Landslide (L) Pandemic (P) Severe Storm (S) Tsunami (T) 20 2016 Tasmanian State Natural Disaster Risk Assessment / All Hazard Summary / Hazard summaries by sector Section Two Hazard summaries by sector
- 27. Figure 2.10 The risk of each natural hazard to the sub-sector Social Setting – Cultural Significance. The central position is the average across sectors for both consequence and likelihood. The whiskers represent the minimum and maximum ratings across all sectors for each hazard. Social Cultural Significance Risk of Each Hazard Insignificant Minor Moderate Major Catastrophic Consequence Extremely Rare Very Rare Rare Unlikely Likely Almost Certain Likelihood B H S F T C E L P Risk Level Very Low Low Medium High Extreme Results Range Hazard Bushfire (B) Coastal Inundation (C) Earthquake (E) Flood (F) Heatwave (H) Landslide (L) Pandemic (P) Severe Storm (S) Tsunami (T) 2016 Tasmanian State Natural Disaster Risk Assessment / All Hazard Summary / Hazard summaries by sector 21 Section Two Hazard summaries by sector
- 28. Section Three Comparison with TSNDRA 2012 3 Image: Department of Police, Fire and Emergency Management
- 29. 3.1 Participants Following recommendation from the author of TSNDRA 2012, the TSNDRA 2016 process made a deliberate effort to engage a larger number of experts, with a broader range of expertise than was possible for TSNDRA 2012. 3.2 Figures interpretation guide The results from TSNDRA 2012 were not reported with ‘sub-sectors’; as such the 2016 results were aggregated to the average value across the sector where necessary (e.g. People = (Deaths + Injury)/2). The TSNDRA 2012 results were only reported as true categorical values; therefore, for this comparison, the TSNDRA 2016 results were converted into true categorical values. This means many values directly overlay each other, impeding interpretation. For visualisation purposes, the exact locations of each symbol were slightly adjusted to improve user interpretation (with some loss of the precision when compared to Figure 2.10). As such, symbols inside the same matrix cell (e.g. ‘Major’ consequence – ‘Unlikely’ likelihood) should be interpreted as having exactly the same value (e.g. ‘High’ risk). TSNDRA 2012 values that cross the boundary between cells were rated as halfway between two categories and should still be interpreted as such. As the hazards heatwave, coastal inundation and pandemic influenza were not assessed in TSNDRA 2012, a comparison cannot be made and they have been excluded from this section. 3.3 All hazards comparison with TSNDRA 2012 3.3.1 People Bushfire: In the 2016 process, experts agreed the scenario considered would result in ‘Major Consequences’ (<50 deaths), which is a reduction from catastrophic (>50 deaths) in 2012. Experts believe the general public are more aware of the risk and are also more contactable than ever before, reducing the number of people expected to be exposed. However, the likelihood of a catastrophic event is increasing, changing from ‘Unlikely’ in 2012 to ‘Likely’ in 2016. This was believed to be mostly due to broad scale climate change. Earthquake – City Epicentre: A risk level of ‘Medium’ remained unchanged. For the scenario considered, experts in building collapse expected a large number of structural failures at any location in Tasmania. As a result, more than five deaths were expected, but less than 50 deaths. This is an increase from ‘Moderate’ in 2012 to ‘Major’ in 2016. However, the likelihood of such an event was decreased from ‘Rare’ in 2012 to ‘Very Rare’ in 2016. 3 Comparison with TSNDRA 2012 2016 Tasmanian State Natural Disaster Risk Assessment / All Hazard Summary / Comparison with TSNDRA 2012 23 Section Three Comparison with TSNDRA 2012
- 30. Earthquake – Dam Failure: The risk level decreased from ‘Medium’ in 2012 to ‘Low’ in 2016. This decrease is due to a decrease in both consequence (from ‘Major’ to ‘Moderate’) and likelihood (from ‘Very Rare’ to ‘Extremely Rare’). Consequences were rated lower, as emergency response for a major dam failure at vulnerable locations around the State had recently been exercised and, given the warning times available, it seemed reasonable that people could be moved out of the danger zone before rapid inundation occurred. Flood: The risk of flood to people remained unchanged at ‘Medium’. In 2016, experts agreed the scenario considered would result in ‘Major’ consequences (>5 deaths), which is an increase from ‘Moderate’ (<5 deaths) in 2012. This increase is largely due to the expected impact of this scenario on Greater Launceston region, with many households inundated. Participants estimated there would be more than 5 unavoidable deaths, but less than 50, due to a general improvement in emergency broadcast systems and public awareness since 1929, despite the increase in the number of people vulnerable to this hazard. The largest consequences were associated with cascading dam failure. The likelihood of such an event was expected to decrease substantially, changing from ‘Unlikely’ in 2012 to ‘Very Rare’ in 2016. It was recognised that smaller more frequent, localised events could result in 1-10 deaths, but they were not considered within the scenarios. Landslide – Debris Flow: The risk of debris flow to people remained unchanged at ‘High’. Despite the expected consequences increasing from ‘Major’ to ‘Catastrophic’, driven by recent research informing the speed of onset, a steady expectation of likelihood resulted in no change in the overall risk. Landslide – Deep-Seated: The risk of deep-seated landslide to people remained unchanged at ‘Medium’. Although consequences were increased from ‘Moderate’ to ‘Major’, the likelihood of such consequences was decreased substantially from ‘Unlikely’ to ‘Very Rare’. Even rapidly moving deep-seated landslides are often preceded by numerous physical warnings that encourage those in the area to evacuate, reducing the likelihood of worst-case impacts. Landslide – Rockfall: The risk of rockfall to people remained ‘Medium’, despite a decrease in the likelihood from ‘Unlikely’ to ‘Rare’. The scenario dictated a particular consequence, which must be at least ‘Moderate’; however, experts were aware that these incidents happen occasionally and are part of the core business of emergency services and DSG. Severe Storm: The risk of severe storm to people increased from ‘Medium’ in 2012 to ‘High’ in 2016 due to an increase in likelihood from ‘Unlikely’ to ‘Likely’. Experts believed the scenario was more likely than previously considered, although the consequences were generally unchanged. Tsunami: The risk of tsunami to people was increased from ‘Medium’ in 2012 to ‘High’ in 2016 due to an increase in consequence from ‘Major’ to ‘Catastrophic’, despite a decrease in likelihood to ‘Extremely Rare’. Experts believed that the rapid onset of this event (less than 3 hours warning in best-case conditions) limited the capacity of the emergency services to inform all vulnerable areas or people and as such it seemed realistic to expect more than 50 deaths or serious injuries. As the region of greatest vulnerability includes the Hobart waterfront, a busy place at regular times throughout the week and year, the evacuation during a large event was also considered. The likelihood of the event was decreased based on the annual exceedance probability defined in the scenario. 24 2016 Tasmanian State Natural Disaster Risk Assessment / All Hazard Summary / Comparison with TSNDRA 2012 Section Three Comparison with TSNDRA 2012
- 31. Figure 3.1 The change in the risk profile of the Sector – People, from 2012 to 2016. People: change in risk of each hazard between 2012 and 2016 Insignificant Minor Moderate Major Catastrophic Consequence Extremely Rare Very Rare Rare Unlikely Likely Almost Certain Likelihood BFS LDF LDS LRF EDF ECE T B F S LDF LDS LRF EDF ECE T Risk Level Very Low Low Medium High Extreme e.g. 2012 Results e.g. 2016 Results Hazard Bushfire (B) Earthquake City Epicentre (ECE) Earthquake Dam Failure (EDF) Flood (F) Landslide Debris flow (LDF) Landslide Deep Seated (LDS) Landslide Rock fall (LRF) Storm (S) Tsunami (T) 2016 Tasmanian State Natural Disaster Risk Assessment / All Hazard Summary / Comparison with TSNDRA 2012 25 Section Three Comparison with TSNDRA 2012
- 32. 3.3.2 Economic Bushfire: In 2012, the economic impact of the scenario considered would result in ‘Moderate/Major’ consequences. This was upgraded to ‘Catastrophic’ consequences in 2016, with the inclusion of potential loss of an entire industry, mostly attributed to an improvement in the expertise engaged. Lower resource (e.g. minerals, timber, woodchips) prices in 2016 relative to those in 2012 have affected the profitability of Tasmanian primary industries, making many of them vulnerable to operational interruptions of any kind. Experts had an appreciation of private assets at risk from bushfire, or protocols that force operational shutdowns during bushfire, that if experienced could force the cessation of Tasmanian operations. However, as particular conditions are required, these were considered less likely, hence the reduction from ‘Likely’ to ‘Unlikely’ likelihood. Earthquake – City Epicentre: The risk level decreased from ‘High’ in 2012 to ‘Medium’ in 2016 due to a reduction in the expected likelihood from ‘Rare’ to ‘Very Rare’. Earthquake – Dam Failure: A risk level of ‘Medium’ remained unchanged despite a decrease in the expected likelihood from ‘Very Rare’ to ‘Extremely Rare’. There was no change in the expected consequences. Flood: The risk of flood on the economy remained unchanged at ‘High’. Consequences remained ‘Major’, but likelihood was reduced from ‘Unlikely’ in 2012 to ‘Rare’ in 2016. This change had no impact on the overall risk rating. Landslide – Debris Flow: The risk of debris flow to the economy remained unchanged at ‘High’, with no changes to either expected likelihood or consequences. Landslide – Deep-Seated: The risk of deep-seated landslide on the economy was increased from ‘Low’ in 2012 to ‘Medium’ in 2016 due to an increase in likelihood. Recent research has identified more areas at risk of landslide. Furthermore, aggressive lobbying by property developers has limited the capacity of councils to prevent development within known landslide zones. Those areas at risk of landslide that have been developed have not necessarily implemented appropriate engineering and hydrological solutions to limit future damage or impacts. As such, the risk to the economy is increasing. Landslide – Rockfall: The risk of rockfall to the economy remained unchanged at ‘Low’, despite an increase in likelihood from ‘Unlikely’ to ‘Likely’. Experts agreed it was reasonable to expect an isolated community to have an access road cut off by a rockfall about every 10 years. However, they believed the road would only ever be closed for a short period of time (2-7 days), or alternative access routes would be available so consequences would remain as insignificant. Severe Storm: The risk of severe storm to the economy increased from ‘Medium’ in 2012 to ‘High’ in 2016 due to an increase in consequence from ‘Minor’ to ‘Moderate’. A better appreciation for the impact a severe storm can have on forestry, aquaculture and agricultural produce, as well as the potential to interrupt or cancel large outdoor festivals, was incorporated into the 2016 assessment, increasing the expected consequences. Tsunami: The risk of tsunami to the economy remained unchanged at ‘Medium’ despite a decrease in the expected likelihood from ‘Very Rare’ to ‘Extremely Rare’. 26 2016 Tasmanian State Natural Disaster Risk Assessment / All Hazard Summary / Comparison with TSNDRA 2012 Section Three Comparison with TSNDRA 2012
- 33. Figure 3.2 The change in the risk profile of the Sector – Economic, from 2012 to 2016. Economic: change in risk of each hazard between 2012 and 2016 Insignificant Minor Moderate Major Catastrophic Consequence Extremely Rare Very Rare Rare Unlikely Likely Almost Certain Likelihood B F S LDF LDSLRF EDF ECE T B F S LDF LDS LRF EDF ECE T Risk Level Very Low Low Medium High Extreme e.g. 2012 Results e.g. 2016 Results Hazard Bushfire (B) Earthquake City Epicentre (ECE) Earthquake Dam Failure (EDF) Flood (F) Landslide Debris flow (LDF) Landslide Deep Seated (LDS) Landslide Rock fall (LRF) Storm (S) Tsunami (T) 2016 Tasmanian State Natural Disaster Risk Assessment / All Hazard Summary / Comparison with TSNDRA 2012 27 Section Three Comparison with TSNDRA 2012
- 34. 3.3.3 Environment Bushfire: There was no change to the risk level expected for Environment between 2012 and 2016. It must be noted, the possibility of the loss of habitat/ecosystems/species was considered by the 2016 assessment. A ‘Catastrophic’ rating was recommended by one of the groups, who explicitly considered it ‘Likely’ the irreversible loss of alpine habitat, or a species, would occur within the scenario. Unfortunately, this was somewhat prescient of the event that occurred in January 2016, which resulted in devastating losses within the higher elevations of the Tasmanian Wilderness World Heritage Area. However, averaging across the 2016 groups resulted in a ‘Major’ rating (even after weighting by confidence, in the absence of a recorded expertise level). This highlights a limitation within this process when using multiple working groups: expertise must be explicitly recorded by each group for future assessments to ensure appropriate weighting of ratings. Earthquake – City Epicentre: A risk level of ‘Very Low’ remained unchanged. This was due to an increase in expected consequences from ‘Insignificant’ to ‘Minor coupled with a decrease in expected likelihood from ‘Rare’ to ‘Extremely Rare’. Earthquake – Dam Failure: The risk level increased from ‘Low’ in 2012 to ‘Medium’ in 2016. This was due to an increase in expected consequences from ‘Moderate’ to ‘Major’, despite a decrease in expected likelihood from ‘Very Rare’ to ‘Extremely Rare’. Flood: The risk of flood on the environment saw a dramatic shift from ‘Low’ in 2012 to ‘High’ in 2016. This change is attributed to an increase in expected consequences from ‘Insignificant/Low’ in 2012 to ‘Major’ in 2016. This large change is due to engaged experts from DPIPWE who could identify species at risk of local and global extinction from a flood event hazard at numerous sites around Tasmania. Landslide – Debris Flow: The risk of debris flow to the environment increased from ‘Very Low’ in 2012 to ‘Low’ in 2016, exclusively due to the increase in likelihood of an event. Recent research has identified many areas around Tasmania susceptible to debris flow, the vast majority of which are in isolated areas. This increases the expected occurrence and therefore the expected impact on the natural environment. Landslide – Deep-Seated: The risk of deep-seated landslide to the environment remained unchanged at ‘Low’ despite an increase in likelihood from ‘Unlikely’ to ‘Likely’. Environmental impacts are still considered insignificant from this hazard as all endangered species are not in at-risk areas (i.e. populated flat areas) or widely dispersed to escape extinction from a single event (e.g. spotted handfish). Landslide – Rockfall: The risk of rockfall on the environment remained unchanged at ‘Low’. There was no change to consequence or likelihood. Severe Storm: The risk of severe storm to the environment remained unchanged at ‘Low’. An increase in expected consequences from ‘Insignificant’ to ‘Minor’ was offset by the decreased likelihood of these consequences from ‘Likely to ‘Unlikely’. This recognises the capacity of severe storms to do significant damage to the natural environment, but it is relatively uncommon for that damage to be broad scale enough, or destructive enough to cause ecological shifts. Tsunami: The risk of tsunami to the environment was increased from ‘Very Low’ in 2012 to ‘Low’ in 2016 due to an increase in expected consequence from ‘Insignificant’ to ‘Moderate’. Experts considered the impact of a tsunami on 28 2016 Tasmanian State Natural Disaster Risk Assessment / All Hazard Summary / Comparison with TSNDRA 2012 Section Three Comparison with TSNDRA 2012
- 35. the coastal and marine ecosystems and identified a number of potential species and habitats that could be at risk. Although coastal habitats have evolved in a construction-destruction-construction cycle, some of these constructive systems have been interrupted by human development or invasive species (both terrestrial and marine). This leaves the existing ecosystem vulnerable to destructive forces with no expectation it would regenerate. Also, a number of exceedingly rare species are only found in waters surrounding south-eastern Tasmania. Figure 3.3 The change in the risk profile of the Sector – Environment, from 2012 to 2016. Environment: change in risk of each hazard between 2012 and 2016 Insignificant Minor Moderate Major Catastrophic Consequence Extremely Rare Very Rare Rare Unlikely Likely Almost Certain Likelihood BF S LDF LDS LRF EDF ECE T B F S LDF LDS LRF EDFECE T Risk Level Very Low Low Medium High Extreme e.g. 2012 Results e.g. 2016 Results Hazard Bushfire (B) Earthquake City Epicentre (ECE) Earthquake Dam Failure (EDF) Flood (F) Landslide Debris flow (LDF) Landslide Deep Seated (LDS) Landslide Rock fall (LRF) Storm (S) Tsunami (T) 2016 Tasmanian State Natural Disaster Risk Assessment / All Hazard Summary / Comparison with TSNDRA 2012 29 Section Three Comparison with TSNDRA 2012
- 36. 3.3.4 Public administration Bushfire: Experts in the 2016 assessment believe the public administration consequences remain ‘Moderate’, although the likelihood of the scenario increases from ‘Unlikely’ in 2012, to ‘Likely’ in 2016, driven by the recent experience of the Dunalley Bushfires, which highlighted the capacity-gaps of Tasmanian Government as a whole to respond to such a large event. Earthquake – City Epicentre: The risk level decreased from ‘High’ in 2012 to ‘Low’ in 2016. This was due to a decrease of expected consequences from ‘Major’ to ‘Moderate’, where the expectation was that government could continue operations regardless of the impacts. However, the major driver for the decrease in risk is from a very large decrease in likelihood from ‘Rare’ to ‘Very Rare’. Earthquake – Dam Failure: The risk level decreased from ‘Medium’ in 2012 to ‘Low’ in 2016. This is due to a decrease in both expected consequences from ‘Major’ to ‘Moderate’ as well as a decrease in likelihood from ‘Very Rare’ to ‘Extremely Rare’. Flood: The risk of flood on public administration increased from ‘Medium’ in 2012 to ‘High’ in 2016. This change was due to an increase in consequence, despite a decrease in likelihood. Expected consequences increased from ‘Moderate’ to ‘Major’ as recent work informed the impact such a scenario would have on fresh drinking water supplies. Although this was tempered by a decrease in likelihood from ‘Unlikely’ to ‘Rare’, the overall risk still increased. Landslide – Debris Flow: The risk of debris flow on public administration was decreased from ‘High’ in 2012 to ‘Medium’ in 2016 due to a decrease in the expected consequences from ‘Major’ to ‘Moderate’ and no change in likelihood. Recent work within councils to identify and manage the risk of debris flow has improved the understanding and impact an event will have on a broad scale. Although such an event would be devastating, it is expected to be highly localised, with capacity from throughout the State available to assist in response and recovery activities. Landslide – Deep-Seated: The risk of deep-seated landslide on public administration was increased from ‘Low’ in 2012 to ‘Medium’ in 2016. This was due to a large increase in likelihood, from ‘Unlikely’ to ‘Almost Certain’. Although the expected consequences decreased from ‘Minor’ to ‘Insignificant’, the high likelihood of the event ensures a ‘Medium’ risk rating. Experts were aware that government is already addressing deep-seated landslide issues, with the expectation this workload will increase with time. However, it was also believed this was within existing capability to absorb. Landslide – Rockfall: The risk of rockfall on public administration was increased from ‘Very Low’ in 2012 to ‘Low’ in 2016 due to an increase in likelihood from ‘Rare’ to ‘Unlikely’. Consequences remain insignificant as they fall within the core business of all responsible agencies. Severe Storm: The risk of severe storm to public administration remained unchanged at ‘Low’. An increase in expected consequences was offset by a decrease in expected likelihood. Tsunami: The risk of tsunami to public administration remains unchanged at ‘Medium’ despite a decrease in likelihood from ‘Very Rare’ in 2012 to ‘Extremely Rare’ in 2016. 30 2016 Tasmanian State Natural Disaster Risk Assessment / All Hazard Summary / Comparison with TSNDRA 2012 Section Three Comparison with TSNDRA 2012
- 37. Figure 3.4 The change in the risk profile of the Sector – Public Administration, from 2012 to 2016. Public Administration: change in risk of each hazard between 2012 and 2016 Insignificant Minor Moderate Major Catastrophic Consequence Extremely Rare Very Rare Rare Unlikely Likely Almost Certain Likelihood B F S LDF LDSLRF EDF ECE T B F S LDF LDS LRF EDFECE T Risk Level Very Low Low Medium High Extreme e.g. 2012 Results e.g. 2016 Results Hazard Bushfire (B) Earthquake City Epicentre (ECE) Earthquake Dam Failure (EDF) Flood (F) Landslide Debris flow (LDF) Landslide Deep Seated (LDS) Landslide Rock fall (LRF) Storm (S) Tsunami (T) 2016 Tasmanian State Natural Disaster Risk Assessment / All Hazard Summary / Comparison with TSNDRA 2012 31 Section Three Comparison with TSNDRA 2012
- 38. 3.3.5 Social setting Bushfire: The social setting in 2016 was informed by the 2013 bushfires that impacted on the Dunalley township. This event, being fresh in the minds of participants, improved their ability to rate the social consequences, especially with regard to the longer-term impacts. Coupled with this, applicable social setting expertise was engaged and in attendance. As such, consequences increased from ‘Insignificant/Minor’ to ‘Moderate’, although the likelihood was reduced from ‘Likely’ to ‘Unlikely’. Earthquake – City Epicentre: A risk level of ‘Medium’ remained unchanged. This is despite an increase in expected consequences from ‘Moderate’ to ‘Major’ as the knowledge is improved on the social impacts of natural disasters. However, as likelihood decreases from ‘Rare’ to ‘Very Rare’, the risk level remains the same. Earthquake – Dam Failure: The risk level decreased from ‘Medium’ in 2012 to ‘Low’ in 2016. The expected consequences decreased from ‘Major’ to ‘Moderate’ as vulnerable communities are made more aware of the risk, so the level of preparation is improving. The expected likelihood decreased from ‘Very Rare’ to ‘Extremely Rare’. Flood: The risk of flood on social setting decreased from ‘High’ in 2012 to ‘Medium’ in 2016 due to a decrease in both consequence and likelihood. Expected consequences were decreased from ‘Major’ to ‘Moderate’. The scenario was not expected to force the permanent relocation of people away from a community or significantly disrupt any culturally significant events for more than a single season/year. Likelihood was decreased from ‘Unlikely’ to ‘Rare’ due to the required scale of the worst-case scenario for the scope of this statewide assessment. Landslide – Debris Flow: The risk of debris flow on social setting was reduced from ‘Low/Moderate’ in 2012 to ‘Low’ in 2016 due to a decrease in expected consequences. Any impact of debris flow on a community is expected to be short-to-medium term, with no permanent displacement of residents or businesses. Landslide – Deep-Seated: The risk of deep-seated landslide on social setting remained unchanged at ‘Low’ despite an increase in likelihood from ‘Unlikely’ to ‘Likely’. Landslide – Rockfall: The risk of rockfall to social setting was increased from ‘Very Low’ in 2012 to ‘Low’ in 2016 due to an increase in likelihood from ‘Rare’ to ‘Likely’. This large change in likelihood is due to the consideration of a road closure impacting on an isolated community about once every decade, but with consequences expected to remain as ‘Insignificant’ (i.e. an inconvenience). Severe Storm: The risk of severe storm to social setting was increased from ‘Low’ in 2012 to ‘Medium’ in 2016. This was due to a large increase in expected consequences from ‘Insignificant’ to ‘Moderate’. The 2016 participants placed greater emphasis on the risk to cultural events around the State. Many communities rely on large festivals as an opportunity to bring the community together as well as to encourage the local economy. Severe storms have historically been a risk to such events, reducing visitor numbers, or cancelling events completely. This aspect was incorporated into the assessment in 2016. Tsunami: The risk of tsunami to social setting remains unchanged at ‘Low’ despite a decrease in likelihood from ‘Very Rare’ in 2012 to ‘Extremely Rare’ in 2016. 32 2016 Tasmanian State Natural Disaster Risk Assessment / All Hazard Summary / Comparison with TSNDRA 2012 Section Three Comparison with TSNDRA 2012
- 39. Figure 3.5 The change in the risk profile of the Sector – Social Setting, from 2012 to 2016. Social Setting: change in risk of each hazard between 2012 and 2016 Insignificant Minor Moderate Major Catastrophic Consequence Extremely Rare Very Rare Rare Unlikely Likely Almost Certain Likelihood B F S LDF LDS LRF EDF ECE T B F S LDF LDS LRF EDF ECE T Risk Level Very Low Low Medium High Extreme e.g. 2012 Results e.g. 2016 Results Hazard Bushfire (B) Earthquake City Epicentre (ECE) Earthquake Dam Failure (EDF) Flood (F) Landslide Debris flow (LDF) Landslide Deep Seated (LDS) Landslide Rock fall (LRF) Storm (S) Tsunami (T) 2016 Tasmanian State Natural Disaster Risk Assessment / All Hazard Summary / Comparison with TSNDRA 2012 33 Section Three Comparison with TSNDRA 2012
- 40. Section Four Conclusions4 Image: Department of Police, Fire and Emergency Management
- 41. Natural disasters will continue to occur. How we cope as individuals, communities and governments is reliant upon our knowledge of these hazards and the impacts they may have. By reviewing TSNDRA 2012 and systematically working through an updated risk assessment and management process, we can build upon our understanding of the nature and extent of the risks and therefore improve our control over the impacts of natural disasters. For governments, this better understanding of risk can help in prioritising the use of limited funds and resources in the most effective way to lessen the consequences and help build resilience. For individuals, understanding the nature of the hazards and the potential impacts will allow them to share in the responsibility for preparing for, responding to and recovering from disasters. Disaster resilience is a joint responsibility of government, business, the non-government sector and individuals. By working together with a shared sense of responsibility and focus our efforts will be far more effective. 4 Conclusions 2016 Tasmanian State Natural Disaster Risk Assessment / All Hazard Summary / Conclusions 35 Section Four Conclusions
- 42. 1. Fox-Hughes P, Harris R, Lee G, Grose M and Bindoff N 2014, ‘Future fire danger climatology for Tasmania, Australia, using a dynamically downscaled regional climate model’, International Journal of Wildland Fire, 23(3): 309-321, doi: 10.1071/WF13126, viewed at: http://www.publish.csiro.au/?paper=WF13126 2. Fox-Hughes P, Harris RMB, Lee G, Jabour J, Grose MR, Remenyi TA and Bindoff NL, 2015, ‘Climate Futures for Tasmania future fire danger: the summary and the technical report’, Antarctic Climate & Ecosystems Cooperative Research Centre, Hobart, viewed at: http://acecrc.org.au/publication/future-fire-danger/ References References 36 2016 Tasmanian State Natural Disaster Risk Assessment / All Hazard Summary / References