Downloaded 40 times


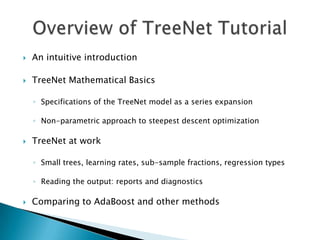


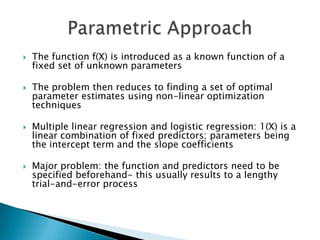
![ Consider binary classification and assume that y is coded as +1
or -1
The most detailed solution would then give us the associated
probabilities p(y)
Since probabilities are naturally constrained to the [0,1] interval,
we assume that the function f(X) is transformed
p(y)=1/(1+exp(-2fy))
Note that p(+1)+p(-1)=1
The “trick” here is finding an unconstrained estimate f instead of
constrained estimate p
Also note that f is simply half log-odds ratio of y=+1](https://image.slidesharecdn.com/treenetnewppt-120127134009-phpapp02/85/Introduction-to-TreeNet-2004-11-320.jpg)
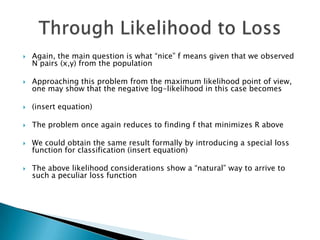

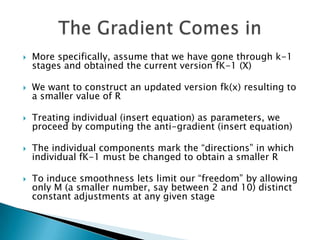
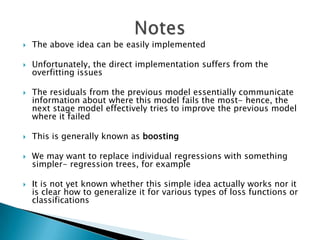
![ For the given loss function L[y,IV],M, and MaxTrees
◦ Make an initial guess f(X)=f
◦ For K=0 to MaxTrees-1
◦ Compute the anti-gradient Gk by taking the derivative of the loss with
respect to f(X) and substitute y and current fk (X)
◦ Fit an M-node regression tree to the components of the negative gradient
1this will partition observations into M mutually exclusive groups
◦ Find the within node updates a5 by performing M univariate optimizations
of the node contributions to the estimated loss
◦ Do the update (insert equation)
◦ End for](https://image.slidesharecdn.com/treenetnewppt-120127134009-phpapp02/85/Introduction-to-TreeNet-2004-20-320.jpg)
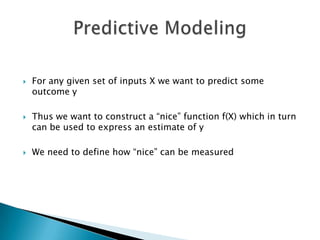
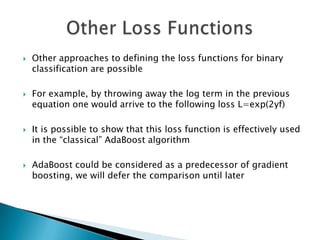
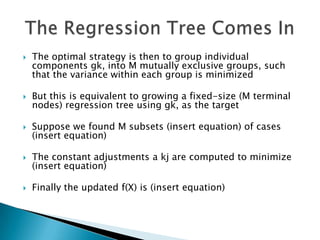
![ For L[y,IV]=(y-f)^2, M, and MaxTrees
Initial guess f(X)=f= mean(y)
For K=0 to MaxTrees-1
The anti-gradient component (insert equation) which is the traditional
definition of the current residual
Fit an M-node regression tree to the current residuals 1* this will partition
observations into M mutually exclusive groups
The within-node updates a k, simply become node averages of the current
residuals
Do the update: (insert equation)
End for](https://image.slidesharecdn.com/treenetnewppt-120127134009-phpapp02/85/Introduction-to-TreeNet-2004-21-320.jpg)
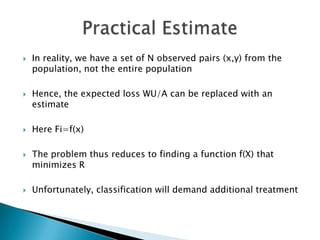
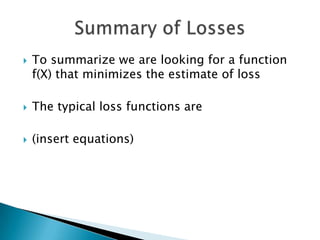
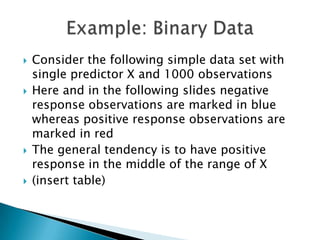
![ For L[Y,fiX]=1 y-fl,M, and MaxTrees
Initial guess f(X)=f=median(y)
For k=0 to MaxTrees-1
The anti-gradient component (insert equation) which is the sign of the
current residuals
Fit an M-node regression tree to the sign of the current residuals 1* this
will partition observations into M mutually exclusive groups
The within-node updates a ki now become node medians of the current
residuals
Do the update (insert equation)
End for](https://image.slidesharecdn.com/treenetnewppt-120127134009-phpapp02/85/Introduction-to-TreeNet-2004-22-320.jpg)
![ For L[y,f(X)]=log[1-exp(-2yf)], M, and MaxTrees
Initial guess f(X)=f= half log- odds of y=+1
For k=0 to MaxTrees-1
Recall that (insert equation) we call these generalize residuals
Fit an M-node regression tree to the generalized residuals 1* this will
partition observations into M mutually exclusive groups
The within-node updates ak, are somewhat complicated (insert
equation) where all measures are taken with respect to the node and
variance (insert equation)
Do the update (insert equation)
End for](https://image.slidesharecdn.com/treenetnewppt-120127134009-phpapp02/85/Introduction-to-TreeNet-2004-23-320.jpg)

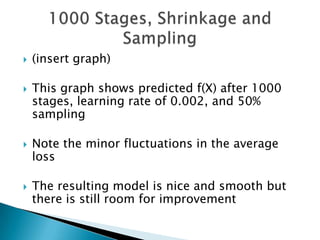


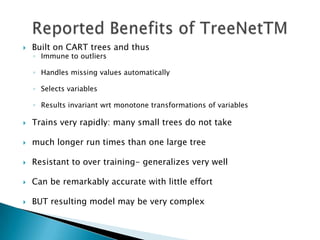
The document provides an introduction to TreeNet, a machine learning algorithm developed by Jerome Friedman. TreeNet builds regression and classification models in a stagewise fashion, using small regression trees at each stage to model residuals from the previous stage. It employs techniques like learning small trees, subsampling data, and using a small learning rate to minimize overfitting. TreeNet models can be very accurate while remaining resistant to overfitting.