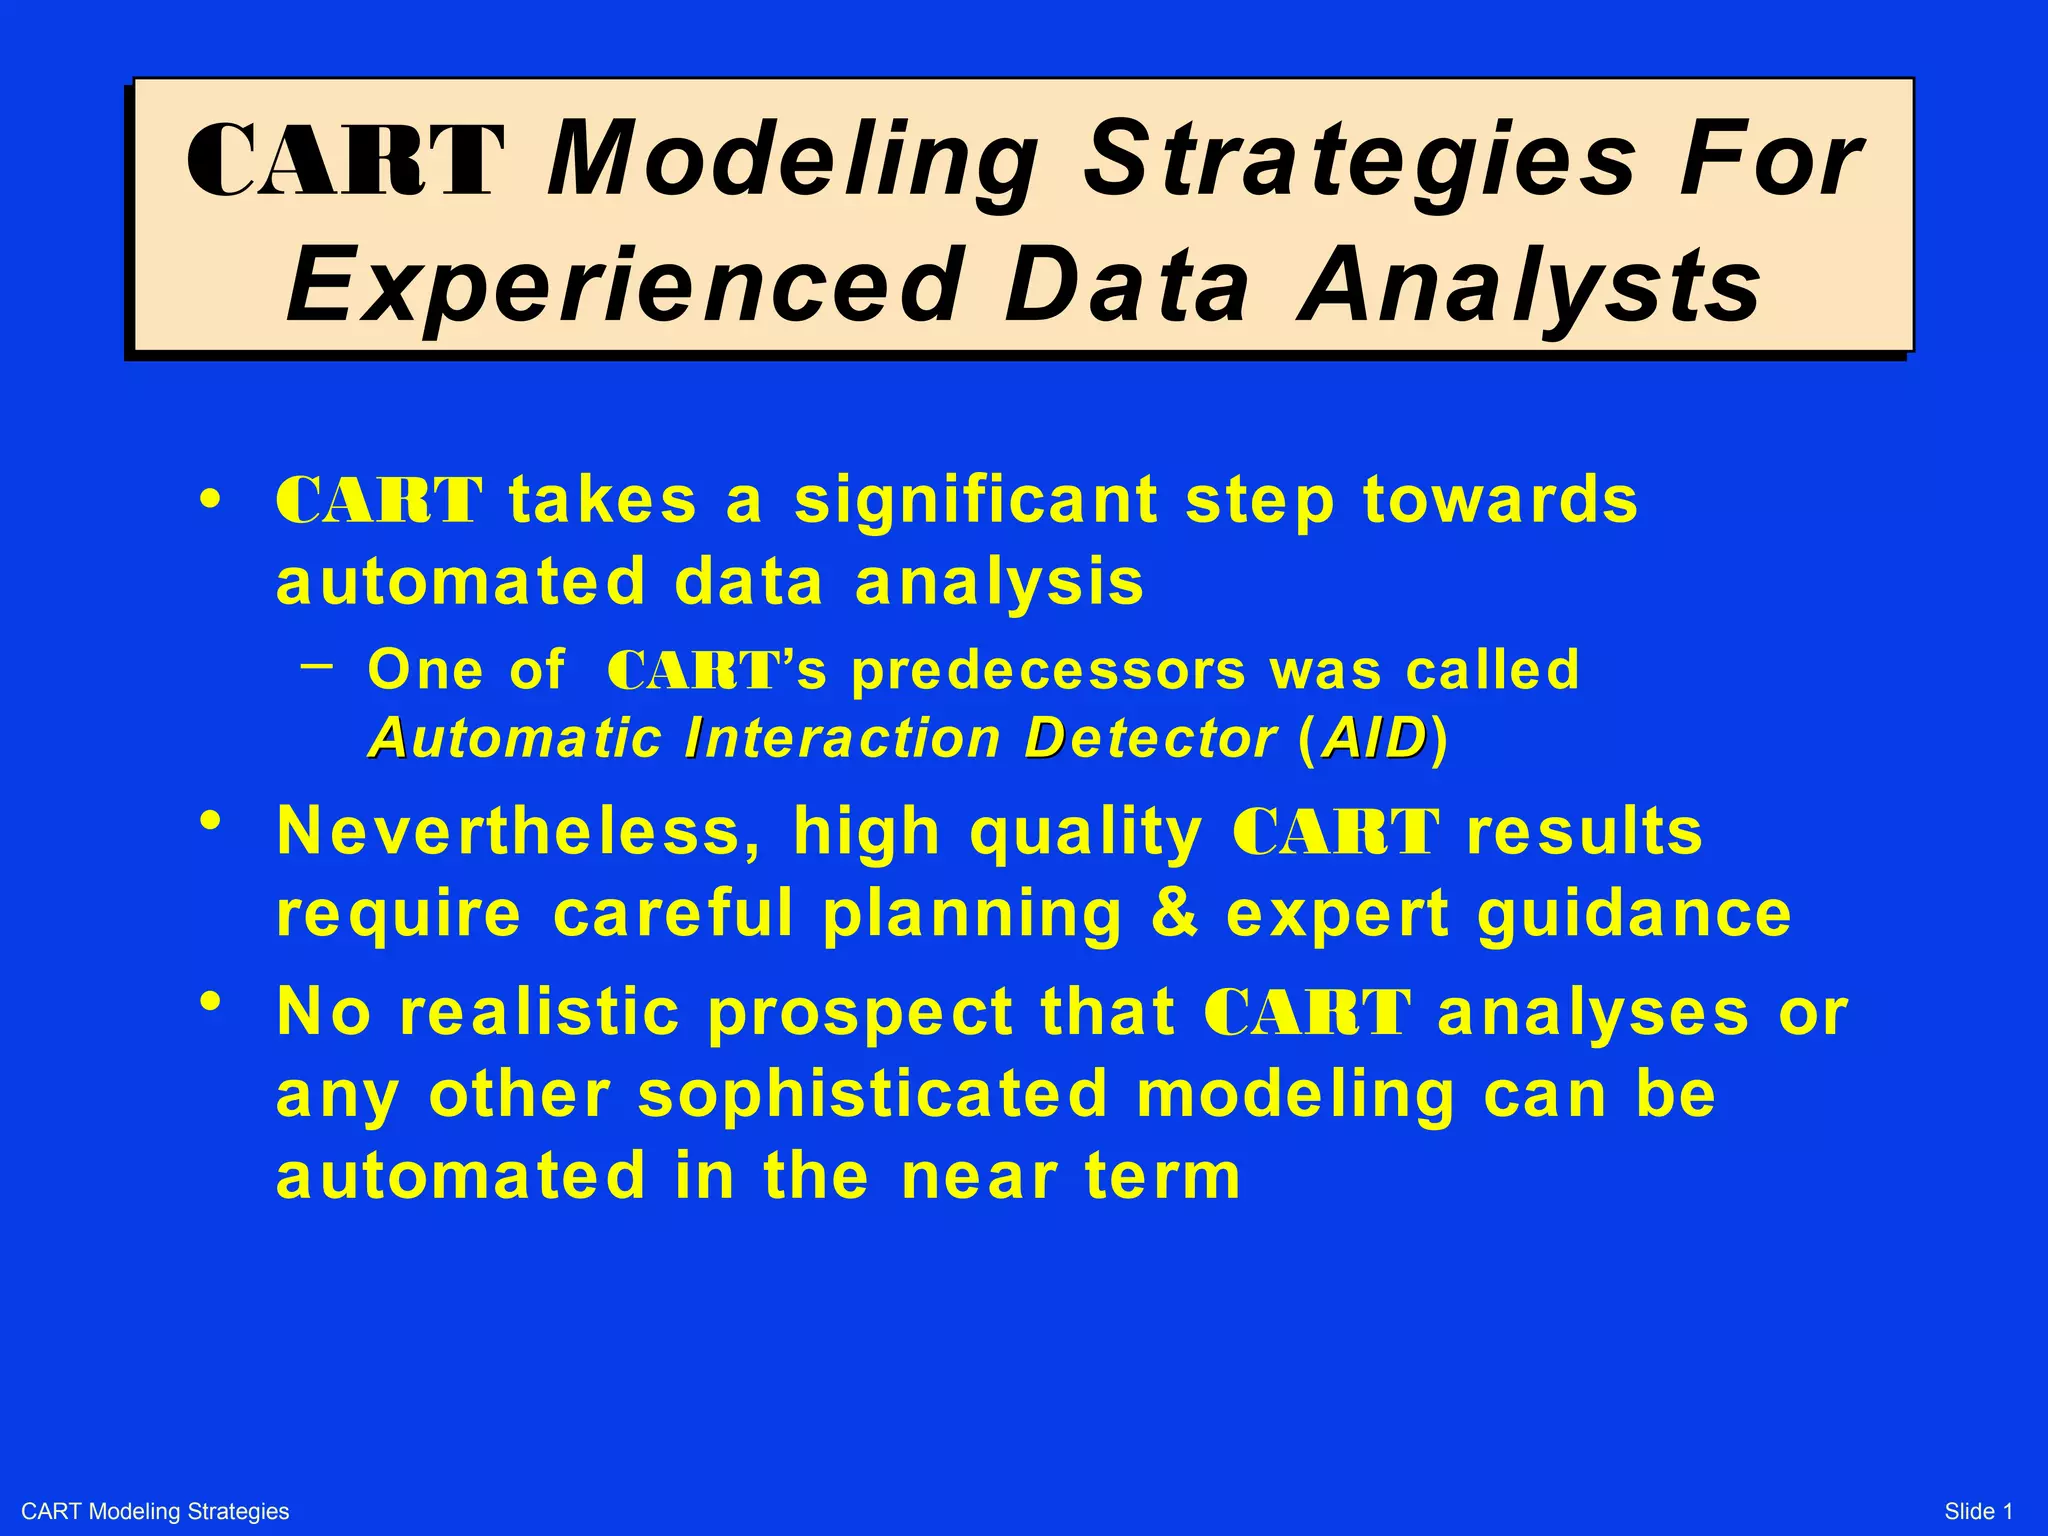
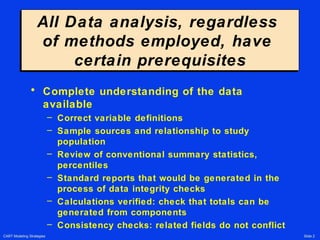
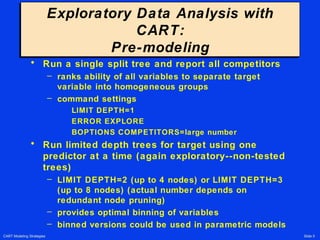
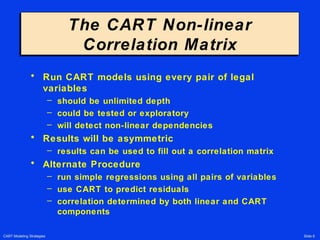
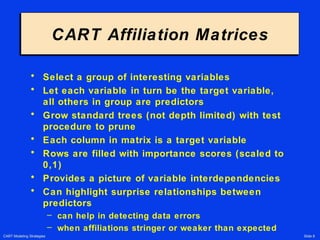
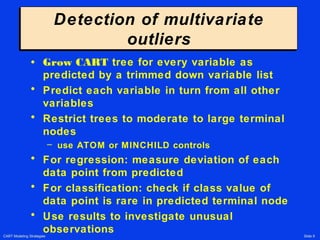
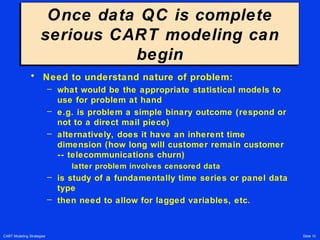
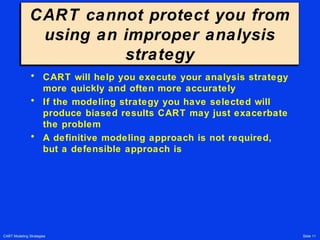
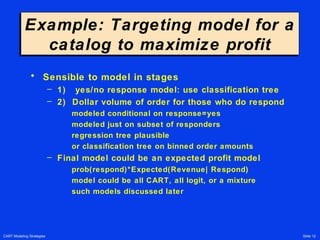
This presentation educates you about Classification and
Regression trees (CART), CART decision tree methodology, Classification Trees, Regression Trees, Differences in CART, When to use CART?, Advantages of CART, Limitations of CART and What is a CART in Machine Learning?.
For more topics stay tuned with Learnbay.
CART: Not only Classification and Regression TreesMarc Garcia
Â
Decision trees are very simple methods compared to Support Vector Machines, or Deep Learning. But they have some interesting properties that make them unique. For classification, for regression, or to extract probabilities, decision trees are easy to set up, and debug. And they are excellent to get a better understanding of your data.
This talk will cover Decision Trees, from theory, to their implementation in Python.
The talk will have a very practical approach, using examples and real cases to illustrate how to use decision trees, what we can expect from using them, and what kind of problems we will need to address.
The main topics covered will include:
* What are decision trees?
* How decision trees are trained?
* Data preprocessing for decision trees
* Understanding your data better with decision tree visualization
* Debugging decision trees using common sense and prior domain knowledge
* Avoiding overfitting, without cross-validation
* Python implementation
* Performance
Basic of Decision Tree Learning. This slide includes definition of decision tree, basic example, basic construction of a decision tree, mathlab example
Slide explaining the distinction between bagging and boosting while understanding the bias variance trade-off. Followed by some lesser known scope of supervised learning. understanding the effect of tree split metric in deciding feature importance. Then understanding the effect of threshold on classification accuracy. Additionally, how to adjust model threshold for classification in supervised learning.
Note: Limitation of Accuracy metric (baseline accuracy), alternative metrics, their use case and their advantage and limitations were briefly discussed.
Data Science - Part V - Decision Trees & Random Forests Derek Kane
Â
This lecture provides an overview of decision tree machine learning algorithms and random forest ensemble techniques. The practical example includes diagnosing Type II diabetes and evaluating customer churn in the telecommunication industry.
This is the most simplest and easy to understand ppt. Here you can define what is decision tree,information gain,gini impurity,steps for making decision tree there pros and cons etc which will helps you to easy understand and represent it.
Get to know in detail the termonologies of Random Forest with their types of algorithms used in the workflow along with their advantages and disadvantages of their predecessors.
Thanks, for your time, if you enjoyed this short article there are tons of topics in advanced analytics, data science, and machine learning available in my medium repo. https://medium.com/@bobrupakroy
This presentation was prepared as part of the curriculum studies for CSCI-659 Topics in Artificial Intelligence Course - Machine Learning in Computational Linguistics.
It was prepared under guidance of Prof. Sandra Kubler.
Using CART For Beginners with A Teclo Example DatasetSalford Systems
Â
Familiarize yourself with CART Decision Tree technology in this beginner's tutorial using a telecommunications example dataset from the 1990s. By the end of this tutorial you should feel comfortable using CART on your own with sample or real-world data.
In this presentation I review various data science techniques and discuss their usefulness to pricing actuaries working in general insurance.
This presentation was originally given at the TIGI webinar in 2020.
https://www.actuaries.org.uk/learn-develop/attend-event/tigi-2020-technical-issues-general-insurance
Generalized linear models (GLMs) and gradient boosting machines (GBMs) are two of the most widely used supervised learning approaches in all of commercial data science. GLMs have been the go-to predictive and inferential modeling tool for decades, but important mathematical and computational advances have been made in training GLMs in recent years. This talk will contrast H2Oâs implementation of penalized GLM techniques with ordinary least squares and give specific hints for building regularized and accurate GLMs for both predictive and inferential purposes. As more organizations begin experimenting with and embracing algorithms from the machine learning tradition, GBMs have come to prominence due to their predictive accuracy, the ability to train on real-world data, and resistance to overfitting training data. This talk will give some background on the GBM approach, some insight into the H2O implementation, and some tips for tuning and interpreting GBMs in H2O.
Patrick's Bio:
Patrick Hall is a senior data scientist and product engineer at H2O.ai. Patrick works with H2O.ai customers to derive substantive business value from machine learning technologies. His product work at H2O.ai focuses on two important aspects of applied machine learning, model interpretability and model deployment. Patrick is also currently an adjunct professor in the Department of Decision Sciences at George Washington University, where he teaches graduate classes in data mining and machine learning.
Prior to joining H2O.ai, Patrick held global customer facing roles and R & D research roles at SAS Institute. He holds multiple patents in automated market segmentation using clustering and deep neural networks. Patrick is the 11th person worldwide to become a Cloudera certified data scientist. He studied computational chemistry at the University of Illinois before graduating from the Institute for Advanced Analytics at North Carolina State University.
Production model lifecycle management 2016 09Greg Makowski
Â
This talk covers going over the various stages of building data mining models, putting them into production and eventually replacing them. A common theme throughout are three attributes of predictive models: accuracy, generalization and description. I assert you can have it all, and having all three is important for managing the lifecycle. A subtle point is that this is a step to developing embedded, automated data mining systems which can figure out themselves when they need to be updated.
https://github.com/telecombcn-dl/dlmm-2017-dcu
Deep learning technologies are at the core of the current revolution in artificial intelligence for multimedia data analysis. The convergence of big annotated data and affordable GPU hardware has allowed the training of neural networks for data analysis tasks which had been addressed until now with hand-crafted features. Architectures such as convolutional neural networks, recurrent neural networks and Q-nets for reinforcement learning have shaped a brand new scenario in signal processing. This course will cover the basic principles and applications of deep learning to computer vision problems, such as image classification, object detection or text captioning.
"A Framework for Developing Trading Models Based on Machine Learning" by Kris...Quantopian
Â
Presented at QuantCon Singapore 2016, Quantopian's quantitative finance and algorithmic trading conference, November 11th.
Machine learning is improving facets of our lives as diverse as health screening, transportation and even our entertainment choices. It stands to reason that machine learning can also improve trading performance, however the practical application is fraught with pitfalls and obstacles that nullify the benefits and present a high barrier to entry. Building on background information and introductory material, Kris will propose a framework for efficient and robust experimentation with machine learning methods for algorithmic trading. The framework's objective is to arrive at parsimonious models whose positive past performance is unlikely to be due to chance. The framework is demonstrated via practical examples of various machine learning models for algorithmic trading.
Parallel Rule Generation For Efficient Classification SystemTalha Ghaffar
Â
Parallel Rule Generation For Efficient Classification System,
genetic algorithms,
divide and conquer approach to classification , Distributed computing to solve classification problem , heterogeneous approach to classification
Improve Your Regression with CART and RandomForestsSalford Systems
Â
Why You Should Watch: Learn the fundamentals of tree-based machine learning algorithms and how to easily fine tune and improve your Random Forest regression models.
Abstract: In this webinar we'll introduce you to two tree-based machine learning algorithms, CARTÂŽ decision trees and RandomForestsÂŽ. We will discuss the advantages of tree based techniques including their ability to automatically handle variable selection, variable interactions, nonlinear relationships, outliers, and missing values. We'll explore the CART algorithm, bootstrap sampling, and the Random Forest algorithm (all with animations) and compare their predictive performance using a real world dataset.
TreeNet Tree Ensembles & CART Decision Trees: A Winning CombinationSalford Systems
Â
Understand CART decision tree pros/cons, how TreeNet stochastic gradient boosting ca n help overcome single-tree challenges, and what the advantages are when using CART and TreeNet in combination for predictive modeling success.
When building a predictive model in SPM, you'll want to know exactly what you did to get your results. This short slide deck will show you how to review your work in the session logs.
Elevating Tactical DDD Patterns Through Object CalisthenicsDorra BARTAGUIZ
Â
After immersing yourself in the blue book and its red counterpart, attending DDD-focused conferences, and applying tactical patterns, you're left with a crucial question: How do I ensure my design is effective? Tactical patterns within Domain-Driven Design (DDD) serve as guiding principles for creating clear and manageable domain models. However, achieving success with these patterns requires additional guidance. Interestingly, we've observed that a set of constraints initially designed for training purposes remarkably aligns with effective pattern implementation, offering a more âmechanicalâ approach. Let's explore together how Object Calisthenics can elevate the design of your tactical DDD patterns, offering concrete help for those venturing into DDD for the first time!
GDG Cloud Southlake #33: Boule & Rebala: Effective AppSec in SDLC using Deplo...James Anderson
Â
Effective Application Security in Software Delivery lifecycle using Deployment Firewall and DBOM
The modern software delivery process (or the CI/CD process) includes many tools, distributed teams, open-source code, and cloud platforms. Constant focus on speed to release software to market, along with the traditional slow and manual security checks has caused gaps in continuous security as an important piece in the software supply chain. Today organizations feel more susceptible to external and internal cyber threats due to the vast attack surface in their applications supply chain and the lack of end-to-end governance and risk management.
The software team must secure its software delivery process to avoid vulnerability and security breaches. This needs to be achieved with existing tool chains and without extensive rework of the delivery processes. This talk will present strategies and techniques for providing visibility into the true risk of the existing vulnerabilities, preventing the introduction of security issues in the software, resolving vulnerabilities in production environments quickly, and capturing the deployment bill of materials (DBOM).
Speakers:
Bob Boule
Robert Boule is a technology enthusiast with PASSION for technology and making things work along with a knack for helping others understand how things work. He comes with around 20 years of solution engineering experience in application security, software continuous delivery, and SaaS platforms. He is known for his dynamic presentations in CI/CD and application security integrated in software delivery lifecycle.
Gopinath Rebala
Gopinath Rebala is the CTO of OpsMx, where he has overall responsibility for the machine learning and data processing architectures for Secure Software Delivery. Gopi also has a strong connection with our customers, leading design and architecture for strategic implementations. Gopi is a frequent speaker and well-known leader in continuous delivery and integrating security into software delivery.
Dev Dives: Train smarter, not harder â active learning and UiPath LLMs for do...UiPathCommunity
Â
đĽ Speed, accuracy, and scaling â discover the superpowers of GenAI in action with UiPath Document Understanding and Communications Miningâ˘:
See how to accelerate model training and optimize model performance with active learning
Learn about the latest enhancements to out-of-the-box document processing â with little to no training required
Get an exclusive demo of the new family of UiPath LLMs â GenAI models specialized for processing different types of documents and messages
This is a hands-on session specifically designed for automation developers and AI enthusiasts seeking to enhance their knowledge in leveraging the latest intelligent document processing capabilities offered by UiPath.
Speakers:
đ¨âđŤ Andras Palfi, Senior Product Manager, UiPath
đŠâđŤ Lenka Dulovicova, Product Program Manager, UiPath
Builder.ai Founder Sachin Dev Duggal's Strategic Approach to Create an Innova...Ramesh Iyer
Â
In today's fast-changing business world, Companies that adapt and embrace new ideas often need help to keep up with the competition. However, fostering a culture of innovation takes much work. It takes vision, leadership and willingness to take risks in the right proportion. Sachin Dev Duggal, co-founder of Builder.ai, has perfected the art of this balance, creating a company culture where creativity and growth are nurtured at each stage.
Generating a custom Ruby SDK for your web service or Rails API using Smithyg2nightmarescribd
Â
Have you ever wanted a Ruby client API to communicate with your web service? Smithy is a protocol-agnostic language for defining services and SDKs. Smithy Ruby is an implementation of Smithy that generates a Ruby SDK using a Smithy model. In this talk, we will explore Smithy and Smithy Ruby to learn how to generate custom feature-rich SDKs that can communicate with any web service, such as a Rails JSON API.
Transcript: Selling digital books in 2024: Insights from industry leaders - T...BookNet Canada
Â
The publishing industry has been selling digital audiobooks and ebooks for over a decade and has found its groove. Whatâs changed? What has stayed the same? Where do we go from here? Join a group of leading sales peers from across the industry for a conversation about the lessons learned since the popularization of digital books, best practices, digital book supply chain management, and more.
Link to video recording: https://bnctechforum.ca/sessions/selling-digital-books-in-2024-insights-from-industry-leaders/
Presented by BookNet Canada on May 28, 2024, with support from the Department of Canadian Heritage.
The Art of the Pitch: WordPress Relationships and SalesLaura Byrne
Â
Clients donât know what they donât know. What web solutions are right for them? How does WordPress come into the picture? How do you make sure you understand scope and timeline? What do you do if sometime changes?
All these questions and more will be explored as we talk about matching clientsâ needs with what your agency offers without pulling teeth or pulling your hair out. Practical tips, and strategies for successful relationship building that leads to closing the deal.
Connector Corner: Automate dynamic content and events by pushing a buttonDianaGray10
Â
Here is something new! In our next Connector Corner webinar, we will demonstrate how you can use a single workflow to:
Create a campaign using Mailchimp with merge tags/fields
Send an interactive Slack channel message (using buttons)
Have the message received by managers and peers along with a test email for review
But thereâs more:
In a second workflow supporting the same use case, youâll see:
Your campaign sent to target colleagues for approval
If the âApproveâ button is clicked, a Jira/Zendesk ticket is created for the marketing design team
Butâif the âRejectâ button is pushed, colleagues will be alerted via Slack message
Join us to learn more about this new, human-in-the-loop capability, brought to you by Integration Service connectors.
And...
Speakers:
Akshay Agnihotri, Product Manager
Charlie Greenberg, Host
Encryption in Microsoft 365 - ExpertsLive Netherlands 2024Albert Hoitingh
Â
In this session I delve into the encryption technology used in Microsoft 365 and Microsoft Purview. Including the concepts of Customer Key and Double Key Encryption.
Smart TV Buyer Insights Survey 2024 by 91mobiles.pdf91mobiles
Â
91mobiles recently conducted a Smart TV Buyer Insights Survey in which we asked over 3,000 respondents about the TV they own, aspects they look at on a new TV, and their TV buying preferences.
Epistemic Interaction - tuning interfaces to provide information for AI supportAlan Dix
Â
Paper presented at SYNERGY workshop at AVI 2024, Genoa, Italy. 3rd June 2024
https://alandix.com/academic/papers/synergy2024-epistemic/
As machine learning integrates deeper into human-computer interactions, the concept of epistemic interaction emerges, aiming to refine these interactions to enhance system adaptability. This approach encourages minor, intentional adjustments in user behaviour to enrich the data available for system learning. This paper introduces epistemic interaction within the context of human-system communication, illustrating how deliberate interaction design can improve system understanding and adaptation. Through concrete examples, we demonstrate the potential of epistemic interaction to significantly advance human-computer interaction by leveraging intuitive human communication strategies to inform system design and functionality, offering a novel pathway for enriching user-system engagements.
Neuro-symbolic is not enough, we need neuro-*semantic*Frank van Harmelen
Â
Neuro-symbolic (NeSy) AI is on the rise. However, simply machine learning on just any symbolic structure is not sufficient to really harvest the gains of NeSy. These will only be gained when the symbolic structures have an actual semantics. I give an operational definition of semantics as âpredictable inferenceâ.
All of this illustrated with link prediction over knowledge graphs, but the argument is general.
Neuro-symbolic is not enough, we need neuro-*semantic*
Â
CART Classification and Regression Trees Experienced User Guide
1. CART Modeling Strategies Slide 1
CART Modeling Strategies For
Experienced Data Analysts
CART Modeling Strategies For
Experienced Data Analysts
⢠CART takes a significant step towards
automated data analysis
â One of CARTâs predecessors was called
AAutomatic IInteraction DDetector (AIDAID)
⢠Nevertheless, high quality CART results
require careful planning & expert guidance
⢠No realistic prospect that CART analyses or
any other sophisticated modeling can be
automated in the near term
2. CART Modeling Strategies Slide 2
All Data analysis, regardless
of methods employed, have
certain prerequisites
All Data analysis, regardless
of methods employed, have
certain prerequisites
⢠Complete understanding of the data
available
â Correct variable definitions
â Sample sources and relationship to study
population
â Review of conventional summary statistics,
percentiles
â Standard reports that would be generated in the
process of data integrity checks
â Calculations verified: check that totals can be
generated from components
â Consistency checks: related fields do not conflict
3. CART Modeling Strategies Slide 3
Careful data preparationCareful data preparation
⢠CART is far better suited to dirty data analysis
than conventional statistical modeling or NN tools
â capable of dealing with missing values, outliers
⢠Nevertheless, considerable benefits to proper
data preparation
â the better the data the better a model can perform
⢠Includes
â correct identification of missing value codes (998
valid or .)
â uniform data handling when records come from
different entities (branches, regions, behavioral
groups)
â if responder data is processed separately from and
differently than non-responder data, completely
erroneous results will be produced
4. CART Modeling Strategies Slide 4
Some core preparatory stepsSome core preparatory steps
⢠Identify illegal variables to be excluded from all
models
â ID variables
â post event variables
â variables unlikely to be available in future, or
against which CART model is intended to compete
(eg Bankruptcy scores)
â variables disallowed by regulators (banking,
insurance)
â variables derived in part from dependent variables,
or generated from target variable behavior
â variables too closely connected to target for any
reason
5. CART Modeling Strategies Slide 5
Exploratory Data Analysis with
CART:
Pre-modeling
Exploratory Data Analysis with
CART:
Pre-modeling
⢠Run a single split tree and report all competitors
â ranks ability of all variables to separate target
variable into homogeneous groups
â command settings
LIMIT DEPTH=1
ERROR EXPLORE
BOPTIONS COMPETITORS=large number
⢠Run limited depth trees for target using one
predictor at a time (again exploratory--non-tested
trees)
â LIMIT DEPTH=2 (up to 4 nodes) or LIMIT DEPTH=3
(up to 8 nodes) (actual number depends on
redundant node pruning)
â provides optimal binning of variables
â binned versions could be used in parametric models
6. CART Modeling Strategies Slide 6
The CART Non-linear
Correlation Matrix
The CART Non-linear
Correlation Matrix
⢠Run CART models using every pair of legal
variables
â should be unlimited depth
â could be tested or exploratory
â will detect non-linear dependencies
⢠Results will be asymmetric
â results can be used to fill out a correlation matrix
⢠Alternate Procedure
â run simple regressions using all pairs of variables
â use CART to predict residuals
â correlation determined by both linear and CART
components
7. CART Modeling Strategies Slide 7
Example Pearson and CART
correlation Matrices
Example Pearson and CART
correlation Matrices
⢠From Kerry
8. CART Modeling Strategies Slide 8
CART Affiliation MatricesCART Affiliation Matrices
⢠Select a group of interesting variables
⢠Let each variable in turn be the target variable,
all others in group are predictors
⢠Grow standard trees (not depth limited) with test
procedure to prune
⢠Each column in matrix is a target variable
⢠Rows are filled with importance scores (scaled to
0,1)
⢠Provides a picture of variable interdependencies
⢠Can highlight surprise relationships between
predictors
â can help in detecting data errors
â when affiliations stringer or weaker than expected
9. CART Modeling Strategies Slide 9
Detection of multivariate
outliers
Detection of multivariate
outliers
⢠Grow CART tree for every variable as
predicted by a trimmed down variable list
⢠Predict each variable in turn from all other
variables
⢠Restrict trees to moderate to large terminal
nodes
â use ATOM or MINCHILD controls
⢠For regression: measure deviation of each
data point from predicted
⢠For classification: check if class value of
data point is rare in predicted terminal node
⢠Use results to investigate unusual
observations
10. CART Modeling Strategies Slide 10
Once data QC is complete
serious CART modeling can
begin
Once data QC is complete
serious CART modeling can
begin
⢠Need to understand nature of problem:
â what would be the appropriate statistical models to
use for problem at hand
â e.g. is problem a simple binary outcome (respond or
not to a direct mail piece)
â alternatively, does it have an inherent time
dimension (how long will customer remain customer
-- telecommunications churn)
latter problem involves censored data
â is study of a fundamentally time series or panel data
type
â then need to allow for lagged variables, etc.
11. CART Modeling Strategies Slide 11
CART cannot protect you from
using an improper analysis
strategy
CART cannot protect you from
using an improper analysis
strategy
⢠CART will help you execute your analysis strategy
more quickly and often more accurately
⢠If the modeling strategy you have selected will
produce biased results CART may just exacerbate
the problem
⢠A definitive modeling approach is not required,
but a defensible approach is
12. CART Modeling Strategies Slide 12
Example: Targeting model for a
catalog to maximize profit
Example: Targeting model for a
catalog to maximize profit
⢠Sensible to model in stages
â 1) yes/no response model: use classification tree
â 2) Dollar volume of order for those who do respond
modeled conditional on response=yes
modeled just on subset of responders
regression tree plausible
or classification tree on binned order amounts
â Final model could be an expected profit model
prob(respond)*Expected(Revenue| Respond)
model could be all CART, all logit, or a mixture
such models discussed later
13. CART Modeling Strategies Slide 13
Modeling strategy will also
dictate test strategy
Modeling strategy will also
dictate test strategy
⢠Suppose we are tracking purchase behavior over
time
⢠Data organized as one record per purchase
opportunity
⢠The unit of observation will be a complete case
history
â ideally will want to assign some complete case
histories to training data
â other entire case histories to test data
â important not to allow random assignment between
train and test on a record by record basis
â might want to hold back some records from longer
case histories as an additional source of test data
14. CART Modeling Strategies Slide 14
Initial CART analyses are
strictly exploratory
Initial CART analyses are
strictly exploratory
⢠Intended to reveal summary and descriptive
information about the data
⢠Omnibus Model: dependent variable(s) fit to
virtually all legal variables
â Certain obvious exclusions necessary: ID
numbers, clones and transforms of the dependent
variable as discussed above
â Omnibus Model reveals something about the
predictability of the dependent variable
â recall that largest tree has error no more than
twice Bayes rate
15. CART Modeling Strategies Slide 15
Determine Splitting Rule to
Use
Determine Splitting Rule to
Use
⢠Gini, Twoing, power modified Twoing for
classification
â possibly ordered twoing
⢠Least squares (LS) or Least Absolute Deviation
(LAD) for regression
⢠Best splitting rule can be selected very early in
project and typically does not have to be revisited
16. CART Modeling Strategies Slide 16
Assess agreement among
different test methods
Assess agreement among
different test methods
⢠If data set is small cross validation is required
⢠In this case rerun trees several times with
different starting random number seeds
â use to assess stability of size and error rate of best
trees
⢠With large data sets reassign cases between
learn and test several times
â initial check is on error rates and sizes of best trees
17. CART Modeling Strategies Slide 17
Run all as batch of startup
CART trees
Run all as batch of startup
CART trees
⢠Using three or four splitting rules, and three or
four test sets will get some initial feel for
predictability of target variable
⢠Useful to develop some text processing scripts to
extract components of the classic CART reports
most interesting
â tree sequence
â misclassification results (which classes are wrong)
â prediction success table
â importance rankings
latter can be aggregated as follows:
add up all importance scores for each variable across
all trees
rescale so that highest score is 100
⢠LOPTION NOPRINT gives summary tables only
â no tree detail; very helpful when trees tend to be
18. CART Modeling Strategies Slide 18
Derived variables almost
certainly need to be created
Derived variables almost
certainly need to be created
⢠Almost impossible to develop high performance
models without analyst creation of derived
variables
⢠Many derived variables are âobviousâ to domain
specialists
â to predict purchase amounts look at customer
lifetime totals
â possibly aggregate previous purchases into
category subtotals
â calculate trend; have orders been increasing or
decreasing over time?
⢠Consider standard statistical summaries of
groups of variables:
â mean, standard deviation, min, max, trend
19. CART Modeling Strategies Slide 19
Use linear combination splits
to search for new derived
variables
Use linear combination splits
to search for new derived
variables
⢠Linear combinations found by CART can suggest
new derived variables
⢠Recommend that the delete option be set high
and that the required sample size also be
substantial
⢠LINEAR N=1000 DELETE=.4
â permits linear combination splits only in nodes with
more than 1,000 cases
â the higher the DELETE parameter the fewer terms in
the combination
⢠E.g.
20. CART Modeling Strategies Slide 20
Results of first models are
used to generate the first cut
back list of predictors
Results of first models are
used to generate the first cut
back list of predictors
⢠List is determined through a combination of
judgment and perusal of initial CART runs
⢠Purpose is error avoidance, exclusion of
nuisance, pernicious and not believable variables
⢠Variables that seem odd in the context, and thus
probably should not have predictive value also
excluded
â Important not to exclude any variables that prior
knowledge, conventional wisdom would include
â Purpose of this stage is not radical pruning but
elimination of valueless variables
21. CART Modeling Strategies Slide 21
Can be useful to explore trees
for selected predictor variables
or other variables of interest
Can be useful to explore trees
for selected predictor variables
or other variables of interest
⢠Can think of the CART tree as an extended
non-parametric version of correlation
analysis
⢠Results simply reveal what variables are in
some way associated in the data
⢠Could construct a table of variables in the
columns against variables that predict in
the rows
22. CART Modeling Strategies Slide 22
Same procedure could be
used to impute values
for missing data points
Same procedure could be
used to impute values
for missing data points
⢠Actual procedure is complex and will be
discussed in another context
⢠Our proposed missing value imputation
procedure is iterative
⢠Also might start selecting complexity values
that restrain growth of trees to reasonable
sizes
â A large data set might allow trees with many
hundreds of terminal nodes
â Yet optimal models might fall into the 20-100
terminal node size
23. CART Modeling Strategies Slide 23
Next set of models should
explore the impact of
alternative splitting and testing
rules
Next set of models should
explore the impact of
alternative splitting and testing
rules
⢠Useful to look at GINI, TWOING, and
TWOING POWER=1
⢠Useful to compare external test data with
cross-validation in smaller data sets
⢠These runs may suggest which splitting
rules are most promising for further work
⢠In most problems the default GINI is the
best rule to use
â Definitively better than ENTROPY, often slightly
better than TWOING
24. CART Modeling Strategies Slide 24
Impact of alternative splitting
and testing rules; continued
Impact of alternative splitting
and testing rules; continued
⢠In some problems, usually problems with
poor predictability, TWOING, POWER=1
works well
â e.g. Relative error in best GINI tree is .8 or
higher
â In these cases, the more balanced splitting
strategy seems to yield better trees
25. CART Modeling Strategies Slide 25
Also want to compare results
from different test procedures
Also want to compare results
from different test procedures
⢠Compare runs with different subsets of test
data randomly chosen from larger data sets
⢠e.g., Create two uniform random variables
â %LET TEST20A=urn <0.20
â %LET TEST20B=urn >0.20
â Use TEST20A to pick out test sample in one run
and use TEST20B in another run
26. CART Modeling Strategies Slide 26
We hope results will be very
similar across test sets
We hope results will be very
similar across test sets
⢠Approximate size of optimal tree
⢠Approximate relative error
⢠Importance ranking of variables â which
variables appear near top of list
⢠Reasonable overlap of primary splitters in
trees
27. CART Modeling Strategies Slide 27
Instability of results across test
data sets is a warning sign
Instability of results across test
data sets is a warning sign
⢠May need to carefully review interdependencies
of predictor variables
⢠Results may be due to a set of closely competing
predictors with different information content
⢠If so, will want to consider whether one or more of
these competitors should be dropped
⢠In this case, a judgment is made concerning
variables to exclude from the model
⢠Results may be unstable due to inherent variance
of the tree predictor
⢠In this case, will ultimately want to consider
aggregation of experts discussed below
28. CART Modeling Strategies Slide 28
Experiments with Linear
Combination Splits
Experiments with Linear
Combination Splits
⢠Linear combinations are occasionally instructive
⢠Not useful when many variables are involved
⢠We recommend restriction to 2-variable linear
combinations
⢠Helpful if there are strictly positive variables
transformed to logs
â 2-variable linear combination might reveal a form
like
c1*log (X1) - c2*log(X2) ,
which is a ratio of the predictors
29. CART Modeling Strategies Slide 29
Reading CART resultsReading CART results
⢠Useful to prepare a series of summary reports
after CART runs are done
⢠One report should just include the TREE
SEQUENCE
â Reveals the size of the optimal tree, relative error
rate
â Can be used to reject certain runs â too large, too
small, too inaccurate
⢠Another report extracts just the split variables:
â Contains a listing of the node split variables
â Provides an brief outline of how the tree evolved
30. CART Modeling Strategies Slide 30
Reports are used to select
trees that appear to be
promising
Reports are used to select
trees that appear to be
promising
⢠It is possible that no promising trees are
found in the early rounds of analysis
⢠Attractive trees need to be printed to
facilitate absorption of the implicit model
31. CART Modeling Strategies Slide 31
Currently we use
allCLEAR to print
Currently we use
allCLEAR to print
⢠Future CART will include its own pretty print but
will still support allCLEAR
⢠We request the âsplitsâ level of detail in the
output
â Includes split variable, split value, class assignment
â Table of class distribution in the node might be too
voluminous
32. CART Modeling Strategies Slide 32
Trees need to be read for
the story they tell and
assessed for plausibility
Trees need to be read for
the story they tell and
assessed for plausibility
⢠Particularly at the higher levels of the tree
(lower levels might disappear with pruning)
⢠Does the predictive model agree with
intuition and prior expectations?
33. CART Modeling Strategies Slide 33
When troubling patterns
emerge, need to look at the
competitors of a node
When troubling patterns
emerge, need to look at the
competitors of a node
⢠Reveals what other variable would be used to
split the node if the main splitter were not
available
⢠If the competitor is more acceptable than the
primary in a node can consider dropping the
primary
⢠Method will only work if analyst is willing to
exclude the variable from anywhere in the tree
⢠On the basis of these reports and prints can
determine candidate second round models
34. CART Modeling Strategies Slide 34
Now can move on to tools
for model refinement
Now can move on to tools
for model refinement
⢠Selection of right-sized trees based on
judgment
⢠Altering costs of misclassification
⢠Creation of new variables
35. CART Modeling Strategies Slide 35
Judgmental Pruning of Trees:
A necessary step in
model development
Judgmental Pruning of Trees:
A necessary step in
model development
⢠When the CART monograph was published in
1984 the authors suggested that the best tree
was the âone-se-rule treeâ
⢠This is the smallest tree within one standard
error of the minimum cost tree
⢠The reasoning was: all trees within a one
standard error band are statistically
indistinguishable, and small trees are
inherently more comprehensible and preferable
36. CART Modeling Strategies Slide 36
Judgmental Pruning of Trees:
continued
Judgmental Pruning of Trees:
continued
⢠The current view of the CART originators is that
one should accept the literal minimum cost tree
produced by CART
⢠This view is based on a further dozen years of
experience which has revealed that the âone-
se-ruleâ may be too conservative
⢠Nonetheless, compelling reasons exist to prefer
smaller trees in data-mining investigations
37. CART Modeling Strategies Slide 37
In data-mining exercises
trees can easily grow to
unmanageable depths
In data-mining exercises
trees can easily grow to
unmanageable depths
⢠With the prodigious volumes of warehoused data, greedy
analysis tools can develop complex models without
restraint
⢠Paradoxically, the large quantities of data can serve to
mislead
⢠The problem is similar to that noted by statisticians who
first analyzed large national probability sample
databases: in regression, t-test, and chi-square tests,
almost every estimated coefficient is âsignificantlysignificantlyâ
different from zero, and every null is rejected
⢠In the tree-growing context, elaborate trees of great
depth appear to perform extremely well even on
independent hold-out samples
38. CART Modeling Strategies Slide 38
A way to âdiscountâ
findings based on very
large data sets is needed
A way to âdiscountâ
findings based on very
large data sets is needed
⢠The solution in the conventional modeling context
has been to adjust the significance level required
before placing too much faith in a finding
⢠For example, a t-statistic of 2.2 for a regression
coefficient based on 30 degrees of freedom
should be considered more compelling than the
same t-statistic based on 100,000 degrees of
freedom
⢠In the CART context it would be useful to have
optimal tree size selection criteria that adapted to
the volume of data available
39. CART Modeling Strategies Slide 39
Three tools for adjusting
an analysis to data richness
are available in CART
Three tools for adjusting
an analysis to data richness
are available in CART
⢠The ATOM or minimum node size available
for splitting: as the data set size increases,
ATOM size can also be increased (perhaps
with the log of sample size)
â The thinking is: as data sets increase in size,
require the amount of data needed to support a
split to increase also
40. CART Modeling Strategies Slide 40
Three tools for adjusting
an analysis; continued
Three tools for adjusting
an analysis; continued
⢠The minimum child size can also be adjusted.
MINCHILD prevents CART from splitting off nodes too
small to support separate analysis
â For example, we might not want to attempt inferring the
probability of prepay in any node containing less than 100
observations
â MINCHILD and ATOM are closely related but are different
concepts. MINCHILD guarantees that no terminal node will
ever be smaller than its predetermined value. ATOM
determines the minimum size of a node that is eligible to
be split. ATOM must always be at least 2*MINCHILD so
that if the smallest node eligible for splitting is split into
two equal parts, each part will be at least as large as
MINCHILD.
⢠Trees other than the âoptimalâ tree can be PICKED from
the tree sequence
41. CART Modeling Strategies Slide 41
The third tool is selection of a
tree from the CART sequence
The third tool is selection of a
tree from the CART sequence
⢠Analyst intervention in tree selection is both
desirable and unavoidable
⢠Allows the incorporation of prior knowledge and
domain expertise
⢠This type of selection is really just pruning: the
analyst decides to prune back further than the CART
algorithms recommend
⢠Topic is mentioned briefly in the CART monograph
where the authors discuss their decision to eliminate
one or two nodes near the bottom of a medical
diagnosis tree:
â MDâs running the study did not believe that these lower
level splits captured the underlying biology
⢠This is similar to a statistician deciding to exclude a
borderline significant interaction in a regression
42. CART Modeling Strategies Slide 42
In the data-mining context,
tree selection can be guided by
the relative error plot
In the data-mining context,
tree selection can be guided by
the relative error plot
⢠Each CART run produces a plot of relative error
against number of nodes and the relative error is
printed on the TREE SEQUENCE report
⢠In data mining these plots have a characteristic
shape: steep declines in the relative error as tree
initially evolves followed by lengthy flat portions in
which further error reduction is extremely small with
each additional node
⢠Further, the test data support the hypothesis that
many of these error reductions are âstatisticallystatistically
significantsignificant.â In the CART context the claim is that the
more complex larger trees will predict well on fresh
data and thus contain valuable information.
43. CART Modeling Strategies Slide 43
An analyst could defensibly
decide to trade off a large
block
of nodes for a small âincreaseâ
in prediction error
An analyst could defensibly
decide to trade off a large
block
of nodes for a small âincreaseâ
in prediction error⢠In one of our CART models the âoptimaloptimalâ tree had
100 terminal nodes and a relative error of 0.333968
+/- 0.00578
⢠Yet the sub-tree with 63 terminal nodes only has a
relative error of 0.34339, a one-point apparent loss
in accuracy.
⢠And 29 terminal nodes yield a relative error of .
38564
44. CART Modeling Strategies Slide 44
Final tree selection based on
the relative error plot alone
Final tree selection based on
the relative error plot alone
⢠In many applications it will be difficult to
make a final tree selection based on the
relative error plot alone
⢠The plot reveals many opportunities for
selection, but rarely serves to single out a
best tree
⢠In some problems it is possible to find the
tree that exhausts all substantial
improvements and that separates a steeply
sloping section from a flat plateau
45. CART Modeling Strategies Slide 45
The next step of tree
assessment
The next step of tree
assessment
⢠Carefully review of a relatively large tree
chosen by CART
⢠Examination of a large tree node-by-node
will be very instructive
⢠We are assuming that the early splits of the
tree have already been examined and found
to be convincing and acceptable
46. CART Modeling Strategies Slide 46
Review of a relatively large
tree chosen by CART
Review of a relatively large
tree chosen by CART
⢠Purpose of this stage of review is to consider the
lower branches:
â Do any of the splits appear fortuitous or not
particularly believable?
â Are the same variables being used repeatedly to
minutely subdivide a predictor?
â Is it worth pursuing additional refinement of the sub-
sample reached at a particular juncture in the tree?
â Is there any concern for whatever reason that the
splits are not reasonable representations of reality?
47. CART Modeling Strategies Slide 47
Additional ConsiderationsAdditional Considerations
⢠The tree that results when questionable or
low value sections of the CART optimal tree
are dropped should be considered
â Unfortunately, there appears to be no substitute for
the careful and detailed examination of the CART
tree node-by-node
â However, the only contribution of judgment here is
to eliminate nodes that are thought to be the result
of over-fitting
48. CART Modeling Strategies Slide 48
Goodness-Of-Fit Measures
for Classification Trees
in Classic CART
Goodness-Of-Fit Measures
for Classification Trees
in Classic CART
⢠CART classification trees automatically generate
diagnostic reports
â Relative Error Rate for all trees in pruned sequence
â Misclassification Rate By Class for Learn and Test
data
â Misclassification Table: Actual vs. Predicted Class
⢠CART class probability trees display only the
relative error sequence
⢠Although these reports are helpful in sorting out
the most promising trees early on in CART
analyses, they contain far less information than
needed for proper model assessment
49. CART Modeling Strategies Slide 49
Characteristics of the CART
GINI Measure
Characteristics of the CART
GINI Measure
⢠Measure is zero whenever a node is pure
⢠Most CART trees are grown and pruned using the
Gini measure of within node diversity
⢠Gini is largest when distribution of classes in a
node is uniform
⢠CART trees usually grown with priors EQUAL
â Essential to encourage promising tree evolution
when class distribution is skewed
â Practical impact is to make make CART strive for
roughly equal accuracy in all classes
â Priors DATA and priors MIX rarely work well
⢠CART Gini measure will then be priors adjusted
i t pi
i
( )= ââ1 2
50. CART Modeling Strategies Slide 50
One new measure of tree
performance â âRho-squaredRho-squaredâ
One new measure of tree
performance â âRho-squaredRho-squaredâ
⢠Although the growing process is improved
with equal priors, the practical evaluation of
the tree requires using data priors
â Actual node distributions, not priors adjusted
⢠We therefore compute unadjusted Gini for
entire tree and compare this with the Gini
of the root
⢠Provides a measure of the improvement
due to splitting
51. CART Modeling Strategies Slide 51
âRho-squaredRho-squaredâ; continuedâRho-squaredRho-squaredâ; continued
⢠Formal definition of Rho-squared
Rho-squared = 1 - Gini(tree)/Gini(root)
â If Gini(tree)=Gini(root) we have no improvement
and rho-squared=0
â If Gini(tree)=0, meaning all terminal nodes are
perfectly pure, then rho-squared=1
â Thus, rho-squared measures how the gap from
Gini(root) to a Gini of 0 is closed by the model
⢠Can be used to compare competing tree
models
52. CART Modeling Strategies Slide 52
Second new measure
compares learn vs. test class
distribution
in terminal nodes
Second new measure
compares learn vs. test class
distribution
in terminal nodes
⢠Every classification tree generates a distribution
of the dependent variable in each terminal node
⢠This learn data distribution can be compared with
the distribution observed in other data:
â The test data used to calibrate relative error rates
and select the optimal tree
â A test data set independent of both learn and test
data used in the tree modeling
â Data from other sources that are not necessarily
expected to be similar to the tree under study
⢠Might also want to compare the test data with
external data
53. CART Modeling Strategies Slide 53
Performance comparisons
can be summarized in
a chi-square statistic
Performance comparisons
can be summarized in
a chi-square statistic
â If there are K classes then each terminal node
contributes a chi-square statistic with K-1 df
â With T terminal nodes the overall statistic for the
tree has T*(K-1) degrees of freedom
â Can decompose the statistic by node or by class
â Useful when the statistic is large to determine
source of large deviations
Are we fitting badly in a specific subtree?
Are the deviations concentrated in one class?
54. CART Modeling Strategies Slide 54
Class Probability TreesClass Probability Trees
⢠Technically, project Oracle uses class probability
trees for forecasts and simulation
⢠Class probability trees use the same GINI method
for growing
⢠Uses GINI for pruning trees as well
⢠Nevertheless, we used classification trees
throughout and interpreted the results as class
probability trees
⢠Several reasons for this approach
â Classification trees produce misclassification
reports
â Can be guided by variable cost of misclassification
â Class probability trees sometimes much smaller
than classification trees
55. CART Modeling Strategies Slide 55
Class Probability Trees;
continued
Class Probability Trees;
continued
⢠Main problem with class probability trees
â Pruning based on equal priors
â Want pruning based on data priors, not yet possible
in CART
⢠Hence, use of classification tree to allow
judgmental pruning
⢠Nonetheless, looking at class probability tree
sizes can be used to bound right sized tree
⢠Would be desirable to modify CAR to allow
different priors in growing and pruning