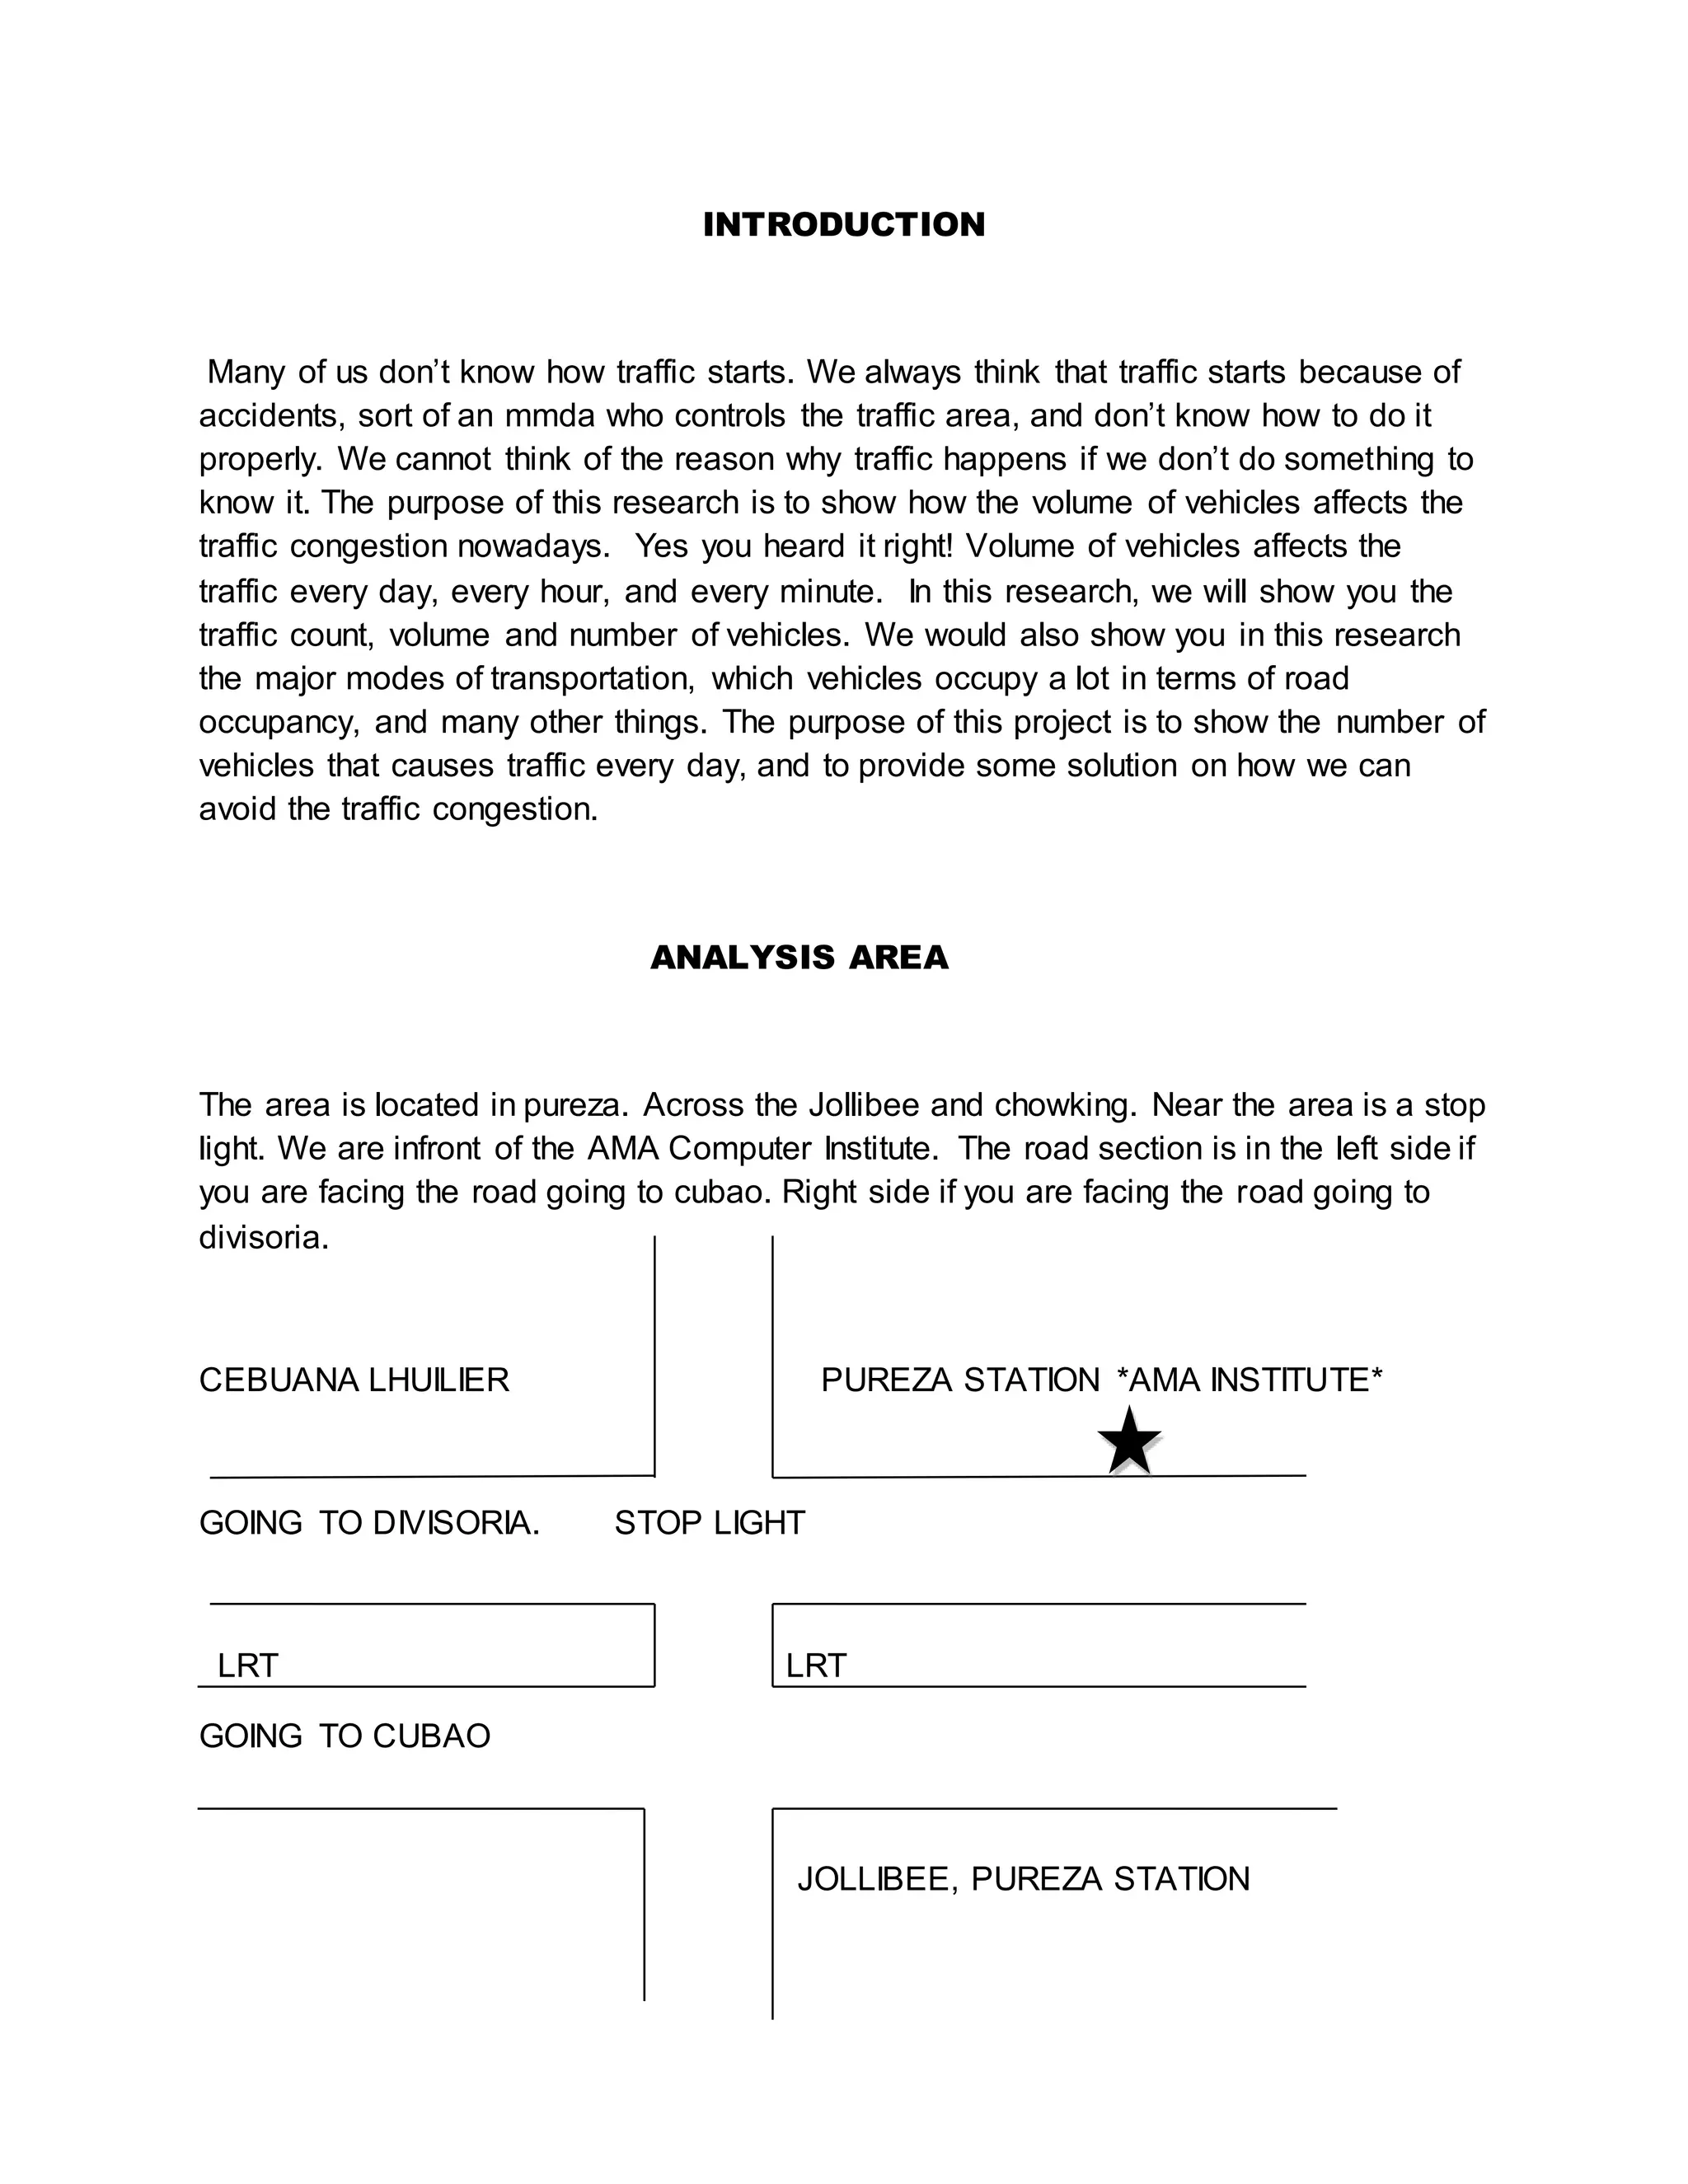
SlideShare a Scribd company logo
TRANSPORTATION DATA ANALYSIS AND INTERPRETATION
TRMA 3063
PROJECT NO.1 – BASIC ROAD TRAFFIC ANALYSIS
Legaspi, Russel
Mercado, Carmina Joy
Cunanan, Miream
Paguia, Donita
Poquez, Frances Ivy
Llamera, Catherine Joyce
Submitted to:
Sir Nabor C. Gaviola
Date:
March 6, 2015
TABLE OF CONTENTS
Main Report:
 Introduction
 Objectives of the Analysis
 Description of the Methodology
Survey results:
 Tally
 Processed data
Analysis of Results
Conclusion
INTRODUCTION
Many of us don’t know how traffic starts. We always think that traffic starts because of
accidents, sort of an mmda who controls the traffic area, and don’t know how to do it
properly. We cannot think of the reason why traffic happens if we don’t do something to
know it. The purpose of this research is to show how the volume of vehicles affects the
traffic congestion nowadays. Yes you heard it right! Volume of vehicles affects the
traffic every day, every hour, and every minute. In this research, we will show you the
traffic count, volume and number of vehicles. We would also show you in this research
the major modes of transportation, which vehicles occupy a lot in terms of road
occupancy, and many other things. The purpose of this project is to show the number of
vehicles that causes traffic every day, and to provide some solution on how we can
avoid the traffic congestion.
ANALYSIS AREA
The area is located in pureza. Across the Jollibee and chowking. Near the area is a stop
light. We are infront of the AMA Computer Institute. The road section is in the left side if
you are facing the road going to cubao. Right side if you are facing the road going to
divisoria.
CEBUANA LHUILIER PUREZA STATION *AMA INSTITUTE*
GOING TO DIVISORIA. STOP LIGHT
LRT LRT
GOING TO CUBAO
JOLLIBEE, PUREZA STATION
OBJECTIVES OF THE ANALYSIS
The objectives of this analysis are to help people know how traffic happens, how
everything affects the road congestion, how the number of road users affects
each other and:
 To know the major modes of transportation along the road area in terms of
vehicular volume
 To know what vehicles occupy the road most of the time
 To know the passenger volume, the ratio of public transport riders to private
vehicle users
 To know the volume capacity ratio of the road section
 To know the degree of traffic congestion on the road section
 To know the traffic condition of a road section regardless of the PUB and PUJ.
METHODOLOGY
 What surveys were undertaken? Describe briefly how and when were the
surveys undertaken.
The surveys we undertake is about the Road Traffic Volume data. It is the process of
counting of vehicles and passengers/pax in one particular place. Traffic volume data are
to be obtained by primary data collection, conducting actual traffic counts.
The location of our survey is at the Pureza Station near AMA. It was made on
February 14, 2015 at 9 am until 11 am. Each group has 6 (six) members, we divided the
types of vehicle. Each member is assigned to one or two vehicles and the pax load on
board in each vehicle.
 Describe the data processing made.
We use tally procedure in counting vehicles and passenger load. It is the total
number of the vehicles and pax. It is the simplest way of procedure to calculate the
total number of vehicles and passenger/pax load.
In using this kind of process you need to enumerate the number of vehicles and
pax load and calculate the total number of it.
 Explain the procedure in doing the traffic analysis.
We’ve divided into several groups. Each group is assigned a road section to be
analyzed. The group members shall conduct the classified traffic volume count,
passenger load count and road inventory.
The survey duration is 2 (two) hours. The traffic volume count shall cover 100%
of the traffic volume passing the assigned road section.
The suggested vehicle classification are private cars/jeep/van, AUV/FX, sedan
taxi, public utility jeepney, mini-bus, public utility bus, truck/trailer, motorcycle,
tricycle and pedicab. The pax load count is conducted at the roadside by cehicle
type. Sampling rate should be at least 20% for Public Utility Jeep, Public Car, FX,
Taxi, and at least 50% for Public Utility Bus, Truck, and Motorcycle.
ANALYSIS OF SURVEY
a.)What are the major modes of transport along the section in terms of
vehicular volume?
The usual modes of transport that covers the section are the motors, jeepneys,
and Taxi’s.
b.) In terms of road occupancy, what are the dominant modes of
transport?
Jeepneys are the most dominant mode of transport in the area.
c. In terms of passenger volume, what is the ratio of public transport
riders to private vehicle users?
The ratio of public transport users to private vehicle users is 2,563:6,943 or
approximately 1:3. This result can show that compared to the riders of our public
transport, private vehicle riders have a greater number.
d. What is the Vehicle Capacity Ratio (VCR) of the road section? In
your observation, what is the degree of traffic congestion of the
section?
The VCR of the road section is 884 vehicles per hour. There are a total of 7,072
vehicles that uses the road on the 2 hour of our observation. The road section has 4
lanes. To get the VCR we divide the total number of vehicle to the number of lanes and
number of hours [v / (L x h)].
Based on our observation there is appropriate or considerable traffic congestion.
Although there’s congestion the vehicles are still moving. So I think the degree of traffic
congestion is at moderate level.
e. If 60% of the PUJ volume were converted to PUB what would be
the impact on the traffic condition of the section? Support your answer
with data.
If 60% of the PUJ will be converted to PUB, the traffic congestion will be
lesser. Based on the data we have PUB operating on our road section has a
lesser volume compare to PUJ, but it is clearer that PUB can transport a bigger
number of passenger. The bus has a total of 47; while the jeepney’s total are
605. It has a great difference, but the pax load has a small difference, the pax
load of PUB is 804 while the PUJ’s pax load is 1,097. Through this data, we can
definitely say that converting the PUJ to PUB can really help in lessening our
road congestion.
PUB can transport a greater number of passenger, thus it has a lower
number of vehicle operating. If we convert jeepney to bus, it can now
accommodate more passengers, meaning we can also reduce its number
because one can already occupy many passengers. 1,097 pax are transported
by 605 jeepneys, but by busses it will only take an approximately 64 more or less
number of PUB. If the vehicles are reduced, then the vehicle using the road will
be lesser, then traffic congestion can be lessen or avoided.
CONCLUSION
The exercise shows that the volume of vehicles has a high impact on traffic
congestion. The high demand of users to public vehicles contributes a lot to the
road occupancy at Pureza road. Every hour there is a huge number of jeepneys
on the road section of Pureza. In that case there is a big tendency of traffic
congestion on the next road section after Pureza area. The vehicles that occupy
a lot space in the road section are the taxis, motorcycles and the jeepneys. So as
we end this survey, we conclude that the vehicles, who occupy a lot in the road
section, are the vehicles that contribute a lot on the traffic in the area.

More Related Content

What's hot

Multimodal Transport in an Indian Perspective
Multimodal Transport in an Indian PerspectiveMultimodal Transport in an Indian Perspective
Multimodal Transport in an Indian Perspective
Farhan Khan
 
An Intro to estimating travel demand
An Intro to estimating travel demandAn Intro to estimating travel demand
An Intro to estimating travel demand
Muhammad Faisal
 
Traffic assignment
Traffic assignmentTraffic assignment
Traffic assignment
MNIT,JAIPUR
 
Transportation Planning & Travel Demand Forecasting (Transportation Engineering)
Transportation Planning & Travel Demand Forecasting (Transportation Engineering)Transportation Planning & Travel Demand Forecasting (Transportation Engineering)
Transportation Planning & Travel Demand Forecasting (Transportation Engineering)
Hossam Shafiq I
 
Screen line and Corrider Line Analysis
Screen line and Corrider Line AnalysisScreen line and Corrider Line Analysis
Screen line and Corrider Line Analysis
Abhishek Kansara
 
Design and analysis of flexible pavement
Design and analysis of flexible pavementDesign and analysis of flexible pavement
Design and analysis of flexible pavement
Devesh Chaurasia
 
Land use transportation relation
Land use  transportation relationLand use  transportation relation
Land use transportation relation
Siddhi Vakharia
 
Pedestrian level of service for crosswalks at urban intersections
Pedestrian level of service for crosswalks at urban intersectionsPedestrian level of service for crosswalks at urban intersections
Pedestrian level of service for crosswalks at urban intersections
THOTA AKHIL
 
Capacity and LOS of Multi-Lane HIghways
Capacity and LOS of Multi-Lane HIghwaysCapacity and LOS of Multi-Lane HIghways
Capacity and LOS of Multi-Lane HIghways
Raghupathi Kandiboina
 
The role of SPV in Transportation Sector
The role of SPV in Transportation SectorThe role of SPV in Transportation Sector
The role of SPV in Transportation SectorJaspal Singh
 
10 Capacity and LOS Analysis for Freeway (Traffic Engineering هندسة المرور & ...
10 Capacity and LOS Analysis for Freeway (Traffic Engineering هندسة المرور & ...10 Capacity and LOS Analysis for Freeway (Traffic Engineering هندسة المرور & ...
10 Capacity and LOS Analysis for Freeway (Traffic Engineering هندسة المرور & ...
Hossam Shafiq I
 
1.TRAFFIC CHARACTERISTICS (TE) 2170613 GTU
1.TRAFFIC CHARACTERISTICS (TE) 2170613 GTU1.TRAFFIC CHARACTERISTICS (TE) 2170613 GTU
1.TRAFFIC CHARACTERISTICS (TE) 2170613 GTU
VATSAL PATEL
 
functions of transportation network-cocncept of accessibility an mobility
functions of transportation network-cocncept of accessibility an mobilityfunctions of transportation network-cocncept of accessibility an mobility
functions of transportation network-cocncept of accessibility an mobility
gayathrysatheesan1
 
Traffic Volume Studies
Traffic Volume StudiesTraffic Volume Studies
Traffic Volume StudiesMd Tanvir Alam
 
L2 Microscopic Traffic Flow Parameters
L2 Microscopic Traffic Flow ParametersL2 Microscopic Traffic Flow Parameters
L2 Microscopic Traffic Flow Parameters
Hossam Shafiq I
 
Study of urban traffic flow
Study of urban traffic flowStudy of urban traffic flow
Study of urban traffic flow
Sukhdeep Jat
 
Traffic volume-study-presentation-final
Traffic volume-study-presentation-finalTraffic volume-study-presentation-final
Traffic volume-study-presentation-final
Stone Rayhan
 
Transportation problems
Transportation problemsTransportation problems
Transportation problems
guru raja
 
Mass transit system
Mass transit systemMass transit system
Mass transit system
Sagar Kaptan
 
Highway Horizontal Alignment
Highway Horizontal AlignmentHighway Horizontal Alignment
Highway Horizontal Alignment
AkshathaBhandary
 

What's hot (20)

Multimodal Transport in an Indian Perspective
Multimodal Transport in an Indian PerspectiveMultimodal Transport in an Indian Perspective
Multimodal Transport in an Indian Perspective
 
An Intro to estimating travel demand
An Intro to estimating travel demandAn Intro to estimating travel demand
An Intro to estimating travel demand
 
Traffic assignment
Traffic assignmentTraffic assignment
Traffic assignment
 
Transportation Planning & Travel Demand Forecasting (Transportation Engineering)
Transportation Planning & Travel Demand Forecasting (Transportation Engineering)Transportation Planning & Travel Demand Forecasting (Transportation Engineering)
Transportation Planning & Travel Demand Forecasting (Transportation Engineering)
 
Screen line and Corrider Line Analysis
Screen line and Corrider Line AnalysisScreen line and Corrider Line Analysis
Screen line and Corrider Line Analysis
 
Design and analysis of flexible pavement
Design and analysis of flexible pavementDesign and analysis of flexible pavement
Design and analysis of flexible pavement
 
Land use transportation relation
Land use  transportation relationLand use  transportation relation
Land use transportation relation
 
Pedestrian level of service for crosswalks at urban intersections
Pedestrian level of service for crosswalks at urban intersectionsPedestrian level of service for crosswalks at urban intersections
Pedestrian level of service for crosswalks at urban intersections
 
Capacity and LOS of Multi-Lane HIghways
Capacity and LOS of Multi-Lane HIghwaysCapacity and LOS of Multi-Lane HIghways
Capacity and LOS of Multi-Lane HIghways
 
The role of SPV in Transportation Sector
The role of SPV in Transportation SectorThe role of SPV in Transportation Sector
The role of SPV in Transportation Sector
 
10 Capacity and LOS Analysis for Freeway (Traffic Engineering هندسة المرور & ...
10 Capacity and LOS Analysis for Freeway (Traffic Engineering هندسة المرور & ...10 Capacity and LOS Analysis for Freeway (Traffic Engineering هندسة المرور & ...
10 Capacity and LOS Analysis for Freeway (Traffic Engineering هندسة المرور & ...
 
1.TRAFFIC CHARACTERISTICS (TE) 2170613 GTU
1.TRAFFIC CHARACTERISTICS (TE) 2170613 GTU1.TRAFFIC CHARACTERISTICS (TE) 2170613 GTU
1.TRAFFIC CHARACTERISTICS (TE) 2170613 GTU
 
functions of transportation network-cocncept of accessibility an mobility
functions of transportation network-cocncept of accessibility an mobilityfunctions of transportation network-cocncept of accessibility an mobility
functions of transportation network-cocncept of accessibility an mobility
 
Traffic Volume Studies
Traffic Volume StudiesTraffic Volume Studies
Traffic Volume Studies
 
L2 Microscopic Traffic Flow Parameters
L2 Microscopic Traffic Flow ParametersL2 Microscopic Traffic Flow Parameters
L2 Microscopic Traffic Flow Parameters
 
Study of urban traffic flow
Study of urban traffic flowStudy of urban traffic flow
Study of urban traffic flow
 
Traffic volume-study-presentation-final
Traffic volume-study-presentation-finalTraffic volume-study-presentation-final
Traffic volume-study-presentation-final
 
Transportation problems
Transportation problemsTransportation problems
Transportation problems
 
Mass transit system
Mass transit systemMass transit system
Mass transit system
 
Highway Horizontal Alignment
Highway Horizontal AlignmentHighway Horizontal Alignment
Highway Horizontal Alignment
 

Viewers also liked

OTM(Oracle Transport Management)
OTM(Oracle Transport Management)OTM(Oracle Transport Management)
OTM(Oracle Transport Management)
Cognizant
 
Oracle Data Guard A to Z
Oracle Data Guard A to ZOracle Data Guard A to Z
Oracle Data Guard A to Z
Zohar Elkayam
 
Modes of Transportation
Modes of TransportationModes of Transportation
Modes of Transportation
Dona Sara Jacob
 
Mode of Transportation
Mode of TransportationMode of Transportation
Mode of Transportation
Mohammad Alfian
 
Transport and Communications Presentation
Transport and Communications PresentationTransport and Communications Presentation
Transport and Communications Presentation
AfricaMattersLtd
 
High Availability And Oracle Data Guard 11g R2
High Availability And Oracle Data Guard 11g R2High Availability And Oracle Data Guard 11g R2
High Availability And Oracle Data Guard 11g R2
Mario Redón Luz
 

Viewers also liked (7)

OTM(Oracle Transport Management)
OTM(Oracle Transport Management)OTM(Oracle Transport Management)
OTM(Oracle Transport Management)
 
Oracle Data Guard A to Z
Oracle Data Guard A to ZOracle Data Guard A to Z
Oracle Data Guard A to Z
 
Modes of Transportation
Modes of TransportationModes of Transportation
Modes of Transportation
 
Mode of Transportation
Mode of TransportationMode of Transportation
Mode of Transportation
 
Transport and Communications Presentation
Transport and Communications PresentationTransport and Communications Presentation
Transport and Communications Presentation
 
Transportation ppt
Transportation pptTransportation ppt
Transportation ppt
 
High Availability And Oracle Data Guard 11g R2
High Availability And Oracle Data Guard 11g R2High Availability And Oracle Data Guard 11g R2
High Availability And Oracle Data Guard 11g R2
 

Similar to Transportation data-analysis-and-interpretation-1

839- Health of Urban Road -Digitaly Published Paper IRF 2017
839- Health of Urban Road -Digitaly Published Paper IRF 2017839- Health of Urban Road -Digitaly Published Paper IRF 2017
839- Health of Urban Road -Digitaly Published Paper IRF 2017
SHRISH VERMA
 
Planning of intermediate transport system for bengaluru metropolitan city to ...
Planning of intermediate transport system for bengaluru metropolitan city to ...Planning of intermediate transport system for bengaluru metropolitan city to ...
Planning of intermediate transport system for bengaluru metropolitan city to ...
eSAT Publishing House
 
The Cause, Effect and Possible Solution to Traffic Congestion on Nigeria Road...
The Cause, Effect and Possible Solution to Traffic Congestion on Nigeria Road...The Cause, Effect and Possible Solution to Traffic Congestion on Nigeria Road...
The Cause, Effect and Possible Solution to Traffic Congestion on Nigeria Road...
inventionjournals
 
Urban transport (MODAL SHIFT ANALYSIS)
Urban transport (MODAL SHIFT ANALYSIS)Urban transport (MODAL SHIFT ANALYSIS)
Urban transport (MODAL SHIFT ANALYSIS)syafiqahbahrin
 
origin and destination survey research papeer
origin and destination survey research papeerorigin and destination survey research papeer
origin and destination survey research papeer
Admeff Construction
 
Major Project ppt.pptx
Major Project ppt.pptxMajor Project ppt.pptx
Major Project ppt.pptx
DeluserDebasish
 
TRAFFIC VOLUME STUDY AT SECTOR 18 NOIDA SECTION AND FUTURE FORECASTING USING ...
TRAFFIC VOLUME STUDY AT SECTOR 18 NOIDA SECTION AND FUTURE FORECASTING USING ...TRAFFIC VOLUME STUDY AT SECTOR 18 NOIDA SECTION AND FUTURE FORECASTING USING ...
TRAFFIC VOLUME STUDY AT SECTOR 18 NOIDA SECTION AND FUTURE FORECASTING USING ...
Sukrati Pandit
 
IRJET- Traffic Study on Mid-Block Section & Intersection
IRJET-  	  Traffic Study on Mid-Block Section & IntersectionIRJET-  	  Traffic Study on Mid-Block Section & Intersection
IRJET- Traffic Study on Mid-Block Section & Intersection
IRJET Journal
 
TRAFFIC ENGINEERING & HIGHWAY DRAINAGE_.pdf
TRAFFIC ENGINEERING & HIGHWAY DRAINAGE_.pdfTRAFFIC ENGINEERING & HIGHWAY DRAINAGE_.pdf
TRAFFIC ENGINEERING & HIGHWAY DRAINAGE_.pdf
Priya Sarita Mane
 
TRAFFIC IMPROVEMENTS FOR SMOOTH MOVEMENT OF TRAFFIC FLOW
TRAFFIC IMPROVEMENTS FOR SMOOTH MOVEMENT OF TRAFFIC FLOWTRAFFIC IMPROVEMENTS FOR SMOOTH MOVEMENT OF TRAFFIC FLOW
TRAFFIC IMPROVEMENTS FOR SMOOTH MOVEMENT OF TRAFFIC FLOW
Abdul Aziz
 
Urban traffic problems and solutions
Urban traffic problems and solutionsUrban traffic problems and solutions
Urban traffic problems and solutions
eSAT Journals
 
Connecting Communities Optimizing Highways Event April 18
Connecting Communities Optimizing Highways Event April 18Connecting Communities Optimizing Highways Event April 18
Connecting Communities Optimizing Highways Event April 18
Adina Levin
 
Moving-About-Paradise
Moving-About-ParadiseMoving-About-Paradise
Moving-About-Paradise
Alan Hoffman
 
Identification of Factors to Improve Public Transit Services (A Case Study of...
Identification of Factors to Improve Public Transit Services (A Case Study of...Identification of Factors to Improve Public Transit Services (A Case Study of...
Identification of Factors to Improve Public Transit Services (A Case Study of...
Dr. Amarjeet Singh
 
The Study of Bus Rapid Transit (BRT) System at University Road Peshawar, Paki...
The Study of Bus Rapid Transit (BRT) System at University Road Peshawar, Paki...The Study of Bus Rapid Transit (BRT) System at University Road Peshawar, Paki...
The Study of Bus Rapid Transit (BRT) System at University Road Peshawar, Paki...
IOSR Journals
 
design of saperate lane for ambulance at high intensity traffic zone
design of saperate lane for ambulance at high intensity traffic zone design of saperate lane for ambulance at high intensity traffic zone
design of saperate lane for ambulance at high intensity traffic zone
ElbichAkhtarkhan
 
Density based-traffic-signal-system
Density based-traffic-signal-systemDensity based-traffic-signal-system
Density based-traffic-signal-system
PAVAN KUMAR ILLA
 
The International Journal of Engineering and Science (The IJES)
The International Journal of Engineering and Science (The IJES)The International Journal of Engineering and Science (The IJES)
The International Journal of Engineering and Science (The IJES)
theijes
 

Similar to Transportation data-analysis-and-interpretation-1 (20)

839- Health of Urban Road -Digitaly Published Paper IRF 2017
839- Health of Urban Road -Digitaly Published Paper IRF 2017839- Health of Urban Road -Digitaly Published Paper IRF 2017
839- Health of Urban Road -Digitaly Published Paper IRF 2017
 
Planning of intermediate transport system for bengaluru metropolitan city to ...
Planning of intermediate transport system for bengaluru metropolitan city to ...Planning of intermediate transport system for bengaluru metropolitan city to ...
Planning of intermediate transport system for bengaluru metropolitan city to ...
 
The Cause, Effect and Possible Solution to Traffic Congestion on Nigeria Road...
The Cause, Effect and Possible Solution to Traffic Congestion on Nigeria Road...The Cause, Effect and Possible Solution to Traffic Congestion on Nigeria Road...
The Cause, Effect and Possible Solution to Traffic Congestion on Nigeria Road...
 
Urban transport (MODAL SHIFT ANALYSIS)
Urban transport (MODAL SHIFT ANALYSIS)Urban transport (MODAL SHIFT ANALYSIS)
Urban transport (MODAL SHIFT ANALYSIS)
 
origin and destination survey research papeer
origin and destination survey research papeerorigin and destination survey research papeer
origin and destination survey research papeer
 
Major Project ppt.pptx
Major Project ppt.pptxMajor Project ppt.pptx
Major Project ppt.pptx
 
TRAFFIC VOLUME STUDY AT SECTOR 18 NOIDA SECTION AND FUTURE FORECASTING USING ...
TRAFFIC VOLUME STUDY AT SECTOR 18 NOIDA SECTION AND FUTURE FORECASTING USING ...TRAFFIC VOLUME STUDY AT SECTOR 18 NOIDA SECTION AND FUTURE FORECASTING USING ...
TRAFFIC VOLUME STUDY AT SECTOR 18 NOIDA SECTION AND FUTURE FORECASTING USING ...
 
IRJET- Traffic Study on Mid-Block Section & Intersection
IRJET-  	  Traffic Study on Mid-Block Section & IntersectionIRJET-  	  Traffic Study on Mid-Block Section & Intersection
IRJET- Traffic Study on Mid-Block Section & Intersection
 
TRAFFIC ENGINEERING & HIGHWAY DRAINAGE_.pdf
TRAFFIC ENGINEERING & HIGHWAY DRAINAGE_.pdfTRAFFIC ENGINEERING & HIGHWAY DRAINAGE_.pdf
TRAFFIC ENGINEERING & HIGHWAY DRAINAGE_.pdf
 
TRAFFIC IMPROVEMENTS FOR SMOOTH MOVEMENT OF TRAFFIC FLOW
TRAFFIC IMPROVEMENTS FOR SMOOTH MOVEMENT OF TRAFFIC FLOWTRAFFIC IMPROVEMENTS FOR SMOOTH MOVEMENT OF TRAFFIC FLOW
TRAFFIC IMPROVEMENTS FOR SMOOTH MOVEMENT OF TRAFFIC FLOW
 
A2114065115
A2114065115A2114065115
A2114065115
 
paper 170
paper 170paper 170
paper 170
 
Urban traffic problems and solutions
Urban traffic problems and solutionsUrban traffic problems and solutions
Urban traffic problems and solutions
 
Connecting Communities Optimizing Highways Event April 18
Connecting Communities Optimizing Highways Event April 18Connecting Communities Optimizing Highways Event April 18
Connecting Communities Optimizing Highways Event April 18
 
Moving-About-Paradise
Moving-About-ParadiseMoving-About-Paradise
Moving-About-Paradise
 
Identification of Factors to Improve Public Transit Services (A Case Study of...
Identification of Factors to Improve Public Transit Services (A Case Study of...Identification of Factors to Improve Public Transit Services (A Case Study of...
Identification of Factors to Improve Public Transit Services (A Case Study of...
 
The Study of Bus Rapid Transit (BRT) System at University Road Peshawar, Paki...
The Study of Bus Rapid Transit (BRT) System at University Road Peshawar, Paki...The Study of Bus Rapid Transit (BRT) System at University Road Peshawar, Paki...
The Study of Bus Rapid Transit (BRT) System at University Road Peshawar, Paki...
 
design of saperate lane for ambulance at high intensity traffic zone
design of saperate lane for ambulance at high intensity traffic zone design of saperate lane for ambulance at high intensity traffic zone
design of saperate lane for ambulance at high intensity traffic zone
 
Density based-traffic-signal-system
Density based-traffic-signal-systemDensity based-traffic-signal-system
Density based-traffic-signal-system
 
The International Journal of Engineering and Science (The IJES)
The International Journal of Engineering and Science (The IJES)The International Journal of Engineering and Science (The IJES)
The International Journal of Engineering and Science (The IJES)
 

Transportation data-analysis-and-interpretation-1

  • 1. TRANSPORTATION DATA ANALYSIS AND INTERPRETATION TRMA 3063 PROJECT NO.1 – BASIC ROAD TRAFFIC ANALYSIS Legaspi, Russel Mercado, Carmina Joy Cunanan, Miream Paguia, Donita Poquez, Frances Ivy Llamera, Catherine Joyce Submitted to: Sir Nabor C. Gaviola Date: March 6, 2015
  • 2. TABLE OF CONTENTS Main Report:  Introduction  Objectives of the Analysis  Description of the Methodology Survey results:  Tally  Processed data Analysis of Results Conclusion
  • 3. INTRODUCTION Many of us don’t know how traffic starts. We always think that traffic starts because of accidents, sort of an mmda who controls the traffic area, and don’t know how to do it properly. We cannot think of the reason why traffic happens if we don’t do something to know it. The purpose of this research is to show how the volume of vehicles affects the traffic congestion nowadays. Yes you heard it right! Volume of vehicles affects the traffic every day, every hour, and every minute. In this research, we will show you the traffic count, volume and number of vehicles. We would also show you in this research the major modes of transportation, which vehicles occupy a lot in terms of road occupancy, and many other things. The purpose of this project is to show the number of vehicles that causes traffic every day, and to provide some solution on how we can avoid the traffic congestion. ANALYSIS AREA The area is located in pureza. Across the Jollibee and chowking. Near the area is a stop light. We are infront of the AMA Computer Institute. The road section is in the left side if you are facing the road going to cubao. Right side if you are facing the road going to divisoria. CEBUANA LHUILIER PUREZA STATION *AMA INSTITUTE* GOING TO DIVISORIA. STOP LIGHT LRT LRT GOING TO CUBAO JOLLIBEE, PUREZA STATION
  • 4. OBJECTIVES OF THE ANALYSIS The objectives of this analysis are to help people know how traffic happens, how everything affects the road congestion, how the number of road users affects each other and:  To know the major modes of transportation along the road area in terms of vehicular volume  To know what vehicles occupy the road most of the time  To know the passenger volume, the ratio of public transport riders to private vehicle users  To know the volume capacity ratio of the road section  To know the degree of traffic congestion on the road section  To know the traffic condition of a road section regardless of the PUB and PUJ. METHODOLOGY  What surveys were undertaken? Describe briefly how and when were the surveys undertaken. The surveys we undertake is about the Road Traffic Volume data. It is the process of counting of vehicles and passengers/pax in one particular place. Traffic volume data are to be obtained by primary data collection, conducting actual traffic counts. The location of our survey is at the Pureza Station near AMA. It was made on February 14, 2015 at 9 am until 11 am. Each group has 6 (six) members, we divided the types of vehicle. Each member is assigned to one or two vehicles and the pax load on board in each vehicle.  Describe the data processing made. We use tally procedure in counting vehicles and passenger load. It is the total number of the vehicles and pax. It is the simplest way of procedure to calculate the total number of vehicles and passenger/pax load. In using this kind of process you need to enumerate the number of vehicles and pax load and calculate the total number of it.  Explain the procedure in doing the traffic analysis.
  • 5. We’ve divided into several groups. Each group is assigned a road section to be analyzed. The group members shall conduct the classified traffic volume count, passenger load count and road inventory. The survey duration is 2 (two) hours. The traffic volume count shall cover 100% of the traffic volume passing the assigned road section. The suggested vehicle classification are private cars/jeep/van, AUV/FX, sedan taxi, public utility jeepney, mini-bus, public utility bus, truck/trailer, motorcycle, tricycle and pedicab. The pax load count is conducted at the roadside by cehicle type. Sampling rate should be at least 20% for Public Utility Jeep, Public Car, FX, Taxi, and at least 50% for Public Utility Bus, Truck, and Motorcycle.
  • 6. ANALYSIS OF SURVEY a.)What are the major modes of transport along the section in terms of vehicular volume? The usual modes of transport that covers the section are the motors, jeepneys, and Taxi’s. b.) In terms of road occupancy, what are the dominant modes of transport? Jeepneys are the most dominant mode of transport in the area. c. In terms of passenger volume, what is the ratio of public transport riders to private vehicle users? The ratio of public transport users to private vehicle users is 2,563:6,943 or approximately 1:3. This result can show that compared to the riders of our public transport, private vehicle riders have a greater number. d. What is the Vehicle Capacity Ratio (VCR) of the road section? In your observation, what is the degree of traffic congestion of the section? The VCR of the road section is 884 vehicles per hour. There are a total of 7,072 vehicles that uses the road on the 2 hour of our observation. The road section has 4 lanes. To get the VCR we divide the total number of vehicle to the number of lanes and number of hours [v / (L x h)]. Based on our observation there is appropriate or considerable traffic congestion. Although there’s congestion the vehicles are still moving. So I think the degree of traffic congestion is at moderate level. e. If 60% of the PUJ volume were converted to PUB what would be the impact on the traffic condition of the section? Support your answer with data. If 60% of the PUJ will be converted to PUB, the traffic congestion will be lesser. Based on the data we have PUB operating on our road section has a
  • 7. lesser volume compare to PUJ, but it is clearer that PUB can transport a bigger number of passenger. The bus has a total of 47; while the jeepney’s total are 605. It has a great difference, but the pax load has a small difference, the pax load of PUB is 804 while the PUJ’s pax load is 1,097. Through this data, we can definitely say that converting the PUJ to PUB can really help in lessening our road congestion. PUB can transport a greater number of passenger, thus it has a lower number of vehicle operating. If we convert jeepney to bus, it can now accommodate more passengers, meaning we can also reduce its number because one can already occupy many passengers. 1,097 pax are transported by 605 jeepneys, but by busses it will only take an approximately 64 more or less number of PUB. If the vehicles are reduced, then the vehicle using the road will be lesser, then traffic congestion can be lessen or avoided. CONCLUSION The exercise shows that the volume of vehicles has a high impact on traffic congestion. The high demand of users to public vehicles contributes a lot to the road occupancy at Pureza road. Every hour there is a huge number of jeepneys on the road section of Pureza. In that case there is a big tendency of traffic congestion on the next road section after Pureza area. The vehicles that occupy a lot space in the road section are the taxis, motorcycles and the jeepneys. So as we end this survey, we conclude that the vehicles, who occupy a lot in the road section, are the vehicles that contribute a lot on the traffic in the area.