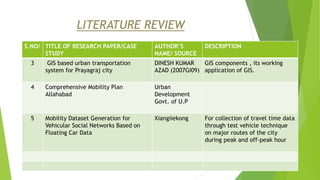
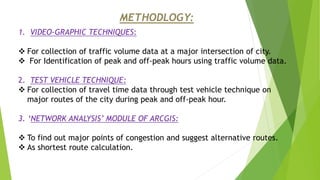
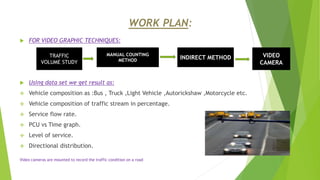
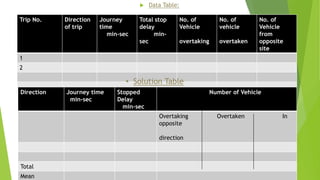
ROUTE OPTIMIZATION USING NETWORK ANALYST
TOOLS OF ARCGIS FOR PRAYAGRAJ CITY.
Summited by: PRABHAT KUMAR
Reg. No: 2019TR05
)
M.TECH THESIS ON
INTRODUCTION:
PRAYAGRAJ CITY:
 Prayagraj is one of the major cities of Uttar Pradesh.
 Prayagraj over the last few years has undergone widespread urbanization owing to increased
industrialization and motorization.
 Travel demands have grown faster than the population and expansion of the city, resulting in
increased movement between the city center.
 The resultant outcomes have been increasing congestion, increase in the number of accidents and
rising pollution levels.
 In light of these, the city of Prayagraj is attempting to develop an integrated solution to meet its
accessibility and mobility needs.
OBJECTIVES:
 .Generation of database comprising of spatial and non-spatial (associated attribute
data) data in form of network dataset that can be input for network analysis module of
ARCGIS for information dissemination and analysis of collected data for the study area.
 Collection of traffic volume data at a major intersection of city using video-graphic
techniques.
 Indentification of peak and off-peak hours using traffic volume data.
 Collection of travel time data through test vehicle technique on major routes of the
city during peak and off-peak hour.
 Development of historical traffic data of city (developed from collected travel time
data) to be used with Network dataset in ARCGIS in functionalities of ‘Network
Analysis ‘ module of ArcGIS such as shortest route calculation (date and time specific)
 To find out major points of congestion and suggest alternative routes through ‘Network
Analysis’ module of ArcGIS
LITERATURE REVIEW
S.NO TITLE OF RESEARCH PAPER/CASE
STUDY
AUTHOR’S
NAME/ SOURCE
DESCRIPTION
1 A Video based Vehicle Detection,
Counting and Classification System
; Sania Bhatti*,
Liaquat A.
Thebo**, Mir
Muhammad B.
Talpur** and
Mohsin A.
Memon*
For collection of traffic volume
data at a major intersection of
city.
For Identification of peak and
off-peak hours using traffic
volume data
2 Moving Vehicle Method of Estimating
Traffic Volumes and Speeds
WILLIAM J.
MORTIMER
The techniques presented in this
paper will provide a method of
volume counting
which will require a bare
minimum of manpower and
equipment. It offers a means of
securing economically and
quickly a blanket volume count
of all streets in a given area.
LITERATURE REVIEW
S.NO/ TITLE OF RESEARCH PAPER/CASE
STUDY
AUTHOR’S
NAME/ SOURCE
DESCRIPTION
3 GIS based urban transportation
system for Prayagraj city
DINESH KUMAR
AZAD (2007GI09)
GIS components , its working
application of GIS.
4 Comprehensive Mobility Plan
Allahabad
Urban
Development
Govt. of U.P
5 Mobility Dataset Generation for
Vehicular Social Networks Based on
Floating Car Data
Xiangiiekong For collection of travel time data
through test vehicle technique
on major routes of the city
during peak and off-peak hour
METHODLOGY:
1. VIDEO-GRAPHIC TECHNIQUES:
 For collection of traffic volume data at a major intersection of city.
 For Identification of peak and off-peak hours using traffic volume data.
2. TEST VEHICLE TECHNIQUE:
 For collection of travel time data through test vehicle technique on
major routes of the city during peak and off-peak hour.
3. ‘NETWORK ANALYSIS’ MODULE OF ARCGIS:
 To find out major points of congestion and suggest alternative routes.
 As shortest route calculation.
WORK PLAN:
 FOR VIDEO GRAPHIC TECHNIQUES:
 Using data set we get result as:
 Vehicle composition as :Bus , Truck ,Light Vehicle ,Autorickshaw ,Motorcycle etc.
 Vehicle composition of traffic stream in percentage.
 Service flow rate.
 PCU vs Time graph.
 Level of service.
 Directional distribution.
Video cameras are mounted to record the traffic condition on a road
TRAFFIC
VOLUME STUDY
MANUAL COUNTING
METHOD INDIRECT METHOD VIDEO
CAMERA
WORK PLAN
 TEST VEHICLE: Floating car or riding check method
 One observer is seated in the floating car with two stop watches. One of the stop watch is used to
record the time at various control point like intersections, bridges or any other fixed points in each
trip.
 The other stop watch is used to find the duration of the individual delays. The time, location and
cause of these delays are recorded by the second observer.
 The number of vehicle overtaking the test vehicle and the overtaken by the test vehicle are noted
in each trip by third observer
 The no. of vehicles travelling in the opposite direction in each trip is noted by fourth observer
 In this method the detailed information is obtained concerning all phases of speed and delay
including location, duration and causes of delay.
Where,
t = average journey time in min.
q= flow of vehicle(average volume) in one direction of the stream
na = average number of vehicles counted in the direction of the Stream
when the test vehicle travels in the opposite directions
ny= the average no. of vehicles overtaking the test vehicle minus the no.
of
vehicles overtaken when the test is in the direction of ‘q’
Tw= average journey time, in minute when the test vehicle is travelling
with the stream ‘q’
Ta= average journey time, in minute when test vehicle is running against
the stream ‘q’
 Data Table:
Trip No. Direction
of trip
Journey
time
min-sec
Total stop
delay
min-
sec
No. of
Vehicle
overtaking
No. of
vehicle
overtaken
No. of
Vehicle
from
opposite
site
1
2
• Solution Table
Direction Journey time
min-sec
Stopped
Delay
min-sec
Number of Vehicle
Overtaking Overtaken In
opposite
direction
Total
Mean
WORK PLAN
‘Network Analysis’ Module of ARCGIS:
 Data Acquisition and Creation of Network Dataset.
 The best route Analysis.
 Specifying the route Properties.
 Calculating the fastest route with or without barriers.
REFERENCES:
(1) A Video based Vehicle Detection, Counting and Classification System ; Sania Bhatti*, Liaquat A. Thebo**, Mir
Muhammad B. Talpur** and Mohsin A. Memon*
*Department of Software Engineering, Mehran University of Engineering & Technology,
(2) Mobility Dataset Generation for Vehicular Social Networks Based on Floating Car Data ; Xiangjie Kong , Senior
Member, IEEE, Feng Xia , Senior Member, IEEE, Zhaolong Ning , Member, IEEE, Azizur Rahim, Yinqiong Cai, Zhiqiang
Gao, and Jianhua Ma; IEEE TRANSACTIONS ON VEHICULAR TECHNOLOGY, VOL. 67, NO. 5, MAY 2018
(3) Moving Vehicle Method of Estimating Traffic Volumes and Speeds’ WILLIAM J. MORTIMER,
Superintendent of Highways Cook County, Illinois
(4) GIS based urban transportation system for Prayagraj city ; Master of Technology In GIS & Remote Sensing ;
DINESH KUMAR AZAD (2007GI09)
(5) Comprehensive Mobility Plan Allahabad ;Urban Development Govt. of U.P

Route optimization using network analyst tools of arcgis(mid term evaluation) copy

  • 1.
    ROUTE OPTIMIZATION USINGNETWORK ANALYST TOOLS OF ARCGIS FOR PRAYAGRAJ CITY. Summited by: PRABHAT KUMAR Reg. No: 2019TR05 ) M.TECH THESIS ON
  • 2.
    INTRODUCTION: PRAYAGRAJ CITY:  Prayagrajis one of the major cities of Uttar Pradesh.  Prayagraj over the last few years has undergone widespread urbanization owing to increased industrialization and motorization.  Travel demands have grown faster than the population and expansion of the city, resulting in increased movement between the city center.  The resultant outcomes have been increasing congestion, increase in the number of accidents and rising pollution levels.  In light of these, the city of Prayagraj is attempting to develop an integrated solution to meet its accessibility and mobility needs.
  • 3.
    OBJECTIVES:  .Generation ofdatabase comprising of spatial and non-spatial (associated attribute data) data in form of network dataset that can be input for network analysis module of ARCGIS for information dissemination and analysis of collected data for the study area.  Collection of traffic volume data at a major intersection of city using video-graphic techniques.  Indentification of peak and off-peak hours using traffic volume data.  Collection of travel time data through test vehicle technique on major routes of the city during peak and off-peak hour.  Development of historical traffic data of city (developed from collected travel time data) to be used with Network dataset in ARCGIS in functionalities of ‘Network Analysis ‘ module of ArcGIS such as shortest route calculation (date and time specific)  To find out major points of congestion and suggest alternative routes through ‘Network Analysis’ module of ArcGIS
  • 4.
    LITERATURE REVIEW S.NO TITLEOF RESEARCH PAPER/CASE STUDY AUTHOR’S NAME/ SOURCE DESCRIPTION 1 A Video based Vehicle Detection, Counting and Classification System ; Sania Bhatti*, Liaquat A. Thebo**, Mir Muhammad B. Talpur** and Mohsin A. Memon* For collection of traffic volume data at a major intersection of city. For Identification of peak and off-peak hours using traffic volume data 2 Moving Vehicle Method of Estimating Traffic Volumes and Speeds WILLIAM J. MORTIMER The techniques presented in this paper will provide a method of volume counting which will require a bare minimum of manpower and equipment. It offers a means of securing economically and quickly a blanket volume count of all streets in a given area.
  • 5.
    LITERATURE REVIEW S.NO/ TITLEOF RESEARCH PAPER/CASE STUDY AUTHOR’S NAME/ SOURCE DESCRIPTION 3 GIS based urban transportation system for Prayagraj city DINESH KUMAR AZAD (2007GI09) GIS components , its working application of GIS. 4 Comprehensive Mobility Plan Allahabad Urban Development Govt. of U.P 5 Mobility Dataset Generation for Vehicular Social Networks Based on Floating Car Data Xiangiiekong For collection of travel time data through test vehicle technique on major routes of the city during peak and off-peak hour
  • 6.
    METHODLOGY: 1. VIDEO-GRAPHIC TECHNIQUES: For collection of traffic volume data at a major intersection of city.  For Identification of peak and off-peak hours using traffic volume data. 2. TEST VEHICLE TECHNIQUE:  For collection of travel time data through test vehicle technique on major routes of the city during peak and off-peak hour. 3. ‘NETWORK ANALYSIS’ MODULE OF ARCGIS:  To find out major points of congestion and suggest alternative routes.  As shortest route calculation.
  • 7.
    WORK PLAN:  FORVIDEO GRAPHIC TECHNIQUES:  Using data set we get result as:  Vehicle composition as :Bus , Truck ,Light Vehicle ,Autorickshaw ,Motorcycle etc.  Vehicle composition of traffic stream in percentage.  Service flow rate.  PCU vs Time graph.  Level of service.  Directional distribution. Video cameras are mounted to record the traffic condition on a road TRAFFIC VOLUME STUDY MANUAL COUNTING METHOD INDIRECT METHOD VIDEO CAMERA
  • 8.
    WORK PLAN  TESTVEHICLE: Floating car or riding check method  One observer is seated in the floating car with two stop watches. One of the stop watch is used to record the time at various control point like intersections, bridges or any other fixed points in each trip.  The other stop watch is used to find the duration of the individual delays. The time, location and cause of these delays are recorded by the second observer.  The number of vehicle overtaking the test vehicle and the overtaken by the test vehicle are noted in each trip by third observer  The no. of vehicles travelling in the opposite direction in each trip is noted by fourth observer  In this method the detailed information is obtained concerning all phases of speed and delay including location, duration and causes of delay.
  • 9.
    Where, t = averagejourney time in min. q= flow of vehicle(average volume) in one direction of the stream na = average number of vehicles counted in the direction of the Stream when the test vehicle travels in the opposite directions ny= the average no. of vehicles overtaking the test vehicle minus the no. of vehicles overtaken when the test is in the direction of ‘q’ Tw= average journey time, in minute when the test vehicle is travelling with the stream ‘q’ Ta= average journey time, in minute when test vehicle is running against the stream ‘q’
  • 10.
     Data Table: TripNo. Direction of trip Journey time min-sec Total stop delay min- sec No. of Vehicle overtaking No. of vehicle overtaken No. of Vehicle from opposite site 1 2 • Solution Table Direction Journey time min-sec Stopped Delay min-sec Number of Vehicle Overtaking Overtaken In opposite direction Total Mean
  • 11.
    WORK PLAN ‘Network Analysis’Module of ARCGIS:  Data Acquisition and Creation of Network Dataset.  The best route Analysis.  Specifying the route Properties.  Calculating the fastest route with or without barriers.
  • 12.
    REFERENCES: (1) A Videobased Vehicle Detection, Counting and Classification System ; Sania Bhatti*, Liaquat A. Thebo**, Mir Muhammad B. Talpur** and Mohsin A. Memon* *Department of Software Engineering, Mehran University of Engineering & Technology, (2) Mobility Dataset Generation for Vehicular Social Networks Based on Floating Car Data ; Xiangjie Kong , Senior Member, IEEE, Feng Xia , Senior Member, IEEE, Zhaolong Ning , Member, IEEE, Azizur Rahim, Yinqiong Cai, Zhiqiang Gao, and Jianhua Ma; IEEE TRANSACTIONS ON VEHICULAR TECHNOLOGY, VOL. 67, NO. 5, MAY 2018 (3) Moving Vehicle Method of Estimating Traffic Volumes and Speeds’ WILLIAM J. MORTIMER, Superintendent of Highways Cook County, Illinois (4) GIS based urban transportation system for Prayagraj city ; Master of Technology In GIS & Remote Sensing ; DINESH KUMAR AZAD (2007GI09) (5) Comprehensive Mobility Plan Allahabad ;Urban Development Govt. of U.P