This document provides an overview of using Wireshark and tcpdump to monitor network traffic. It begins with an introduction to the motivation for network monitoring. It then covers the tools tcpdump, tshark, and Wireshark. Examples are given of using tcpdump and tshark on the command line to capture traffic. The document demonstrates Wireshark's graphical user interface and features for analyzing captured packets, including display filters, following TCP streams, conversations, endpoint statistics, and flow graphs. It concludes with tips for improving Wireshark performance and using grep to further analyze saved packet files.


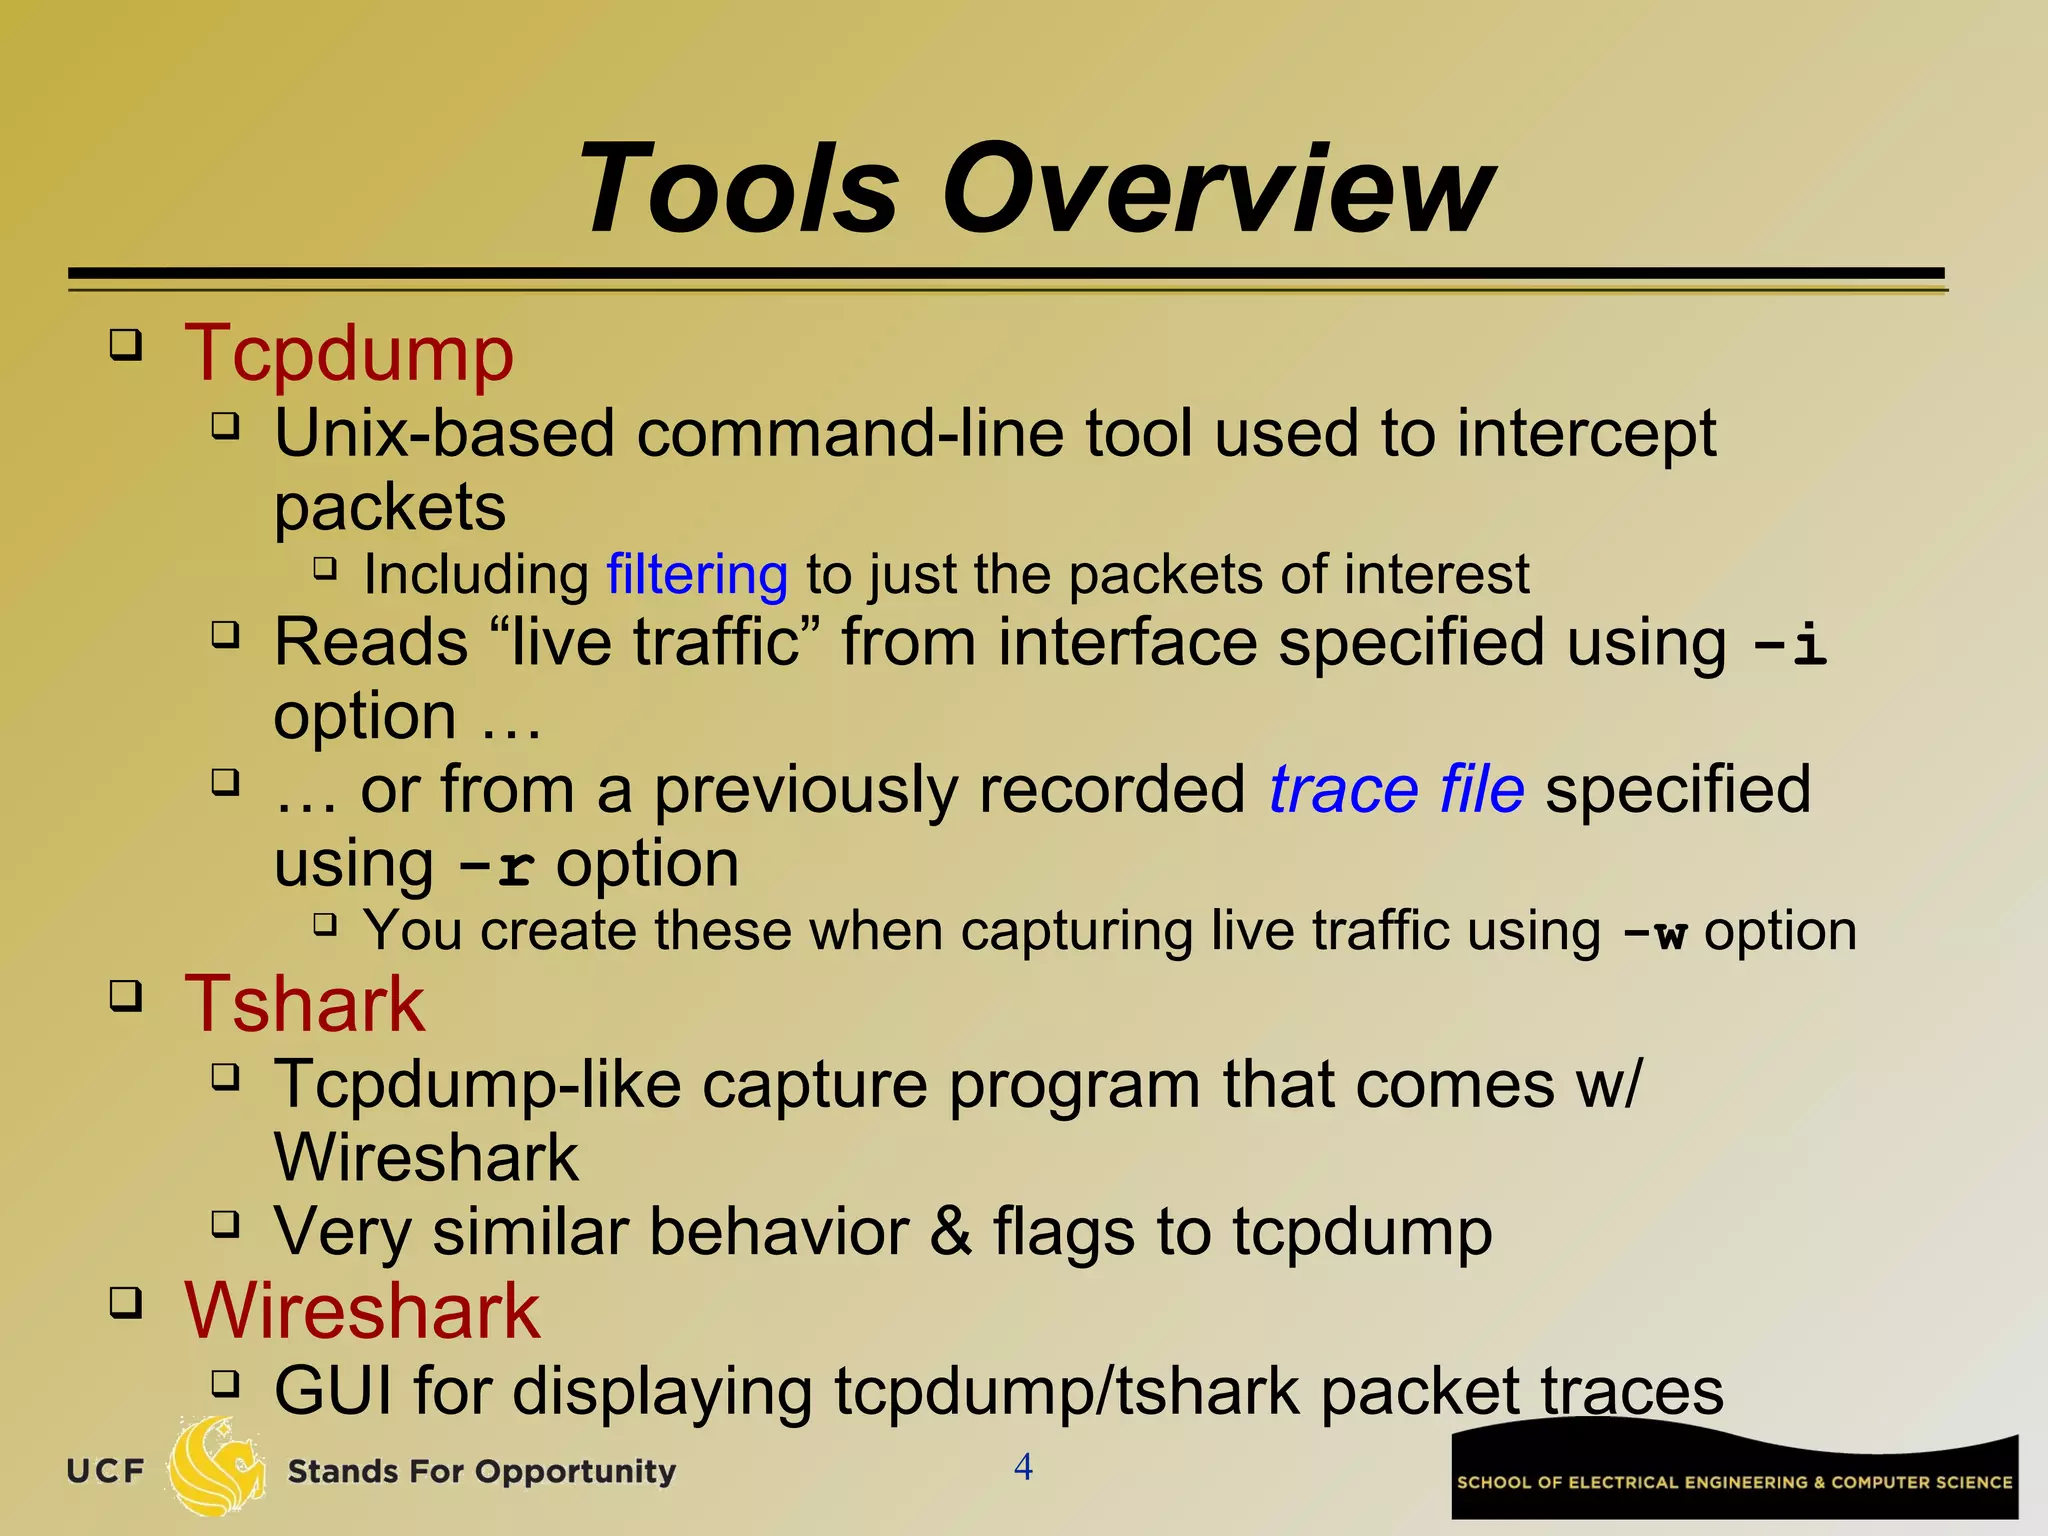

![7
Similar Output from Tshark
1190003744.940437 61.184.241.230 -> 128.32.48.169
SSH Encrypted request packet len=48
1190003744.940916 128.32.48.169 -> 61.184.241.230
SSH Encrypted response packet len=48
1190003744.955764 61.184.241.230 -> 128.32.48.169
TCP 6943 > ssh [ACK] Seq=48 Ack=48 Win=65514
Len=0 TSV=445871583 TSER=632535493
1190003745.035678 61.184.241.230 -> 128.32.48.169
SSH Encrypted request packet len=48
1190003745.036004 128.32.48.169 -> 61.184.241.230
SSH Encrypted response packet len=48
1190003745.050970 61.184.241.230 -> 128.32.48.169
TCP 6943 > ssh [ACK] Seq=96 Ack=96 Win=65514
Len=0 TSV=445871583 TSER=632535502](https://image.slidesharecdn.com/traffic-monitoring-160131191314/75/Traffic-monitoring-7-2048.jpg)
![8
Demo 1 – Basic Run
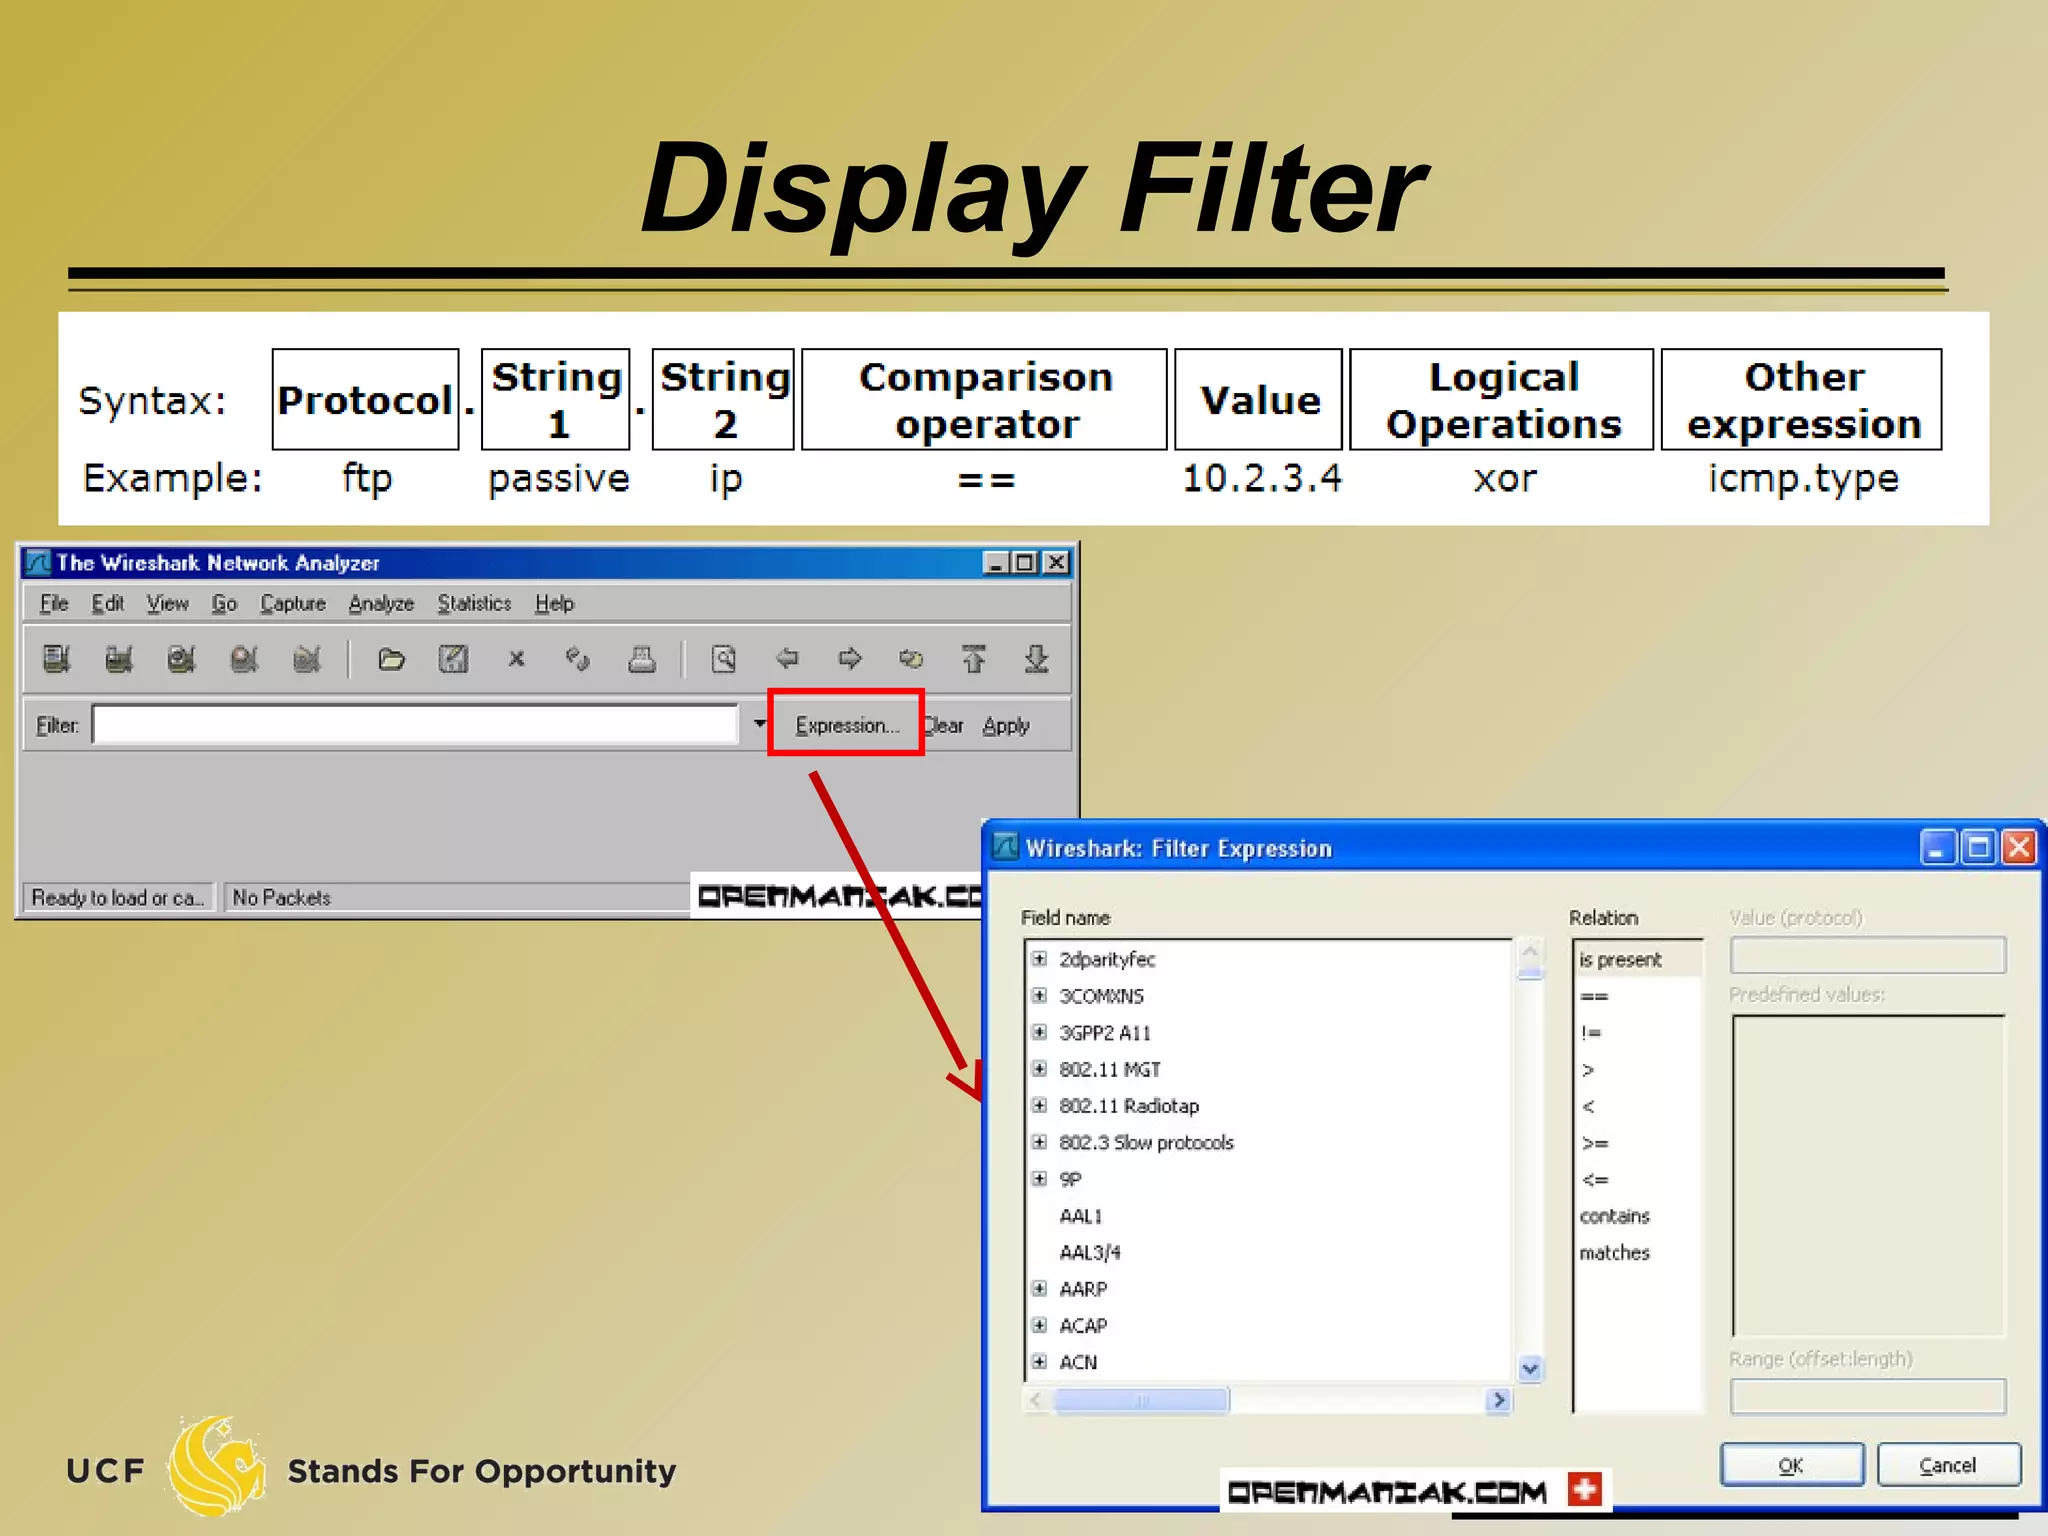
Syntax:
tcpdump [options] [filter expression]
Unfortunately, Eustis machine does not
allow normal users to run tcpdump
I will demonstrate it on my group’s Unix
machine: cnsserver.eecs.ucf.edu
$ sudo tcpdump –i eth0
On your own Unix machine, you can run it
using “sudo” or directly run “tcpdump”
Observe the output](https://image.slidesharecdn.com/traffic-monitoring-160131191314/75/Traffic-monitoring-8-2048.jpg)


![Basic usage of Grep
Command-line text-search program in Linux
Some useful usage:
Grep ‘word’ filename # find lines with ‘word’
Grep –v ‘word’ filename # find lines without ‘word’
Grep ‘^word’ filename # find lines beginning with ‘word’
Grep ‘word’ filename > file2 # output lines with ‘word’ to file2
ls -l | grep rwxrwxrwx # list files that have ‘rwxrwxrwx’ feature
grep '^[0-4]‘ filename # find lines beginning with any of the numbers
from 0-4
Grep –c ‘word’ filename # find lines with ‘word’ and print out the
number of these lines
Grep –i ‘word’ filename # find lines with ‘word’ regardless of case
Many tutorials on grep online
http://www.cyberciti.biz/faq/howto-use-grep-command-in-linux-unix/
http://www.thegeekstuff.com/2009/03/15-practical-unix-grep-command-
examples/
59](https://image.slidesharecdn.com/traffic-monitoring-160131191314/75/Traffic-monitoring-59-2048.jpg)