Download to read offline


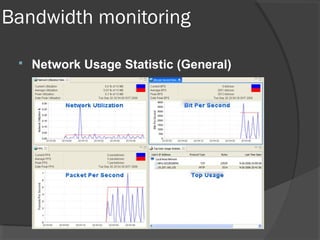
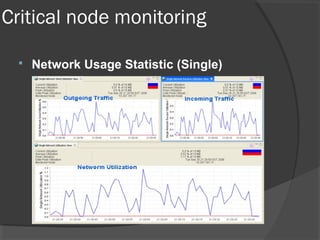
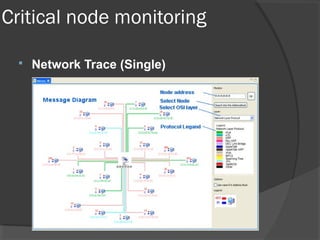


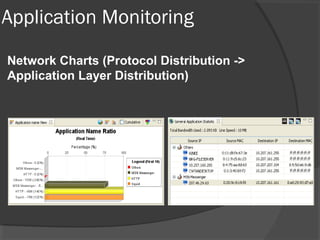


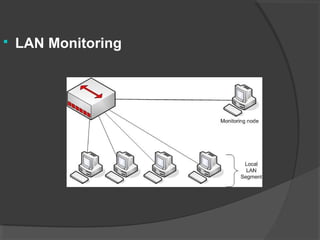
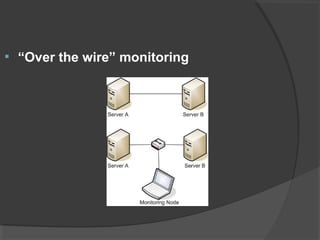


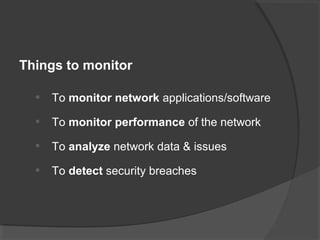


This document discusses passive network monitoring methodology. It describes passive monitoring as a non-intrusive approach that measures real-time network traffic without increasing traffic loads. Passive monitoring provides high security, detailed monitoring of all network activity, and cannot be detected by other network tools. The document outlines useful features of passive monitoring for various users and applications including bandwidth monitoring, troubleshooting, security monitoring, and protocol analysis.