Downloaded 91 times


![iperf
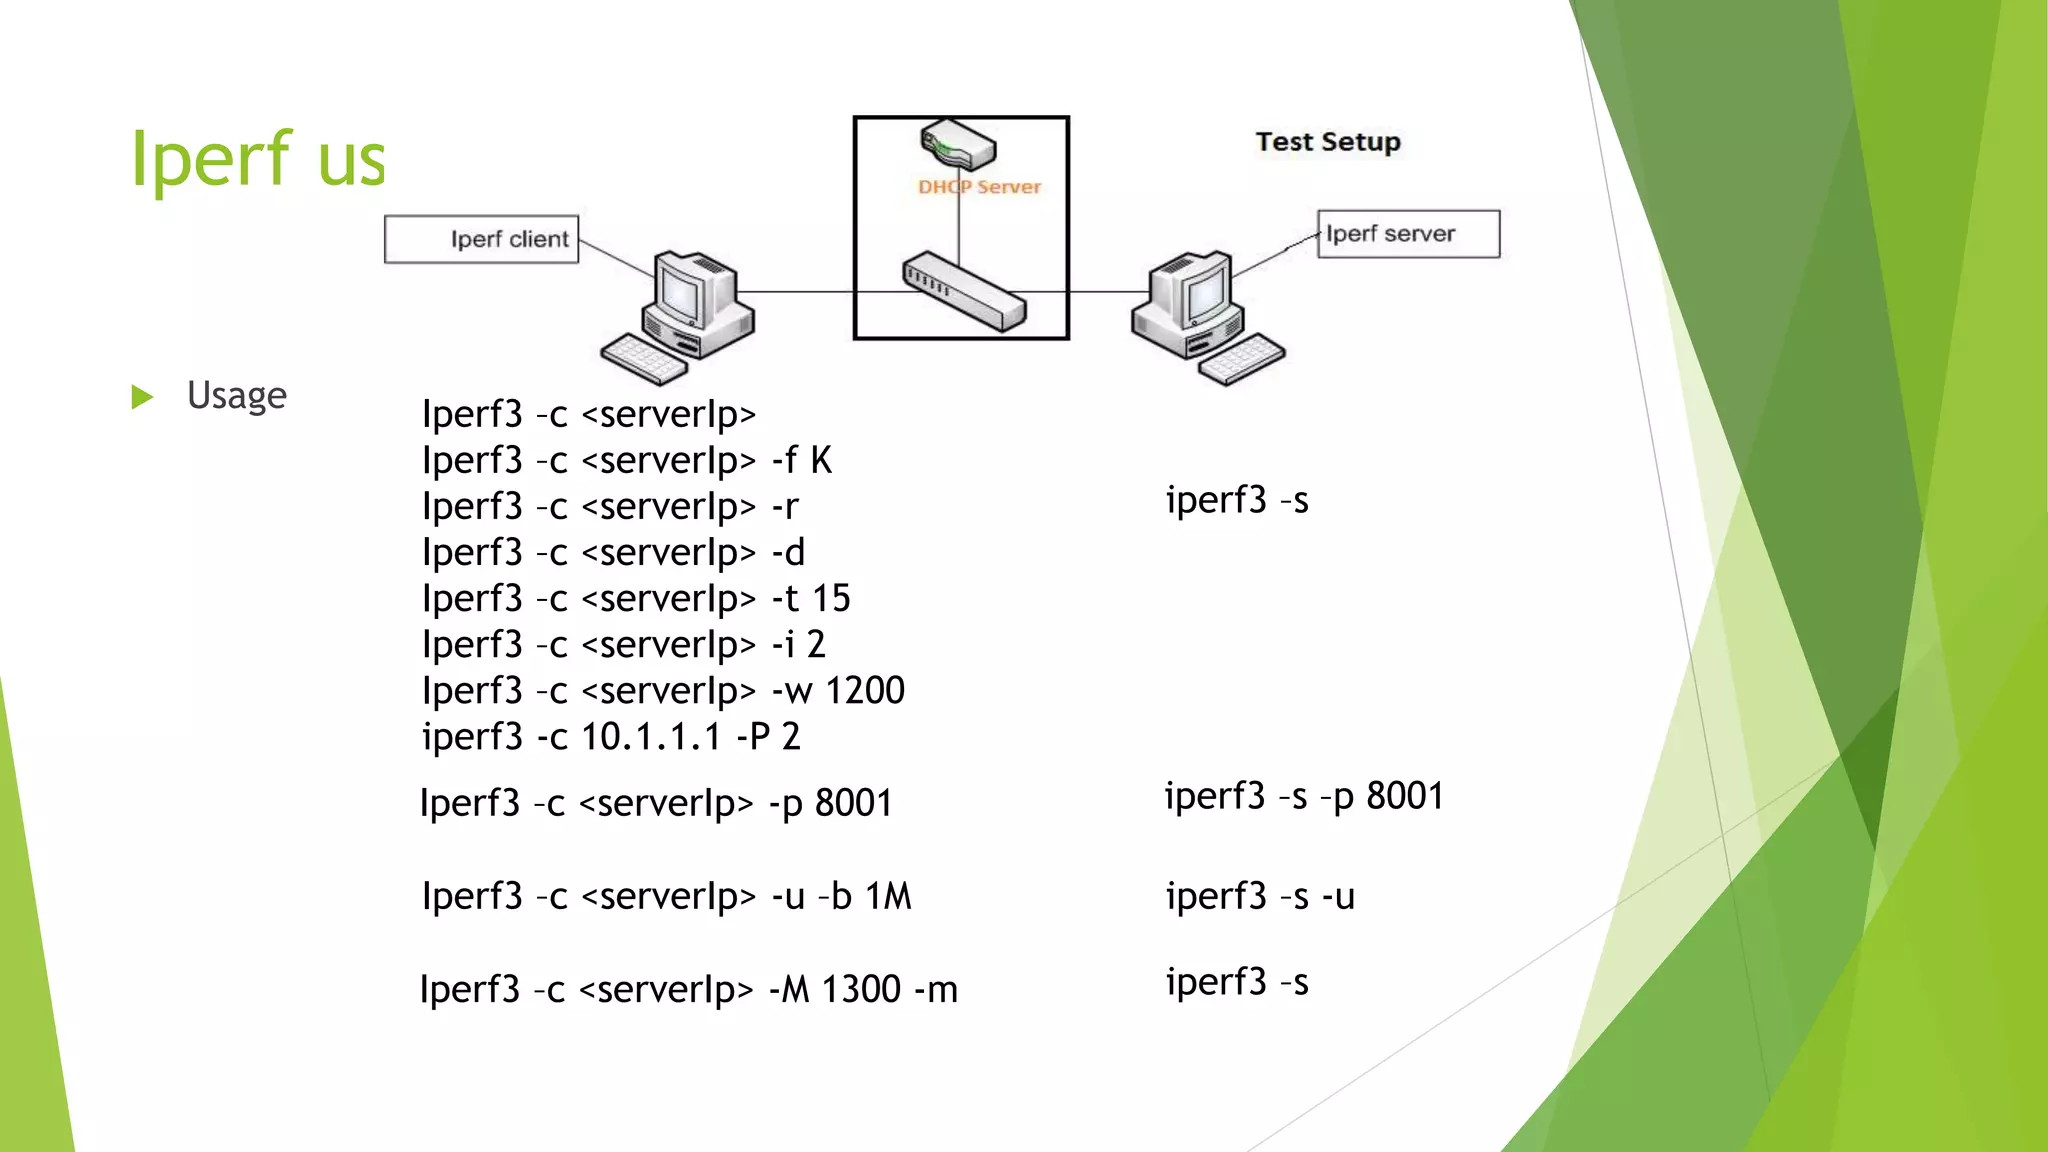
It measures the bandwidth and the quality of a network link. Jperf also does the same with additional graphical interface.
It creates TCP,UDP,SCTP data streams by tuning various parameters and gives idea about network’s bandwidth, delay, jitter and data loss
values.
Currently updated version is iperf3
source code https://github.com/esnet/iperf
sudo apt-get install iperf3
Iperf3 options
-s server
-c client
-t test duration timing
-i periodic interval report
-f [kmKM] formatting option
-d, -r bi-directional bandwidths
-p Specific port number
-w TCP window size
-b bandwidth setting
-u set to udp
-M maximum segment size
-P parallel streams](https://image.slidesharecdn.com/wiresharktcpdumpandnetworkperfomancetools-170906054810/75/Wireshark-Tcpdump-and-Network-Performance-tools-17-2048.jpg)


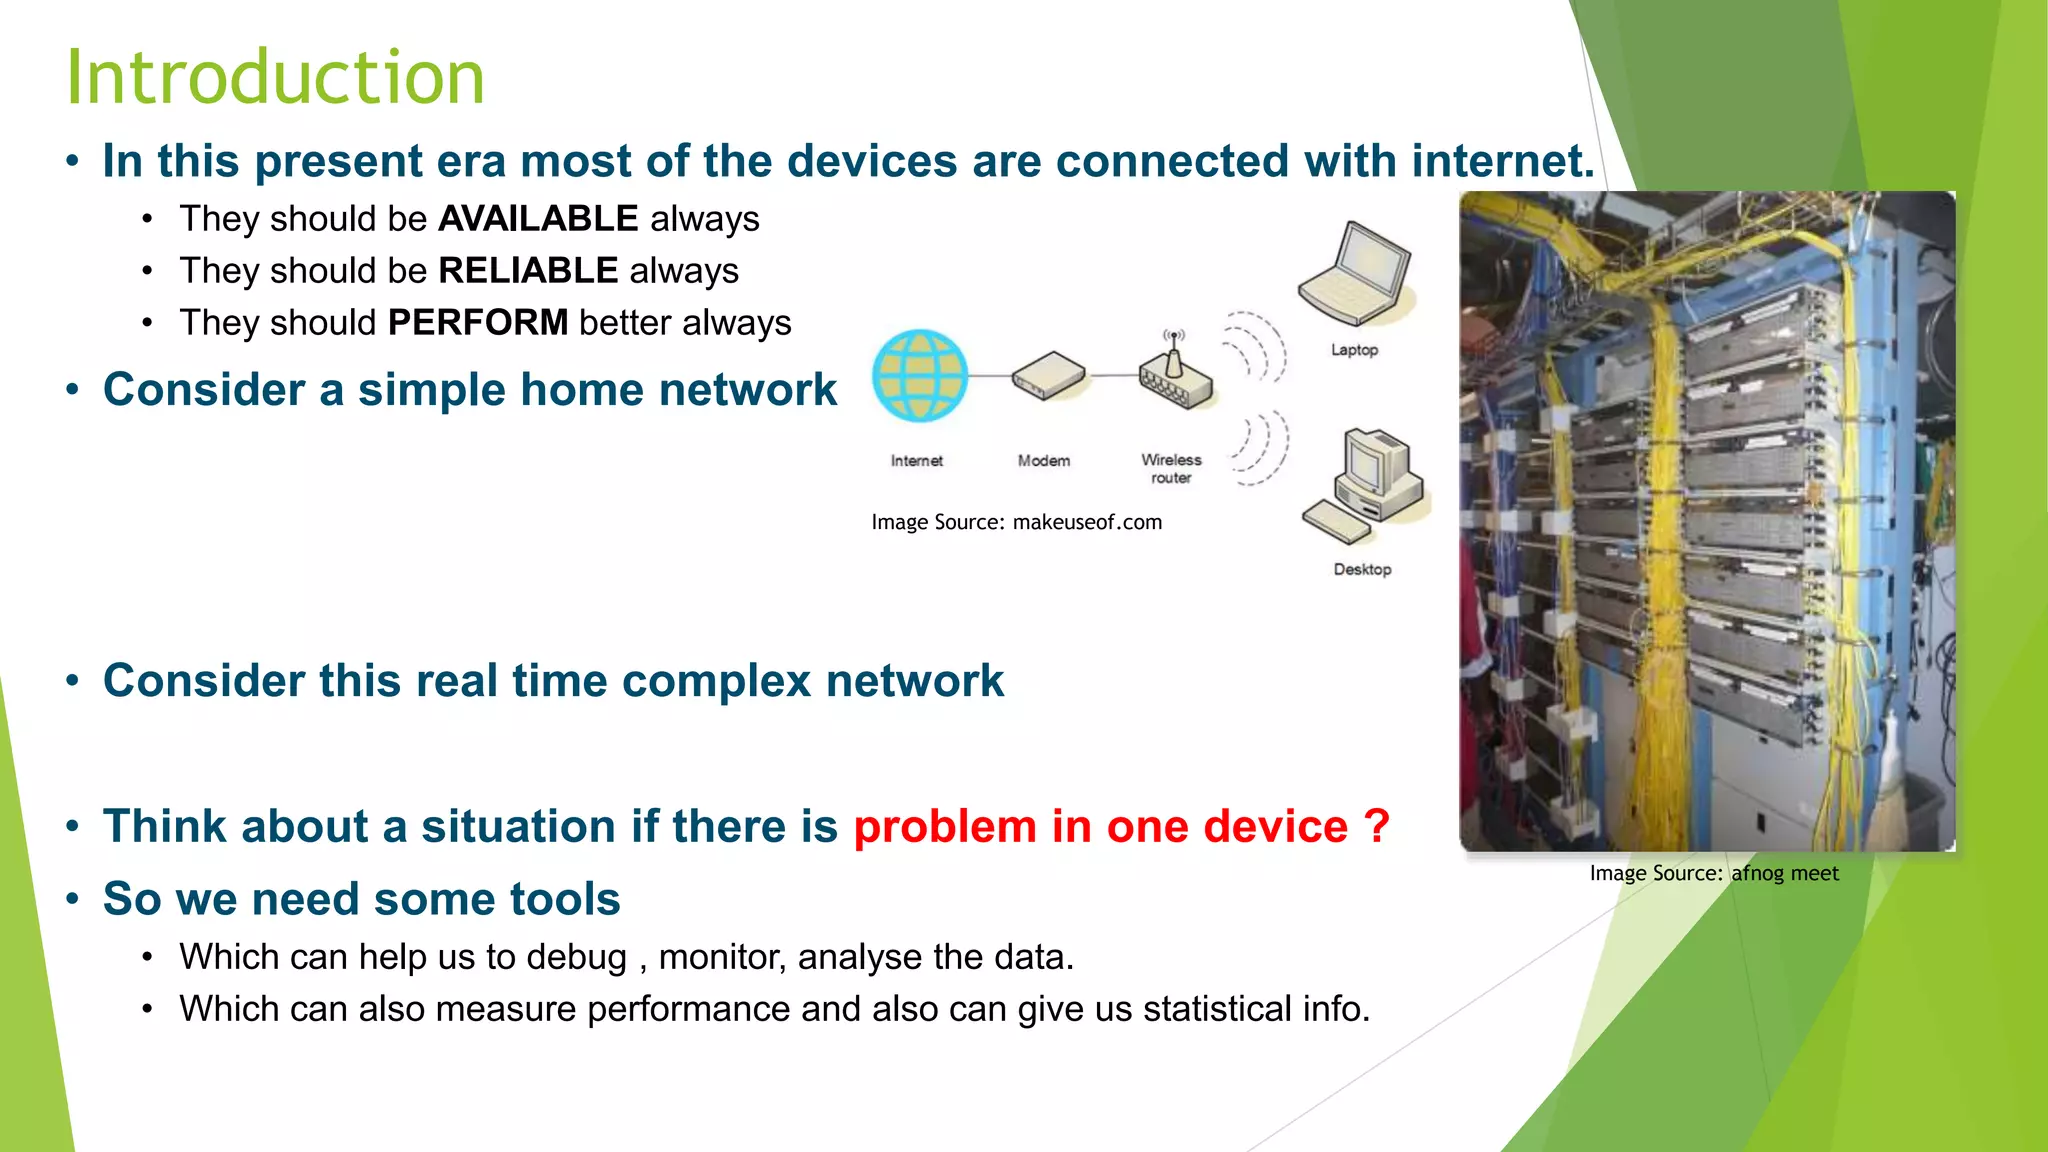
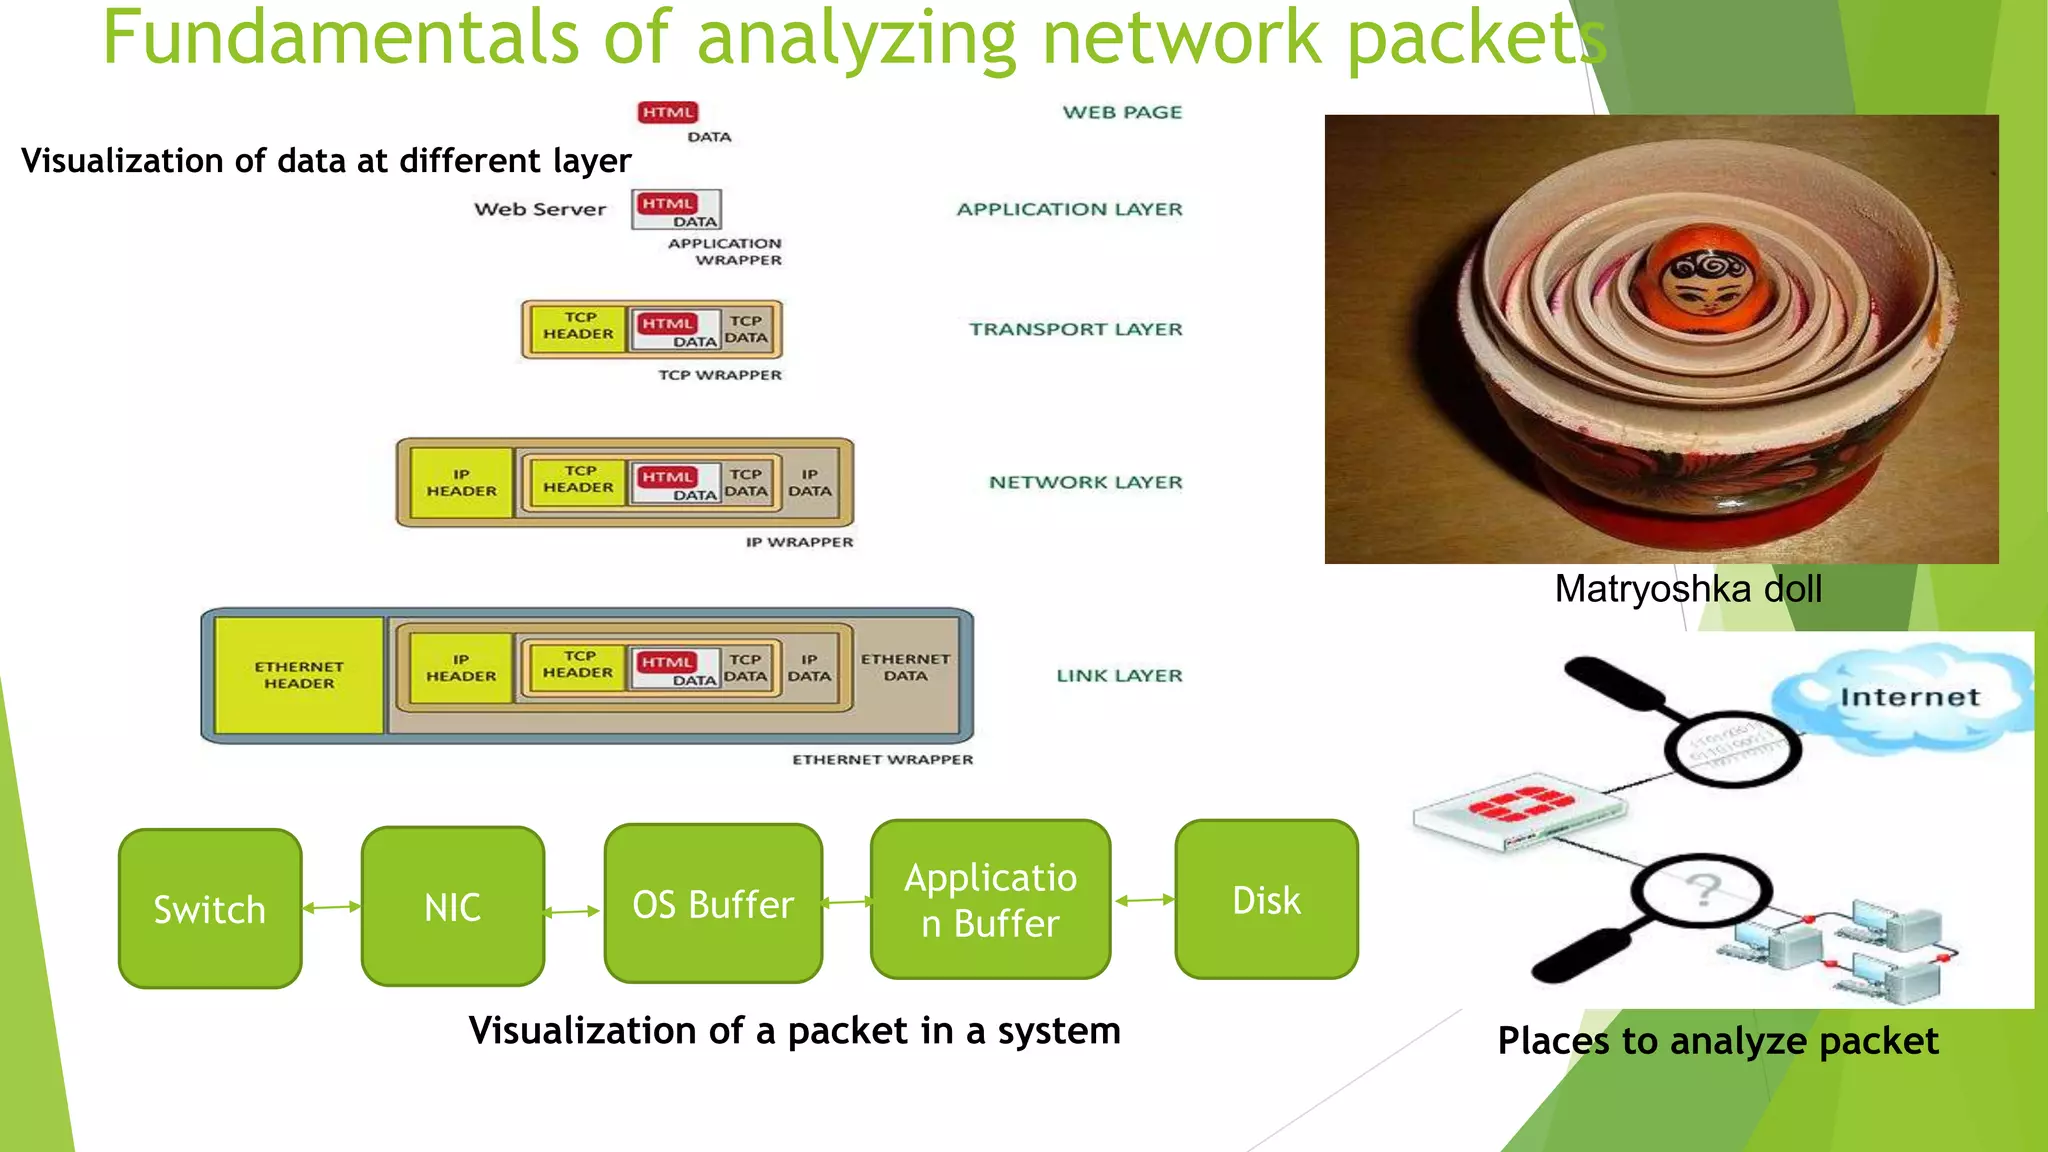
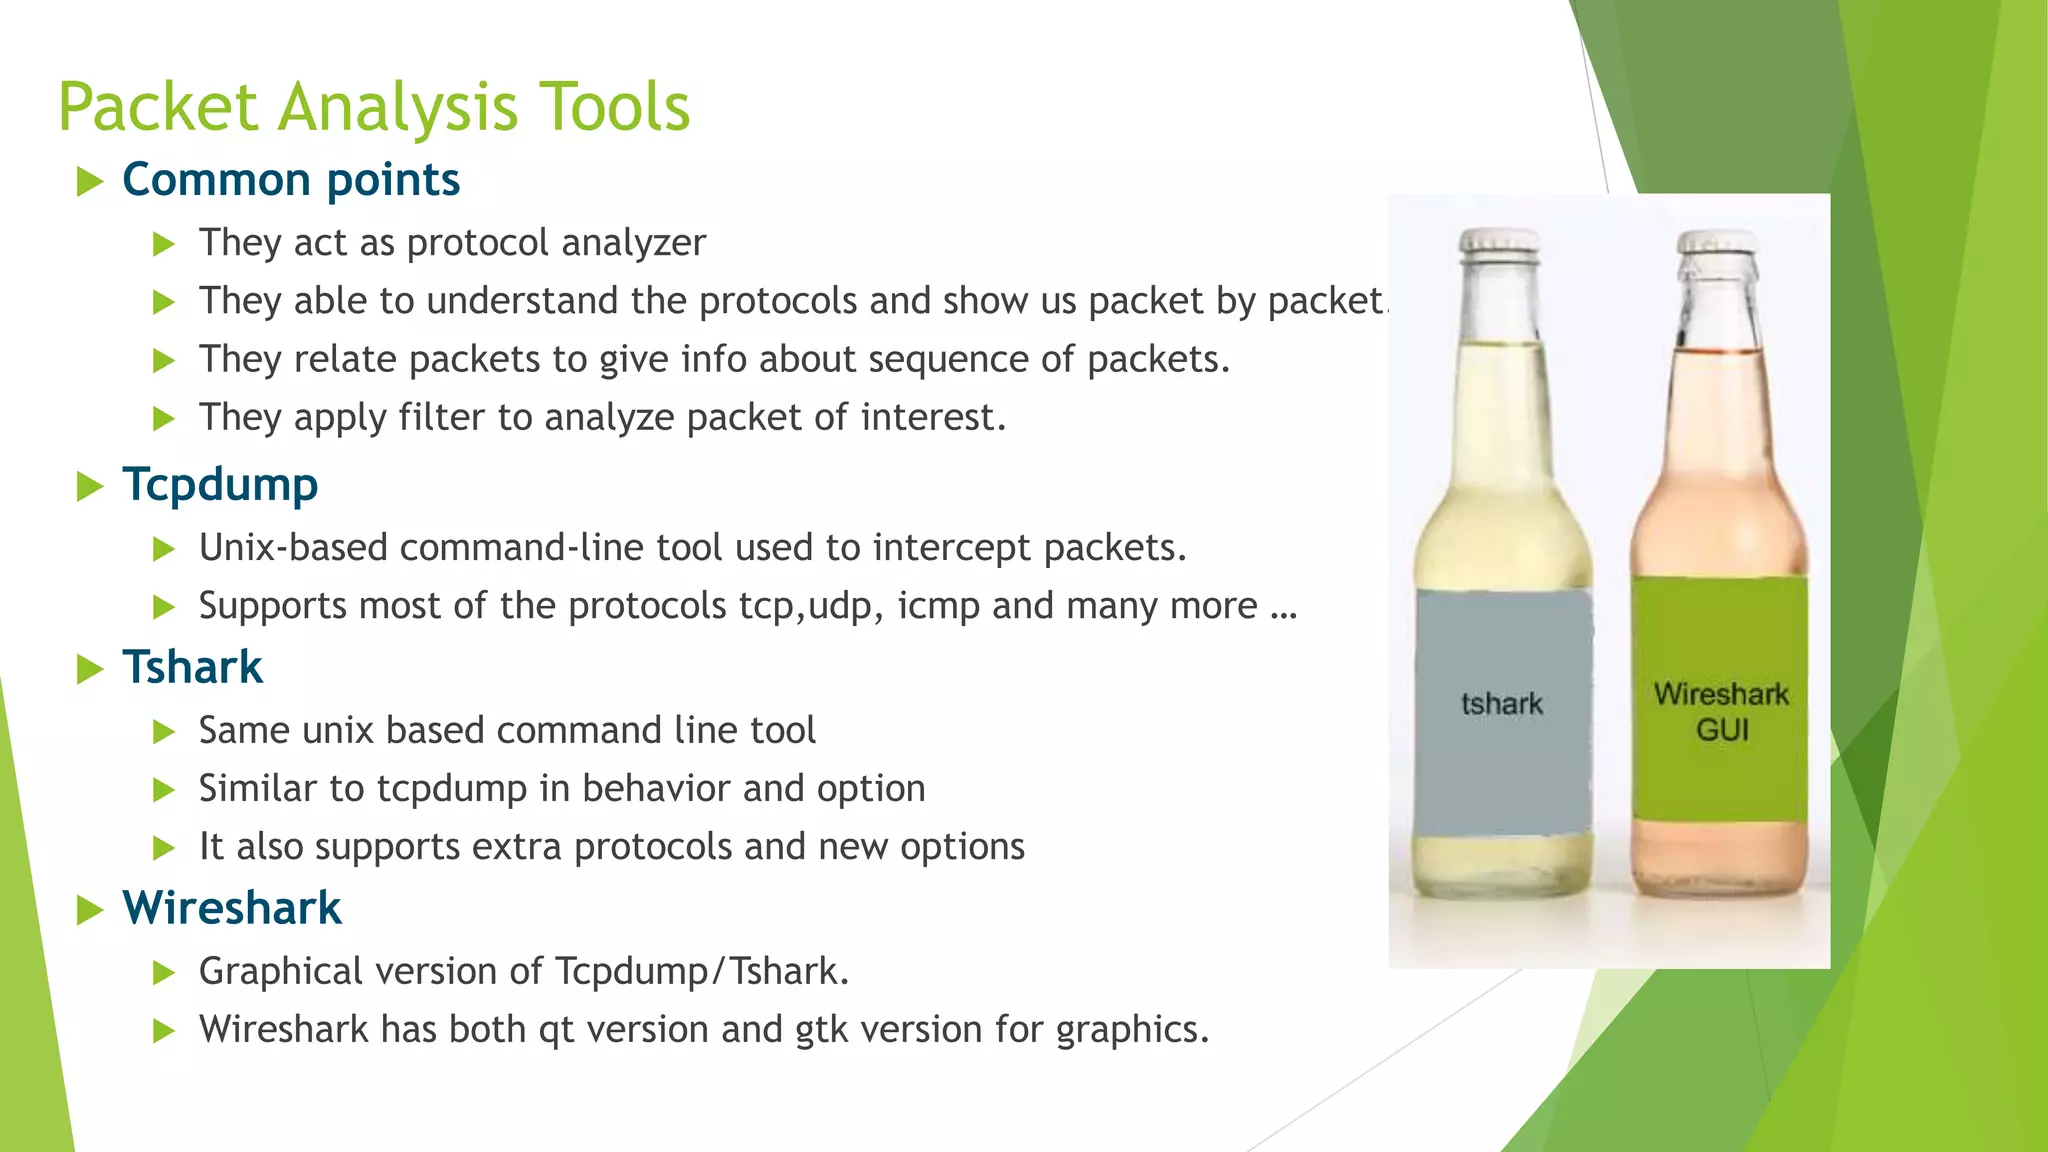
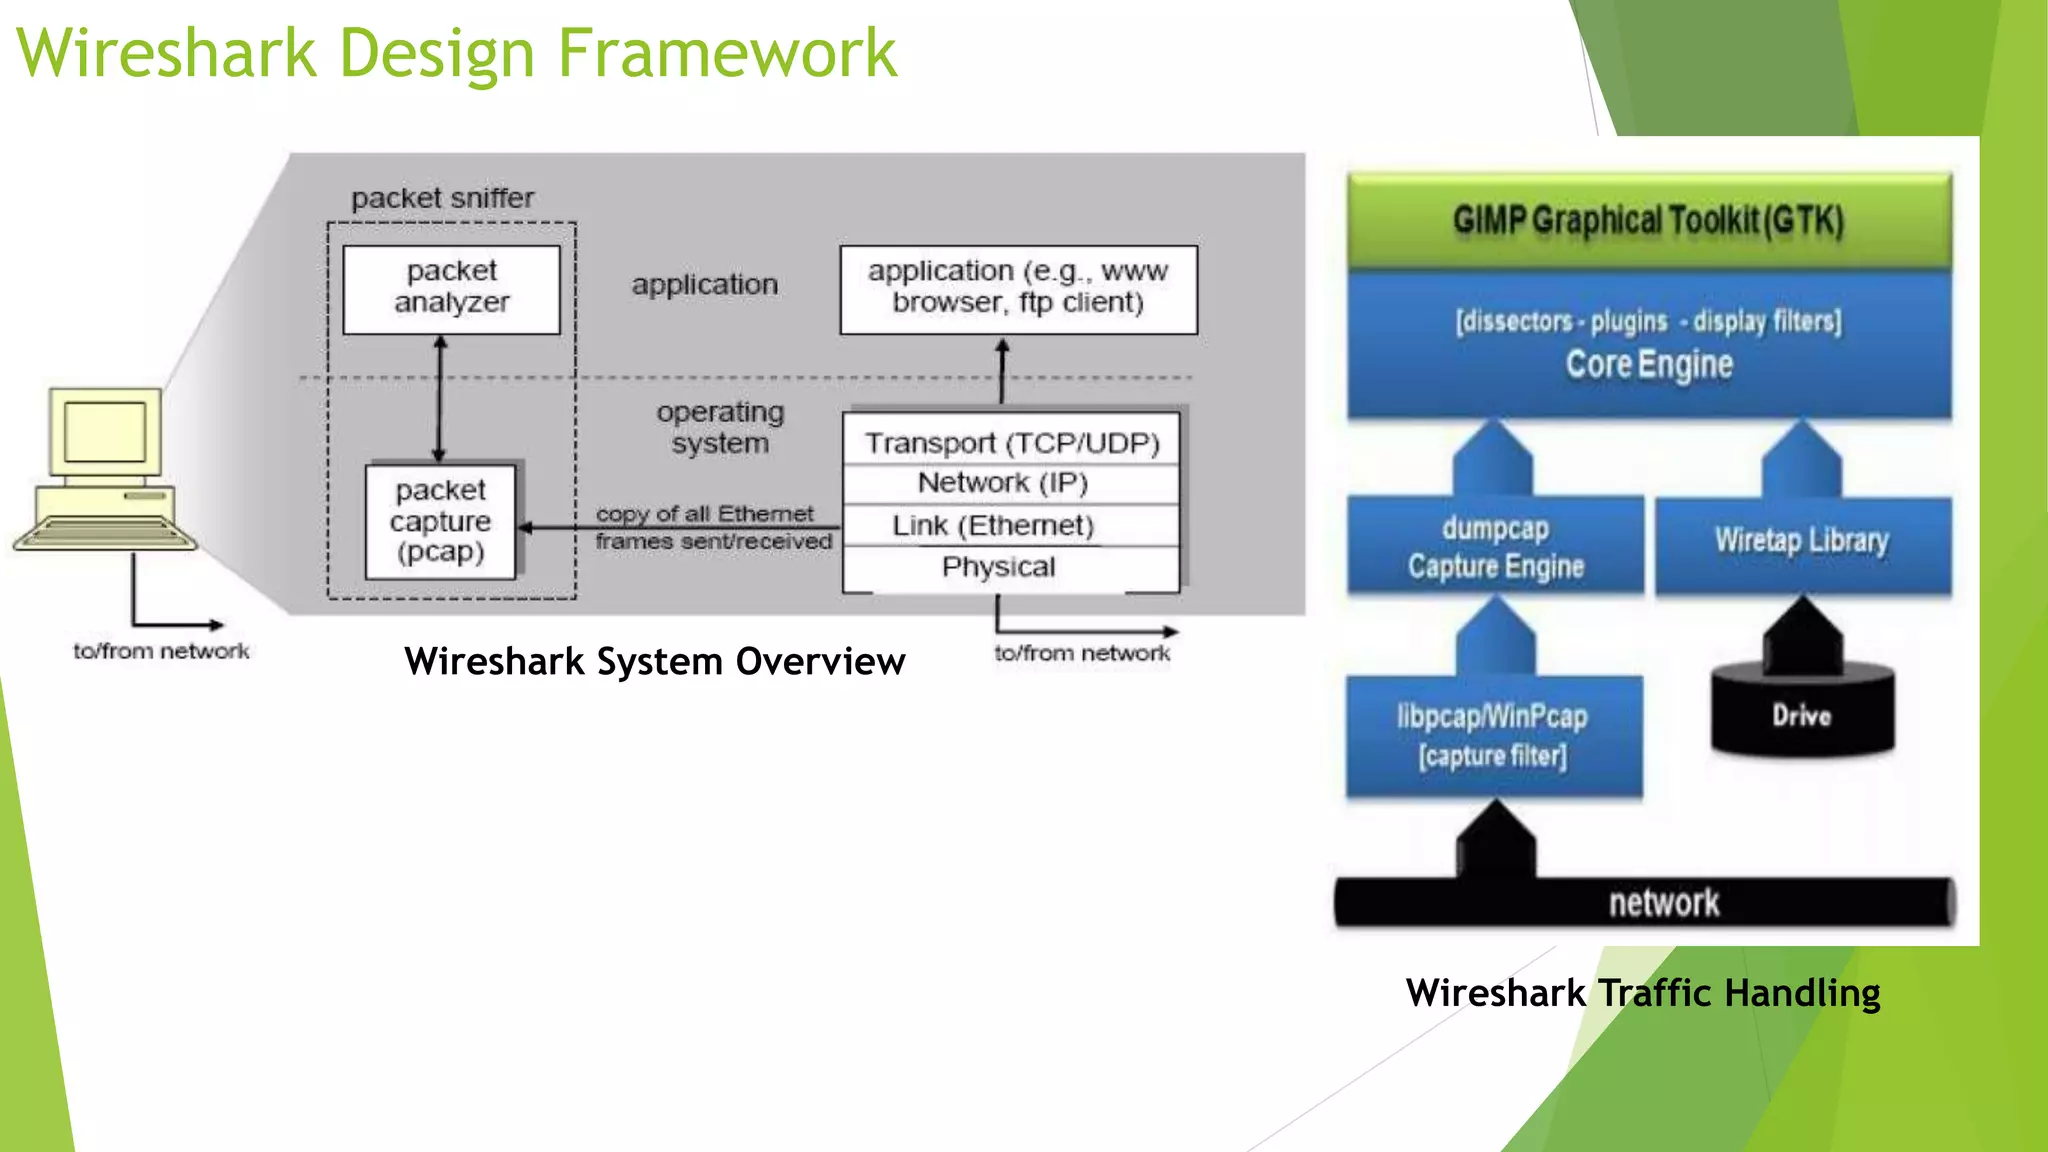
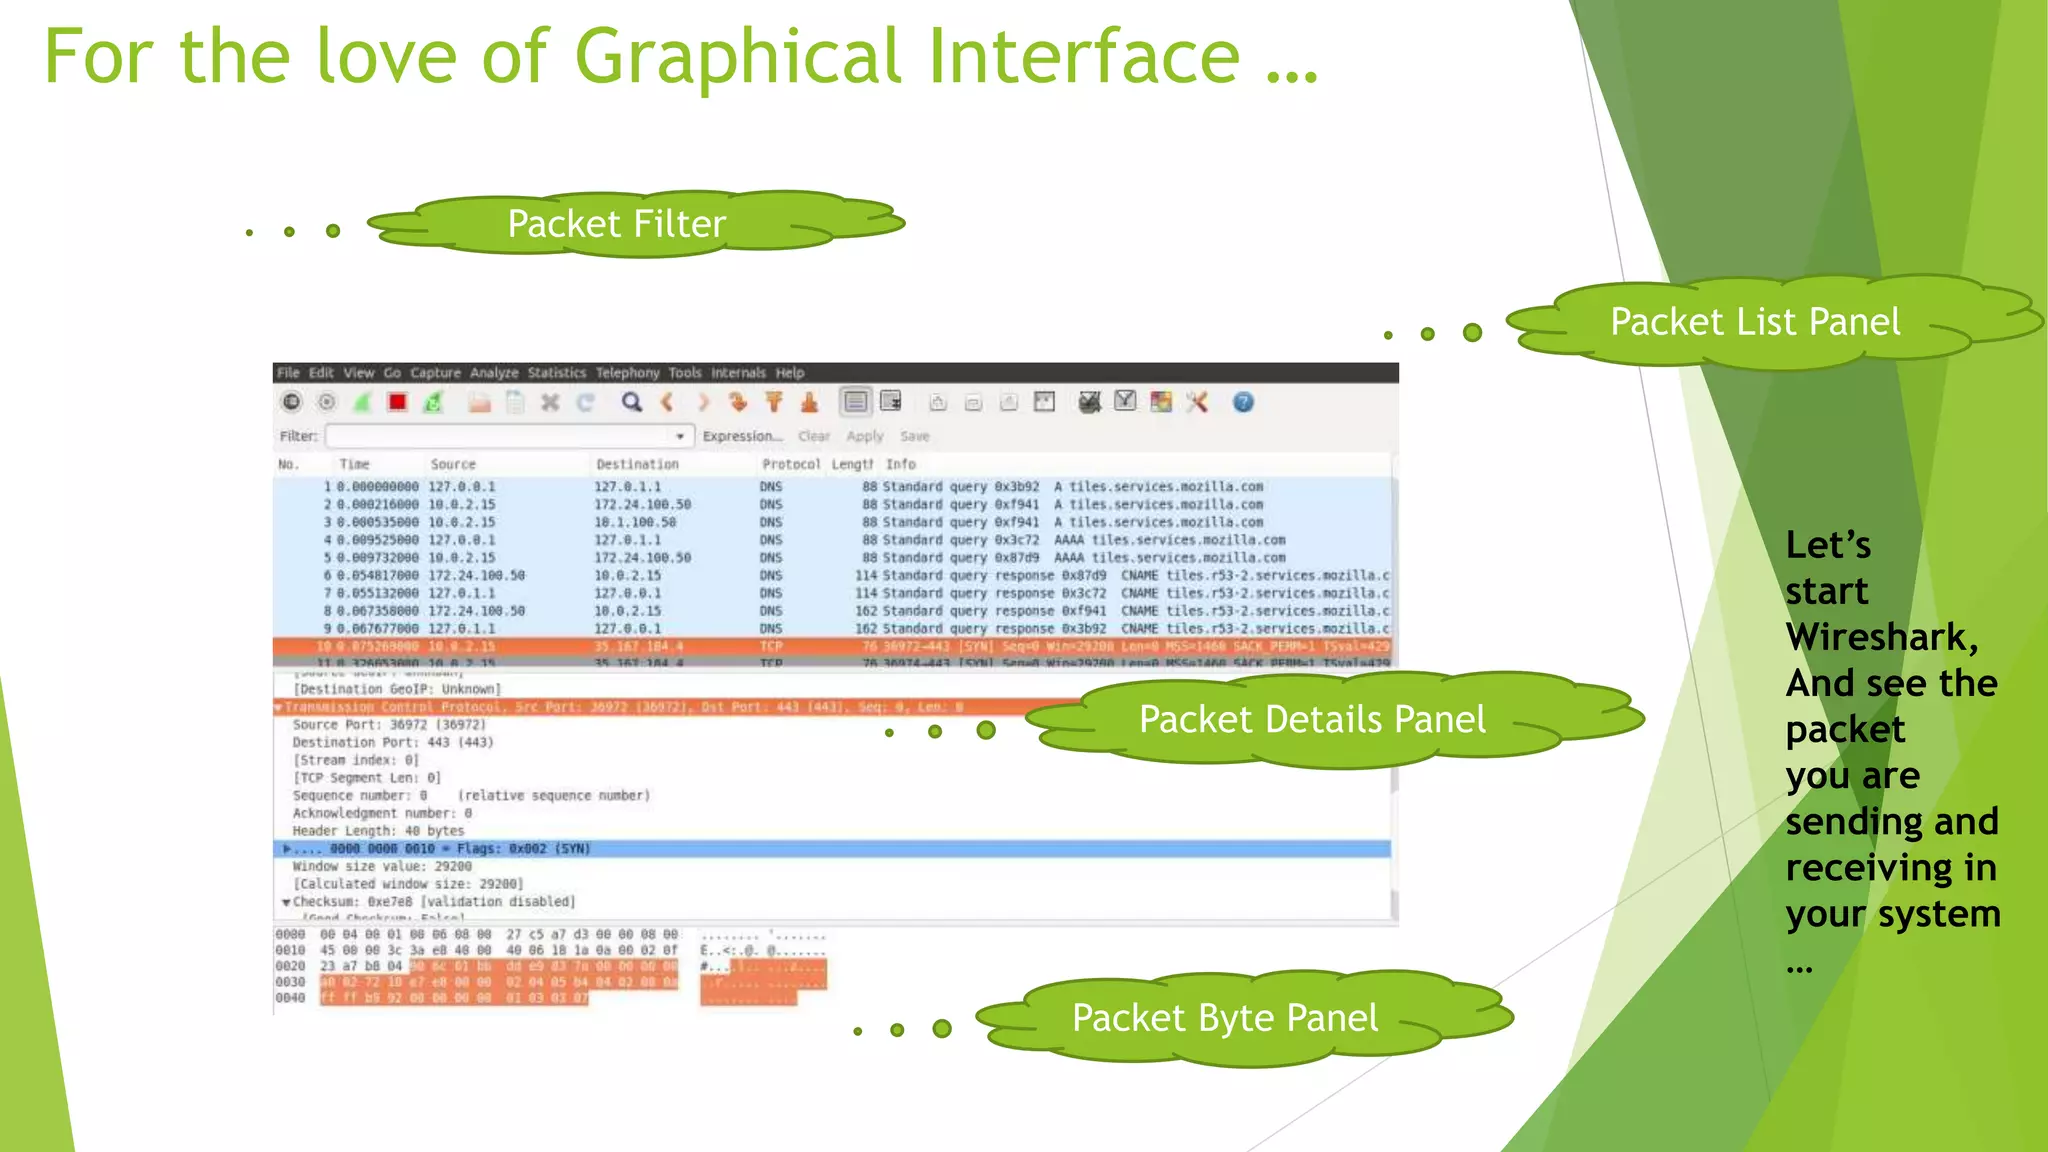
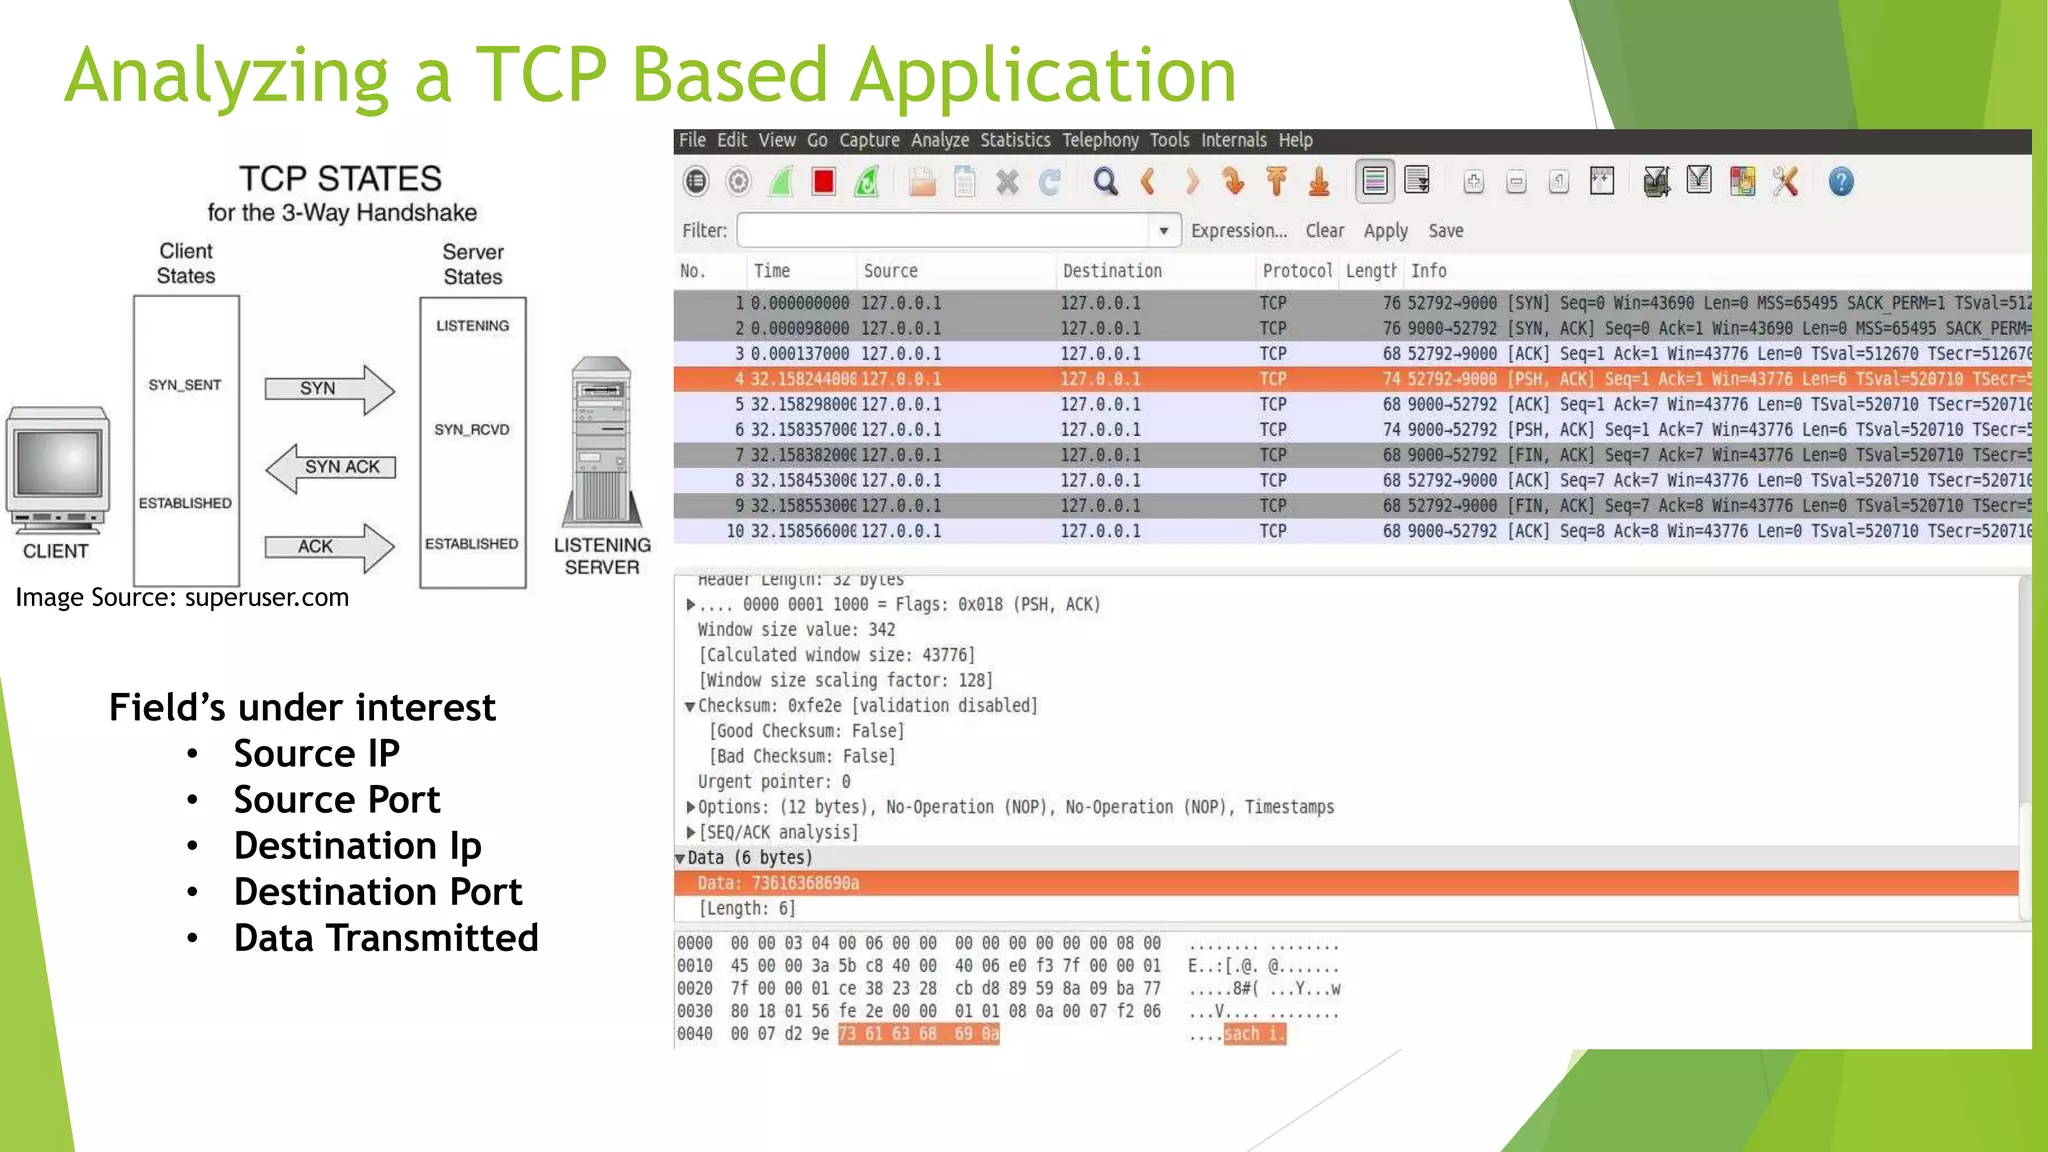
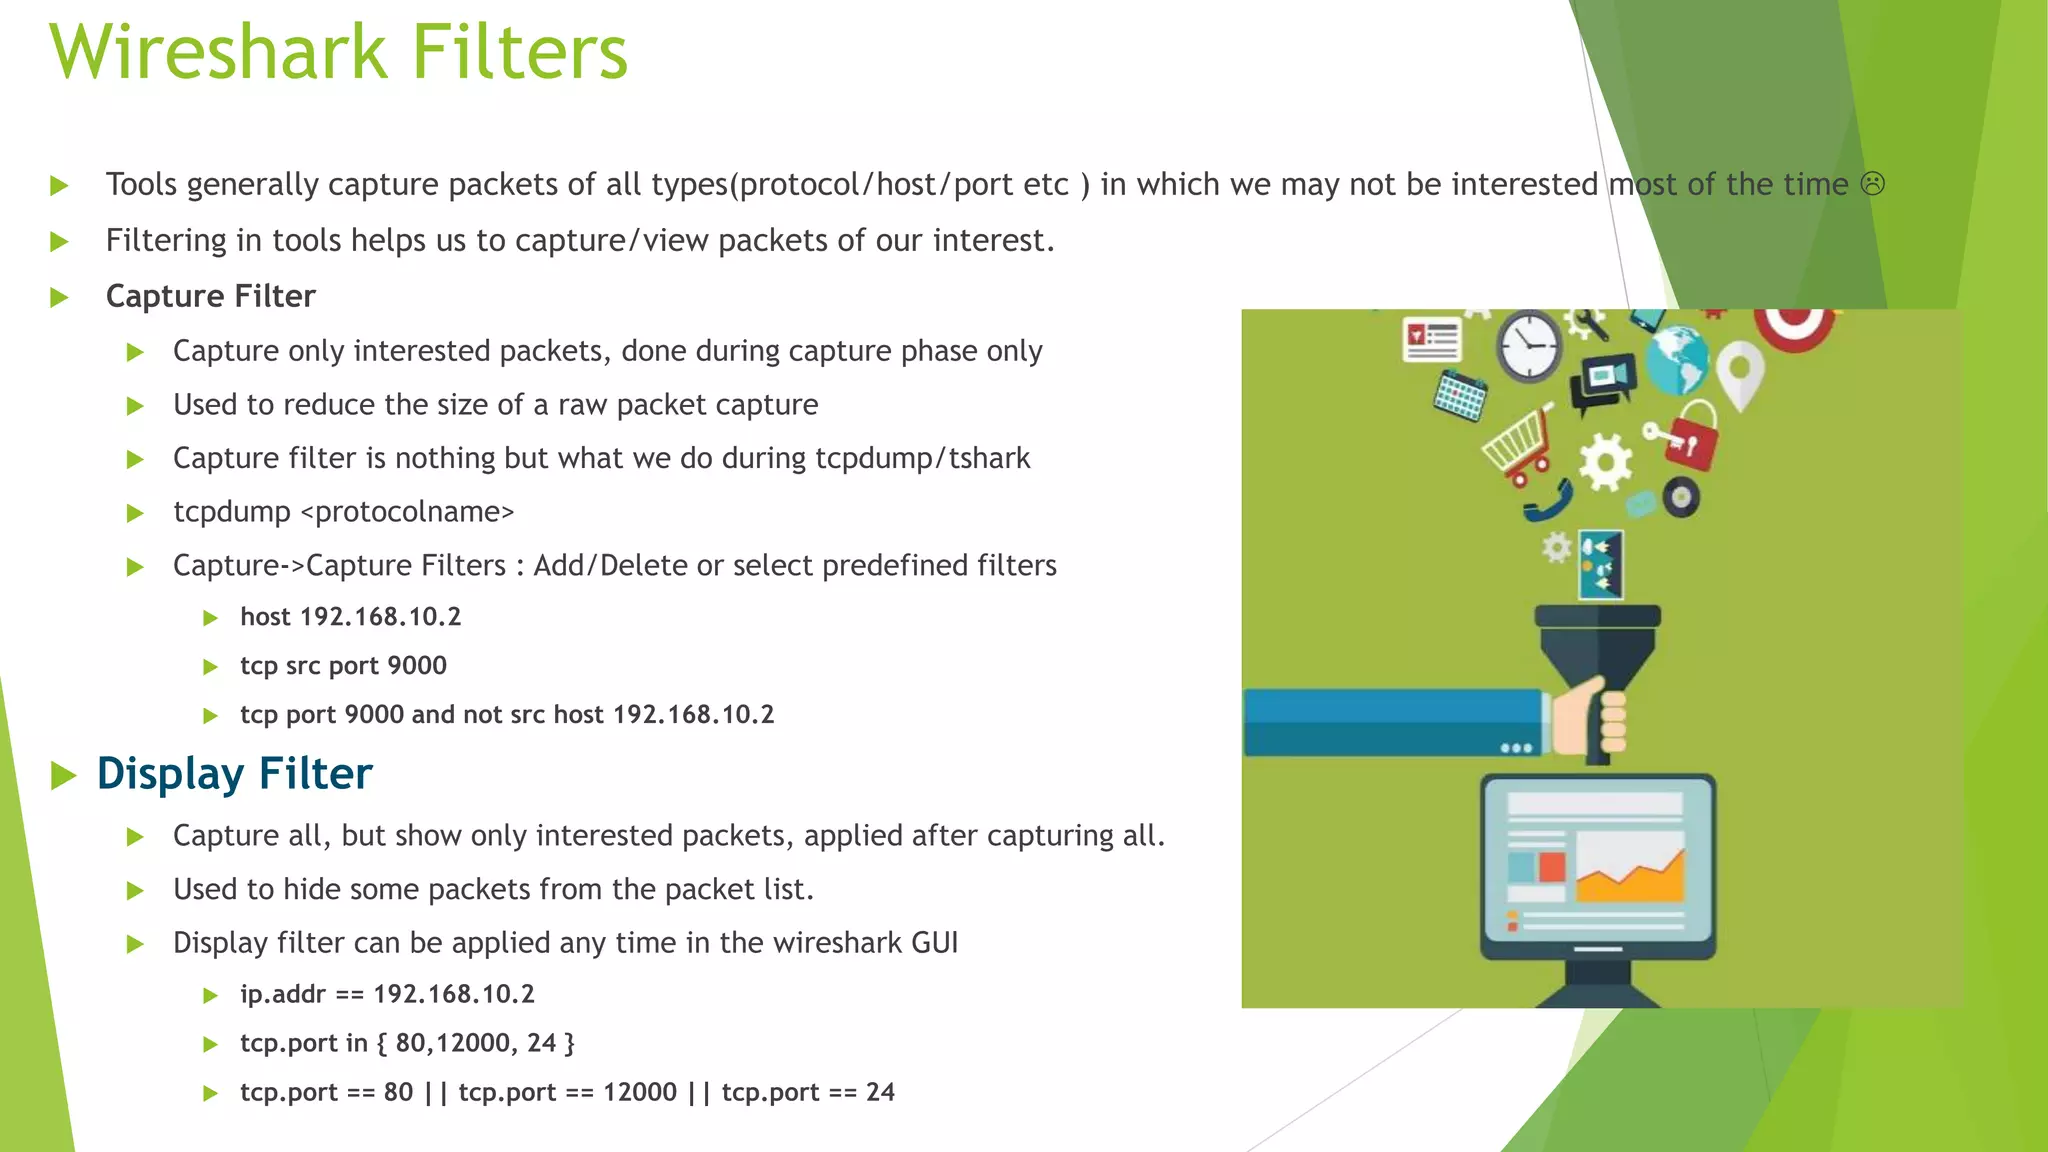
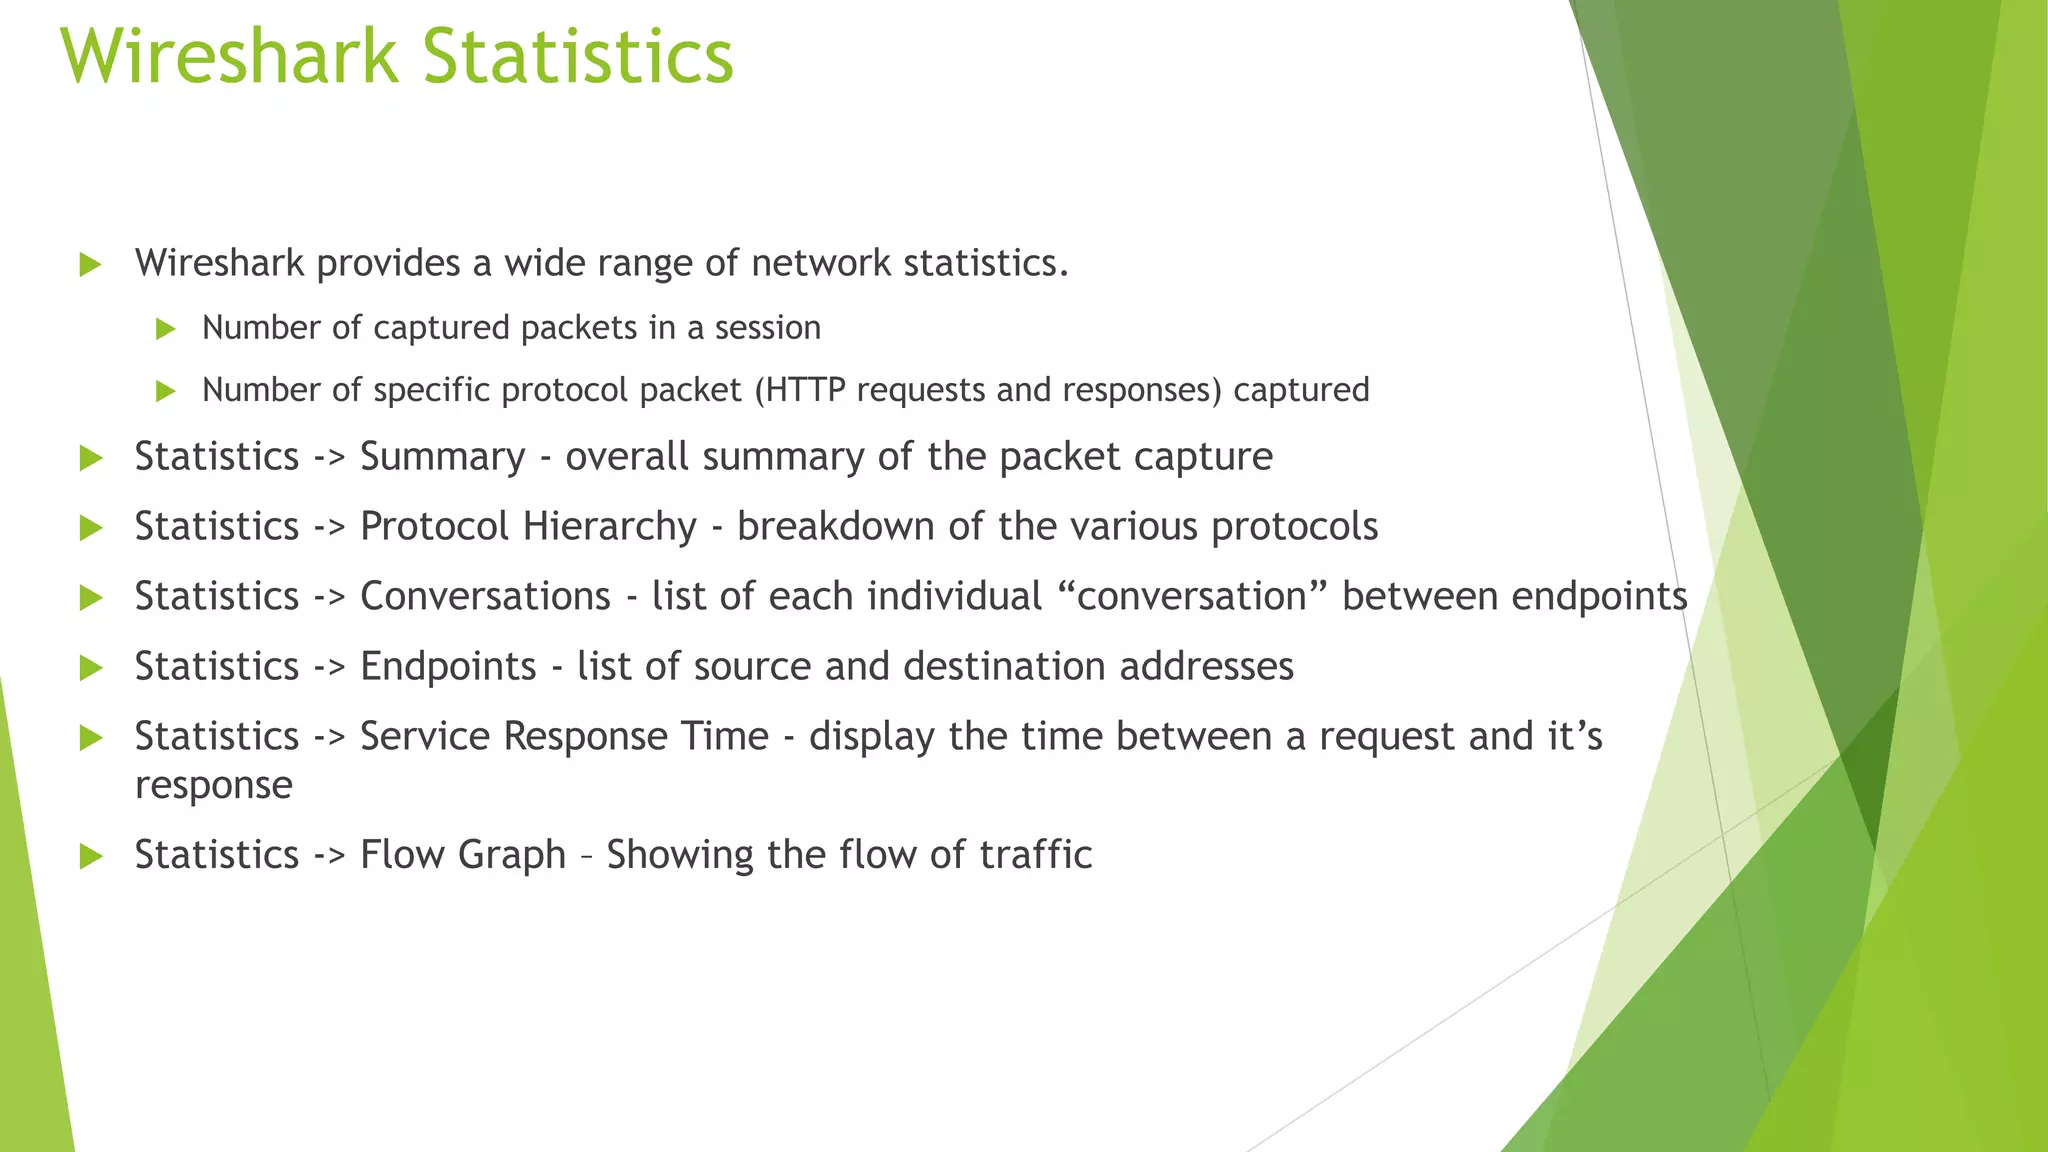
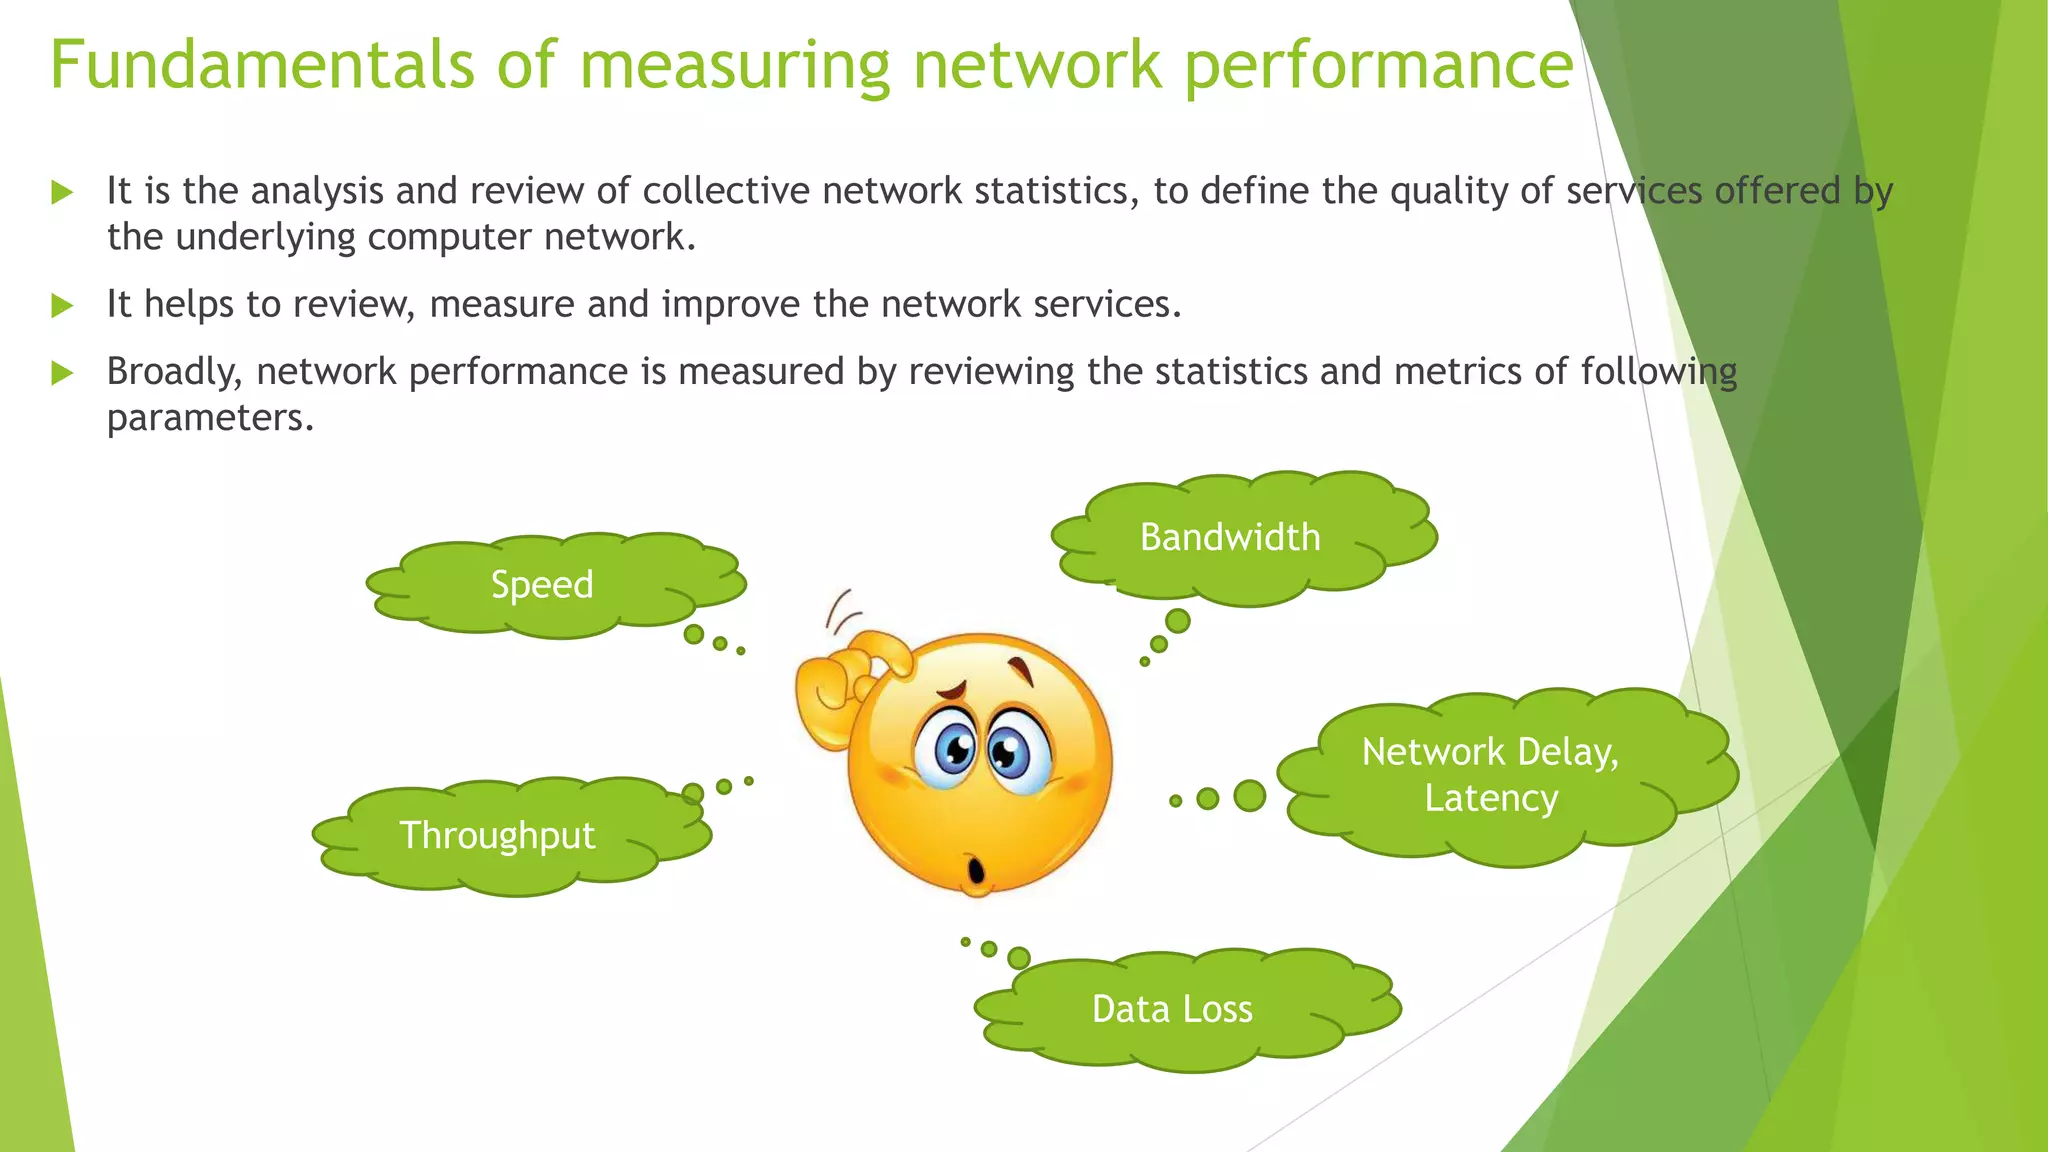
The document discusses various tools for analyzing network packets and measuring network performance, focusing on tools like tcpdump, tshark, and wireshark. It details how to use these tools to identify network problems, monitor usage, and gather statistics, along with the fundamentals of performance metrics such as speed, bandwidth, and latency. The conclusion emphasizes the importance of these tools in debugging, understanding network issues, and improving overall network management.


