Network Security and  Hacking Techniques Day -2
Network Packet Overview TCP/IP and Network Packet Overview Network Tools Overview TCPDUMP ETHREAL NTOP Multi Router Traffic Grapher (MRTG)
Typical Network Visible  IP Address Internal Network PC Servers Linux and windows Host Application Servers Like IDS,Sniffers What  inside ??
TCP/IP Packet Overview   TCP/IP 4 Layer Model
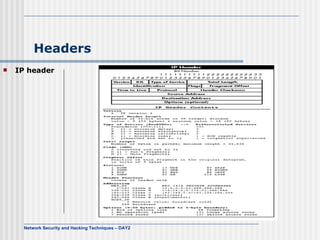
Headers IP header
Headers (Cont…) TCP headers
Headers (Cont…) UDP Headers
Headers (Cont…) ARP Headers
Headers (Cont…) ICMP Headers
The TCP 3 Way-Handshake
Network Tools Overview Network Monitoring and Debugging   The network interface configuration by ifconfig   root:/tmp> ifconfig –a eth0  Link encap:Ethernet  HWaddr 00:D0:09:28:F9:F9  inet addr:192.168.64.23  Bcast:192.168.64.255  Mask:255.255.255.0  UP BROADCAST RUNNING MULTICAST  MTU:1500  Metric:1  RX packets:10113996 errors:231 dropped:0 overruns:0 frame:231  TX packets:2575002 errors:0 dropped:0 overruns:0 carrier:0  collisions:0 txqueuelen:100  Interrupt:3 Base address:0xc000    lo  Link encap:Local Loopback  inet addr:127.0.0.1  Mask:255.0.0.0  UP LOOPBACK RUNNING  MTU:3924  Metric:1  RX packets:14022 errors:0 dropped:0 overruns:0 frame:0  TX packets:14022 errors:0 dropped:0 overruns:0 carrier:0  collisions:0 txqueuelen:0
Network Tools Overview(Cont…) Measure the throughput between two points  root:/root> ttcp -t -s testing.secureindia.com ttcp-t: buflen=8192, nbuf=2048, align=16384/0, port=5001  tcp  -> testing.secureindia.com ttcp-t: socket ttcp-t: connect ttcp-t: 16777216 bytes in 2.05 real seconds = 7978.76 KB/sec +++ ttcp-t: 2048 I/O calls, msec/call = 1.03, calls/sec = 997.35ttcp-t: 0.0user 0.4sys 0:02real 22% 0i+0d 0maxrss 0+2pf 0+0csw
Network Tools Overview(Cont…) Address Resolution by using arp   ARP command root23:/tmp> /sbin/arp –a  ntec93 (192.168.128.93) at  on eth0 router.arm.secureindia.net (192.168.64.254) at 00:B0:D0:11:CB:4B [ether] on eth0 castle (192.168.64.230) at 00:B0:D0:22:0A:28 [ether] on eth0 athena (192.168.64.232) at 00:01:02:3A:93:25 [ether] on eth0   PING host root23:/tmp> ping -c 2 ntec21 PING ntec21 (192.168.64.21) from 192.168.64.23 : 56(84) bytes of data. 64 bytes from ntec21 (192.168.64.21):icmp_seq=0 ttl=255 time=0.3 ms 64 bytes from ntec21 (192.168.64.21): icmp_seq=1 ttl=255 time=0.2 ms   --- ntec21 ping statistics --- 2 packets transmitted, 2 packets received, 0% packet loss round-trip min/avg/max = 0.2/0.2/0.3 ms
Network Tools Overview(Cont…) root23:/tmp> arp –a ntec93 (192.168.128.93) at  on eth0 rou.secureindia.net (192.168.64.254) at 00:B0:D0:11:CB:4B [ether] on eth0  castle (192.168.64.230) at 00:B0:D0:22:0A:28 [ether] on eth0 ntec21 (192.168.64.21) at 00:D0:09:4E:46:06 [ether] on eth0 athena (192.168.64.232) at 00:01:02:3A:93:25 [ether] on eth0
Network Tools Overview(Cont…) Tracing Routes using traceroute
Network Tools Overview(Cont…) Example of traceroute root# traceroute jksresearch.net traceroute to vsnl.com (202.54.1.73), 30 hops max, 38 byte packet Tracing the route to jksresearch.net (202.71.128.194)  1 telehouse3-telehouse1-100.1anetworks.net (193.243.177.10) 0 msec 0 msec 0 msec  2 195.66.224.166 [AS 5459] 0 msec 4 msec 0 msec  3 i-3-3.hhtstcbr01.net.reach.com (202.84.143.130) [AS 4637] 244 msec 248 msec 244 msec  4 i-1-1-0.hhtstcar02.net.reach.com (207.176.96.178) [AS 4637] 244 msec 244 msec 248 msec  5 202.40.142.138 [AS 4637] 368 msec 384 msec 368 msec  6 202.41.239.19 [AS 4637] 368 msec 388 msec 372 msec  7 202.41.232.10 [AS 4637] 492 msec 528 msec 512 msec  8 jksresearch.net (202.71.128.194) [AS 17447] 388 msec 384 msec 376 msec
Network Tools Overview(Cont…) Traffic analysis by using tcpdump tcpdump  dump all packets  tcpdump -ex  dump the packet header and the packet  content in hex  tcpdump -exa  dump the packet header and the packet  content in hex and ascii  tcpdump -c 500  dump 500 packets and exit  tcpdump -c 500 -w dump.log  dump 500 packets and write it to  dump.log file  tcpdump -r dump.log  read the packets from dump.log rather  than the network interface  tcpdump tcp  dump tcp packets only  tcpdump udp  dump udp packets only
Network Tools Overview(Cont…) Examples of tcpdump ARP   e.g   ntec1-20:/tmp> tcpdump -e arp tcpdump: listening on eth0  11:38:21.506049 0:50:56:45:0:67 Broadcast arp 42: arp who-has ntec9-20 tell ntec1-20 11:38:21.508609 0:50:56:45:0:46 0:50:56:45:0:67 arp 60: arp reply ntec9-20 is-at 0:50:56:45:0:46 11:38:21.582506 0:50:56:45:0:62 0:3:fd:fa:30:1c arp 60: arp who-has router-20.secureindia.net tell ntec3-20 11:38:21.582679 0:3:fd:fa:30:1c 0:50:56:45:0:62 arp 60: arp reply router-20.secureindia.net is-at 0:3:fd:fa:30:1c    The first field is time stamp (11:38:21.506049)  The second field is MAC address of ntec1-20 (0:50:56:45:0:67)  The third field is Broadcast MAC address (ff:ff:ff:ff:ff:ff)  Line 1: ntec1-20 broadcast the arp to ask for ntec9-20 hardware address.  Line 2: ntec9-20 (with the hardware address 0:50:56:45:0:46) tell ntec1-20 its hardware address  Line 3: My host (ntec1-20) has already cached the hardware address of router-20.secureindia.net. Therefore, it shows its hardware address in the third field
Network Tools Overview(Cont…) TCP   e.g  csh> tcpdump -c 500 -w dump.log   dump 500 packets to dump.log file   13:14:56.142688 eth0 < ntec24.1049 > ntec23.finger: S 3558267034:3558267034(0) win 32120  (DF) 13:14:56.142768 eth0 > ntec23.finger > ntec24.1049: S 3556473435:3556473435(0) ack 3558267035 win 30660  (DF) 13:14:56.142904 eth0 < ntec24.1049 > ntec23.finger: . 1:1(0) ack 1 win 32120  (DF) 13:14:56.142961 eth0 < ntec24.1049 > ntec23.finger: P 1:3(2) ack 1 win 32120  (DF) 13:14:56.143001 eth0 > ntec23.finger > ntec24.1049: . 1:1(0) ack 3 win 30660  (DF) 13:14:56.307305 eth0 > ntec23.finger > ntec24.1049: P 1:239(238) ack 3 win 31856  (DF) 13:14:56.307471 eth0 < ntec24.1049 > ntec23.finger: . 3:3(0) ack 239 win 31882  (DF) 13:14:56.307627 eth0 > ntec23.finger > ntec24.1049: F 239:239(0) ack 3 win 31856  (DF) 13:14:56.307738 eth0 < ntec24.1049 > ntec23.finger: . 3:3(0) ack 240 win 31881  (DF) 13:14:56.307873 eth0 < ntec24.1049 > ntec23.finger: F 3:3(0) ack 240 win 32120  (DF) 13:14:56.307904 eth0 > ntec23.finger > ntec24.1049: . 240:240(0) ack 4 win 31856  (DF)
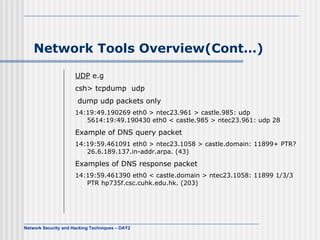
Network Tools Overview(Cont…) UDP  e.g csh> tcpdump  udp  dump udp packets only  14:19:49.190269 eth0 > ntec23.961 > castle.985: udp 56 14:19:49.190430 eth0 < castle.985 > ntec23.961: udp 28   Example of DNS query packet  14:19:59.461091 eth0 > ntec23.1058 > castle.domain: 11899+ PTR? 26.6.189.137.in-addr.arpa. (43)   Examples of DNS response packet  14:19:59.461390 eth0 < castle.domain > ntec23.1058: 11899 1/3/3 PTR hp735f.csc.cuhk.edu.hk. (203)
Ethereal : Network Tools This image shows Ethereal's main window. You can inspect the captured data in great detail, even while a capture session is in progress. Items in the packet list can be shown in any color you like
Ethereal : Network Tools (Conts..) This shows a DNS lookup from the server's perspective. It's interesting to note that the server issued four queries to resolve the name, and the client re-sent its query before the server could respond.
Ethereal : Network Tools (Conts..) The &quot;Follow TCP Stream&quot; item under the &quot;Analyze&quot; menu allows you to inspect the ASCII contents of a TCP data stream in a separate window. This can be invaluable for tracking down HTTP, SMTP, and POP server problems.
More tools for traffic analysis Ntop --  show network usage ntop is a network traffic probe that shows the network usage, similar to what the popular top Unix command does.  ntop users can use a a web browser to navigate through ntop (that acts as a web server) traffic information and get a dump of the network status.
Ntop --  show network usage
Multi Router Traffic Grapher (MRTG) MRTG The Multi Router Traffic Grapher (MRTG) is a tool to monitor the traffic load on network-links. MRTG generates HTML pages containing GIF images which provide a LIVE visual representation of this traffic. MRTG is based on Perl and C and works under UNIX and Windows NT.  E.G. The follow MRTG graph shows a peak traffic at 16:00
SUMMARY TCP/IP HEADERS TCPDUMP/WINDUMP ETHREAL NTOP MRTG
Typical Network Visible  IP Address Internal Network PC Servers Linux and windows Host Application Servers Like IDS,Sniffers What are these machines ???
Network Scanners Scan wide area network Using powerful network scanner, nmap Find the running hosts in the network Gather the host information Get root permission from the target host Hide himself from the admin
Network Scanners NMAP   Nessus
NMAP Using powerful network scanner, nmap nmap can do ftp bounce scan, stealth scan, OS prediction, and so on. http://www.insecure.org/ nmap For windows www.eeye.com/html/Research/Tools/nmapNT.html
NMAP NMAP does three things: Determines quickly if an IP address responds to TCP or ICMP pings. Sends packets to a target IP address to find which port numbers are open, closed, or filtered. Sends good packets and malformed packets to the target IP address and analyzes responses to try to guess what kind of operating system runs on the target computer.
NMAP NMAP stands for Network Mapper Ping Sweeping   # nmap -sP 192.168.7.0/24   Starting nmap V. 2.12 by Fyodor (fyodor@dhp.com,  www.insecure.org/nmap/)Host  (192.168.7.11) appears to be up. Host  (192.168.7.12) appears to be up. Host  (192.168.7.76) appears to be up. Nmap run completed -- 256 IP addresses (3 hosts up) scanned in 1 second   Port Scanning  #  nmap -sT 192.168.7.12   Starting nmap V. 2.12 by Fyodor (fyodor@dhp.com,  www.insecure.org/nmap/ ) Interesting ports on (192.168.7.12): Port  State  Protocol  Service 7  open  tcp  echo  9  open  tcp  discard  13  open  tcp  daytime  19  open  tcp  chargen  21  open  tcp  ftp  ...  Nmap run completed -- 1 IP address (1 host up) scanned in 3 seconds
NMAP (Cont…) Stealth Scanning   # nmap -sS 192.168.7.7  Starting nmap V. 2.12 by Fyodor ( [email_address] ,  www.insecure.org/nmap/)Interesting ports on saturnlink.nac.net (192.168.7.7): Port  State  Protocol  Service 21  open  tcp  ftp  25  open  tcp  smtp    53  open  tcp  domain    80  open  tcp  http  Nmap run completed -- 1 IP address (1 host up) scanned in 1 second  OS Fingerprinting  # nmap -sS -O 192.168.7.12  Starting nmap V. 2.12 by Fyodor ( [email_address] , www.insecure.org/nmap/)Interesting ports on comet (192.168.7.12): Port  State  Protocol  Service 7  open  tcp  echo  9  open  tcp  discard  13  open  tcp  daytime  19  open  tcp  chargen    21  open  tcp  ftp    ... Remote operating system guess:  Solaris 2.6 - 2.7  Nmap run completed -- 1 IP address (1 host up) scanned in 5 seconds
Nmap Front End
Nessus   Nessus is a software tool that provides host-based vulnerability scanning   Difference between Nessus and the majority of its competitors is the price tag – Nessus is free.   Nessus follows a client-server architecture
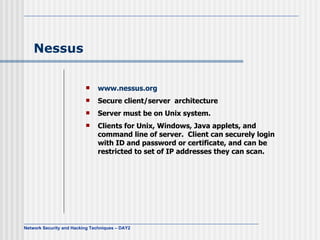
Nessus   www.nessus.org Secure client/server  architecture Server must be on Unix system.  Clients for Unix, Windows, Java applets, and command line of server.  Client can securely login with ID and password or certificate, and can be restricted to set of IP addresses they can scan.
Nessus  (Cont…) The client configuration
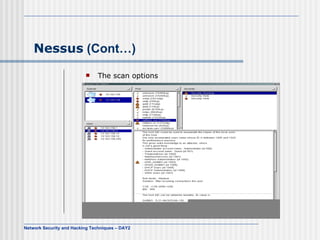
Nessus  (Cont…) The scan options
Nessus  (Cont…) Define the targets :
Nessus  (Cont…) After Starting
Nessus  (Cont…) Result
Summary Network Scanners NMAP NESSUS
Thank You

Day2

  • 1.
    Network Security and Hacking Techniques Day -2
  • 2.
    Network Packet OverviewTCP/IP and Network Packet Overview Network Tools Overview TCPDUMP ETHREAL NTOP Multi Router Traffic Grapher (MRTG)
  • 3.
    Typical Network Visible IP Address Internal Network PC Servers Linux and windows Host Application Servers Like IDS,Sniffers What inside ??
  • 4.
    TCP/IP Packet Overview TCP/IP 4 Layer Model
  • 5.
  • 6.
  • 7.
  • 8.
  • 9.
  • 10.
    The TCP 3Way-Handshake
  • 11.
    Network Tools OverviewNetwork Monitoring and Debugging The network interface configuration by ifconfig root:/tmp> ifconfig –a eth0 Link encap:Ethernet HWaddr 00:D0:09:28:F9:F9 inet addr:192.168.64.23 Bcast:192.168.64.255 Mask:255.255.255.0 UP BROADCAST RUNNING MULTICAST MTU:1500 Metric:1 RX packets:10113996 errors:231 dropped:0 overruns:0 frame:231 TX packets:2575002 errors:0 dropped:0 overruns:0 carrier:0 collisions:0 txqueuelen:100 Interrupt:3 Base address:0xc000   lo Link encap:Local Loopback inet addr:127.0.0.1 Mask:255.0.0.0 UP LOOPBACK RUNNING MTU:3924 Metric:1 RX packets:14022 errors:0 dropped:0 overruns:0 frame:0 TX packets:14022 errors:0 dropped:0 overruns:0 carrier:0 collisions:0 txqueuelen:0
  • 12.
    Network Tools Overview(Cont…)Measure the throughput between two points root:/root> ttcp -t -s testing.secureindia.com ttcp-t: buflen=8192, nbuf=2048, align=16384/0, port=5001 tcp -> testing.secureindia.com ttcp-t: socket ttcp-t: connect ttcp-t: 16777216 bytes in 2.05 real seconds = 7978.76 KB/sec +++ ttcp-t: 2048 I/O calls, msec/call = 1.03, calls/sec = 997.35ttcp-t: 0.0user 0.4sys 0:02real 22% 0i+0d 0maxrss 0+2pf 0+0csw
  • 13.
    Network Tools Overview(Cont…)Address Resolution by using arp ARP command root23:/tmp> /sbin/arp –a ntec93 (192.168.128.93) at on eth0 router.arm.secureindia.net (192.168.64.254) at 00:B0:D0:11:CB:4B [ether] on eth0 castle (192.168.64.230) at 00:B0:D0:22:0A:28 [ether] on eth0 athena (192.168.64.232) at 00:01:02:3A:93:25 [ether] on eth0 PING host root23:/tmp> ping -c 2 ntec21 PING ntec21 (192.168.64.21) from 192.168.64.23 : 56(84) bytes of data. 64 bytes from ntec21 (192.168.64.21):icmp_seq=0 ttl=255 time=0.3 ms 64 bytes from ntec21 (192.168.64.21): icmp_seq=1 ttl=255 time=0.2 ms --- ntec21 ping statistics --- 2 packets transmitted, 2 packets received, 0% packet loss round-trip min/avg/max = 0.2/0.2/0.3 ms
  • 14.
    Network Tools Overview(Cont…)root23:/tmp> arp –a ntec93 (192.168.128.93) at on eth0 rou.secureindia.net (192.168.64.254) at 00:B0:D0:11:CB:4B [ether] on eth0 castle (192.168.64.230) at 00:B0:D0:22:0A:28 [ether] on eth0 ntec21 (192.168.64.21) at 00:D0:09:4E:46:06 [ether] on eth0 athena (192.168.64.232) at 00:01:02:3A:93:25 [ether] on eth0
  • 15.
    Network Tools Overview(Cont…)Tracing Routes using traceroute
  • 16.
    Network Tools Overview(Cont…)Example of traceroute root# traceroute jksresearch.net traceroute to vsnl.com (202.54.1.73), 30 hops max, 38 byte packet Tracing the route to jksresearch.net (202.71.128.194) 1 telehouse3-telehouse1-100.1anetworks.net (193.243.177.10) 0 msec 0 msec 0 msec 2 195.66.224.166 [AS 5459] 0 msec 4 msec 0 msec 3 i-3-3.hhtstcbr01.net.reach.com (202.84.143.130) [AS 4637] 244 msec 248 msec 244 msec 4 i-1-1-0.hhtstcar02.net.reach.com (207.176.96.178) [AS 4637] 244 msec 244 msec 248 msec 5 202.40.142.138 [AS 4637] 368 msec 384 msec 368 msec 6 202.41.239.19 [AS 4637] 368 msec 388 msec 372 msec 7 202.41.232.10 [AS 4637] 492 msec 528 msec 512 msec 8 jksresearch.net (202.71.128.194) [AS 17447] 388 msec 384 msec 376 msec
  • 17.
    Network Tools Overview(Cont…)Traffic analysis by using tcpdump tcpdump dump all packets tcpdump -ex dump the packet header and the packet content in hex tcpdump -exa dump the packet header and the packet content in hex and ascii tcpdump -c 500 dump 500 packets and exit tcpdump -c 500 -w dump.log dump 500 packets and write it to dump.log file tcpdump -r dump.log read the packets from dump.log rather than the network interface tcpdump tcp dump tcp packets only tcpdump udp dump udp packets only
  • 18.
    Network Tools Overview(Cont…)Examples of tcpdump ARP e.g ntec1-20:/tmp> tcpdump -e arp tcpdump: listening on eth0  11:38:21.506049 0:50:56:45:0:67 Broadcast arp 42: arp who-has ntec9-20 tell ntec1-20 11:38:21.508609 0:50:56:45:0:46 0:50:56:45:0:67 arp 60: arp reply ntec9-20 is-at 0:50:56:45:0:46 11:38:21.582506 0:50:56:45:0:62 0:3:fd:fa:30:1c arp 60: arp who-has router-20.secureindia.net tell ntec3-20 11:38:21.582679 0:3:fd:fa:30:1c 0:50:56:45:0:62 arp 60: arp reply router-20.secureindia.net is-at 0:3:fd:fa:30:1c  The first field is time stamp (11:38:21.506049) The second field is MAC address of ntec1-20 (0:50:56:45:0:67) The third field is Broadcast MAC address (ff:ff:ff:ff:ff:ff) Line 1: ntec1-20 broadcast the arp to ask for ntec9-20 hardware address. Line 2: ntec9-20 (with the hardware address 0:50:56:45:0:46) tell ntec1-20 its hardware address Line 3: My host (ntec1-20) has already cached the hardware address of router-20.secureindia.net. Therefore, it shows its hardware address in the third field
  • 19.
    Network Tools Overview(Cont…)TCP e.g csh> tcpdump -c 500 -w dump.log dump 500 packets to dump.log file 13:14:56.142688 eth0 < ntec24.1049 > ntec23.finger: S 3558267034:3558267034(0) win 32120 (DF) 13:14:56.142768 eth0 > ntec23.finger > ntec24.1049: S 3556473435:3556473435(0) ack 3558267035 win 30660 (DF) 13:14:56.142904 eth0 < ntec24.1049 > ntec23.finger: . 1:1(0) ack 1 win 32120 (DF) 13:14:56.142961 eth0 < ntec24.1049 > ntec23.finger: P 1:3(2) ack 1 win 32120 (DF) 13:14:56.143001 eth0 > ntec23.finger > ntec24.1049: . 1:1(0) ack 3 win 30660 (DF) 13:14:56.307305 eth0 > ntec23.finger > ntec24.1049: P 1:239(238) ack 3 win 31856 (DF) 13:14:56.307471 eth0 < ntec24.1049 > ntec23.finger: . 3:3(0) ack 239 win 31882 (DF) 13:14:56.307627 eth0 > ntec23.finger > ntec24.1049: F 239:239(0) ack 3 win 31856 (DF) 13:14:56.307738 eth0 < ntec24.1049 > ntec23.finger: . 3:3(0) ack 240 win 31881 (DF) 13:14:56.307873 eth0 < ntec24.1049 > ntec23.finger: F 3:3(0) ack 240 win 32120 (DF) 13:14:56.307904 eth0 > ntec23.finger > ntec24.1049: . 240:240(0) ack 4 win 31856 (DF)
  • 20.
    Network Tools Overview(Cont…)UDP e.g csh> tcpdump udp dump udp packets only  14:19:49.190269 eth0 > ntec23.961 > castle.985: udp 56 14:19:49.190430 eth0 < castle.985 > ntec23.961: udp 28 Example of DNS query packet  14:19:59.461091 eth0 > ntec23.1058 > castle.domain: 11899+ PTR? 26.6.189.137.in-addr.arpa. (43) Examples of DNS response packet  14:19:59.461390 eth0 < castle.domain > ntec23.1058: 11899 1/3/3 PTR hp735f.csc.cuhk.edu.hk. (203)
  • 21.
    Ethereal : NetworkTools This image shows Ethereal's main window. You can inspect the captured data in great detail, even while a capture session is in progress. Items in the packet list can be shown in any color you like
  • 22.
    Ethereal : NetworkTools (Conts..) This shows a DNS lookup from the server's perspective. It's interesting to note that the server issued four queries to resolve the name, and the client re-sent its query before the server could respond.
  • 23.
    Ethereal : NetworkTools (Conts..) The &quot;Follow TCP Stream&quot; item under the &quot;Analyze&quot; menu allows you to inspect the ASCII contents of a TCP data stream in a separate window. This can be invaluable for tracking down HTTP, SMTP, and POP server problems.
  • 24.
    More tools fortraffic analysis Ntop -- show network usage ntop is a network traffic probe that shows the network usage, similar to what the popular top Unix command does. ntop users can use a a web browser to navigate through ntop (that acts as a web server) traffic information and get a dump of the network status.
  • 25.
    Ntop -- show network usage
  • 26.
    Multi Router TrafficGrapher (MRTG) MRTG The Multi Router Traffic Grapher (MRTG) is a tool to monitor the traffic load on network-links. MRTG generates HTML pages containing GIF images which provide a LIVE visual representation of this traffic. MRTG is based on Perl and C and works under UNIX and Windows NT. E.G. The follow MRTG graph shows a peak traffic at 16:00
  • 27.
    SUMMARY TCP/IP HEADERSTCPDUMP/WINDUMP ETHREAL NTOP MRTG
  • 28.
    Typical Network Visible IP Address Internal Network PC Servers Linux and windows Host Application Servers Like IDS,Sniffers What are these machines ???
  • 29.
    Network Scanners Scanwide area network Using powerful network scanner, nmap Find the running hosts in the network Gather the host information Get root permission from the target host Hide himself from the admin
  • 30.
  • 31.
    NMAP Using powerfulnetwork scanner, nmap nmap can do ftp bounce scan, stealth scan, OS prediction, and so on. http://www.insecure.org/ nmap For windows www.eeye.com/html/Research/Tools/nmapNT.html
  • 32.
    NMAP NMAP doesthree things: Determines quickly if an IP address responds to TCP or ICMP pings. Sends packets to a target IP address to find which port numbers are open, closed, or filtered. Sends good packets and malformed packets to the target IP address and analyzes responses to try to guess what kind of operating system runs on the target computer.
  • 33.
    NMAP NMAP standsfor Network Mapper Ping Sweeping # nmap -sP 192.168.7.0/24   Starting nmap V. 2.12 by Fyodor (fyodor@dhp.com, www.insecure.org/nmap/)Host (192.168.7.11) appears to be up. Host (192.168.7.12) appears to be up. Host (192.168.7.76) appears to be up. Nmap run completed -- 256 IP addresses (3 hosts up) scanned in 1 second Port Scanning # nmap -sT 192.168.7.12   Starting nmap V. 2.12 by Fyodor (fyodor@dhp.com, www.insecure.org/nmap/ ) Interesting ports on (192.168.7.12): Port State Protocol Service 7 open tcp echo 9 open tcp discard 13 open tcp daytime 19 open tcp chargen 21 open tcp ftp ...  Nmap run completed -- 1 IP address (1 host up) scanned in 3 seconds
  • 34.
    NMAP (Cont…) StealthScanning # nmap -sS 192.168.7.7  Starting nmap V. 2.12 by Fyodor ( [email_address] , www.insecure.org/nmap/)Interesting ports on saturnlink.nac.net (192.168.7.7): Port State Protocol Service 21 open tcp ftp 25 open tcp smtp 53 open tcp domain 80 open tcp http Nmap run completed -- 1 IP address (1 host up) scanned in 1 second OS Fingerprinting # nmap -sS -O 192.168.7.12  Starting nmap V. 2.12 by Fyodor ( [email_address] , www.insecure.org/nmap/)Interesting ports on comet (192.168.7.12): Port State Protocol Service 7 open tcp echo 9 open tcp discard 13 open tcp daytime 19 open tcp chargen 21 open tcp ftp ... Remote operating system guess: Solaris 2.6 - 2.7  Nmap run completed -- 1 IP address (1 host up) scanned in 5 seconds
  • 35.
  • 36.
    Nessus Nessus is a software tool that provides host-based vulnerability scanning Difference between Nessus and the majority of its competitors is the price tag – Nessus is free. Nessus follows a client-server architecture
  • 37.
    Nessus www.nessus.org Secure client/server architecture Server must be on Unix system. Clients for Unix, Windows, Java applets, and command line of server. Client can securely login with ID and password or certificate, and can be restricted to set of IP addresses they can scan.
  • 38.
    Nessus (Cont…)The client configuration
  • 39.
    Nessus (Cont…)The scan options
  • 40.
    Nessus (Cont…)Define the targets :
  • 41.
    Nessus (Cont…)After Starting
  • 42.
  • 43.
  • 44.