Downloaded 34 times


![• The simplest way to run tcpdump is interactively by simply
typing the program's name.
• Another alternative is to run tcpdump as a detached process
by including an & at the end of the command line. Here is an
example:
bsd1# tcpdump -w outfile &
[1] 70260
bsd1# tcpdump: listening on xl0
• The command starts tcpdump, prints a process number, and
returns the user prompt along with a message that tcpdump
has started.
• You can now enter commands to generate the traffic you are
interested in.](https://image.slidesharecdn.com/packetcapture-160524084951/75/Packet-capture-in-network-security-11-2048.jpg)
![• Once you have generated the traffic of interest, you can
terminate tcpdump by issuing a kill command using the
process number reported when tcpdump was started.
• You can use the ps command if you have forgotten the
process number.
bsd1# kill 70260
153 packets received by filter
0 packets dropped by kernel
[1] Done tcpdump -w outfile
• You can now analyze the capture file.](https://image.slidesharecdn.com/packetcapture-160524084951/75/Packet-capture-in-network-security-12-2048.jpg)


The document discusses packet capture as a vital network troubleshooting tool, highlighting the importance of capturing traffic to understand network issues. It details various tools for capturing and analyzing packets, such as tcpdump and ethereal, and explains their functions, uses, and command options. Additionally, it addresses the need for access to network traffic and the implications for security and privacy.
Introduction to packet capture as a troubleshooting tool, important for network traffic analysis. Misuse can risk system security and privacy.
Explains various traffic capture tools such as packet sniffers, analyzers, and monitors, highlighting differences in analysis types.
Discusses access limitations to network traffic and various methods to capture data, including portable computers and probes.
Details methods for capturing data using software and hardware, including the use of promiscuous mode for packet capture.
Introduction to tcpdump, its capabilities as a packet sniffer, and its advantages and disadvantages, especially regarding analysis.
Describes how to run tcpdump interactively and as a detached process, including command syntax for capturing data.
Tcpdump options for writing captured data to files, controlling program behavior, and managing output to aid in analysis.
Details on command-line options for controlling tcpdump behavior, such as output redirection and limiting packet capture.
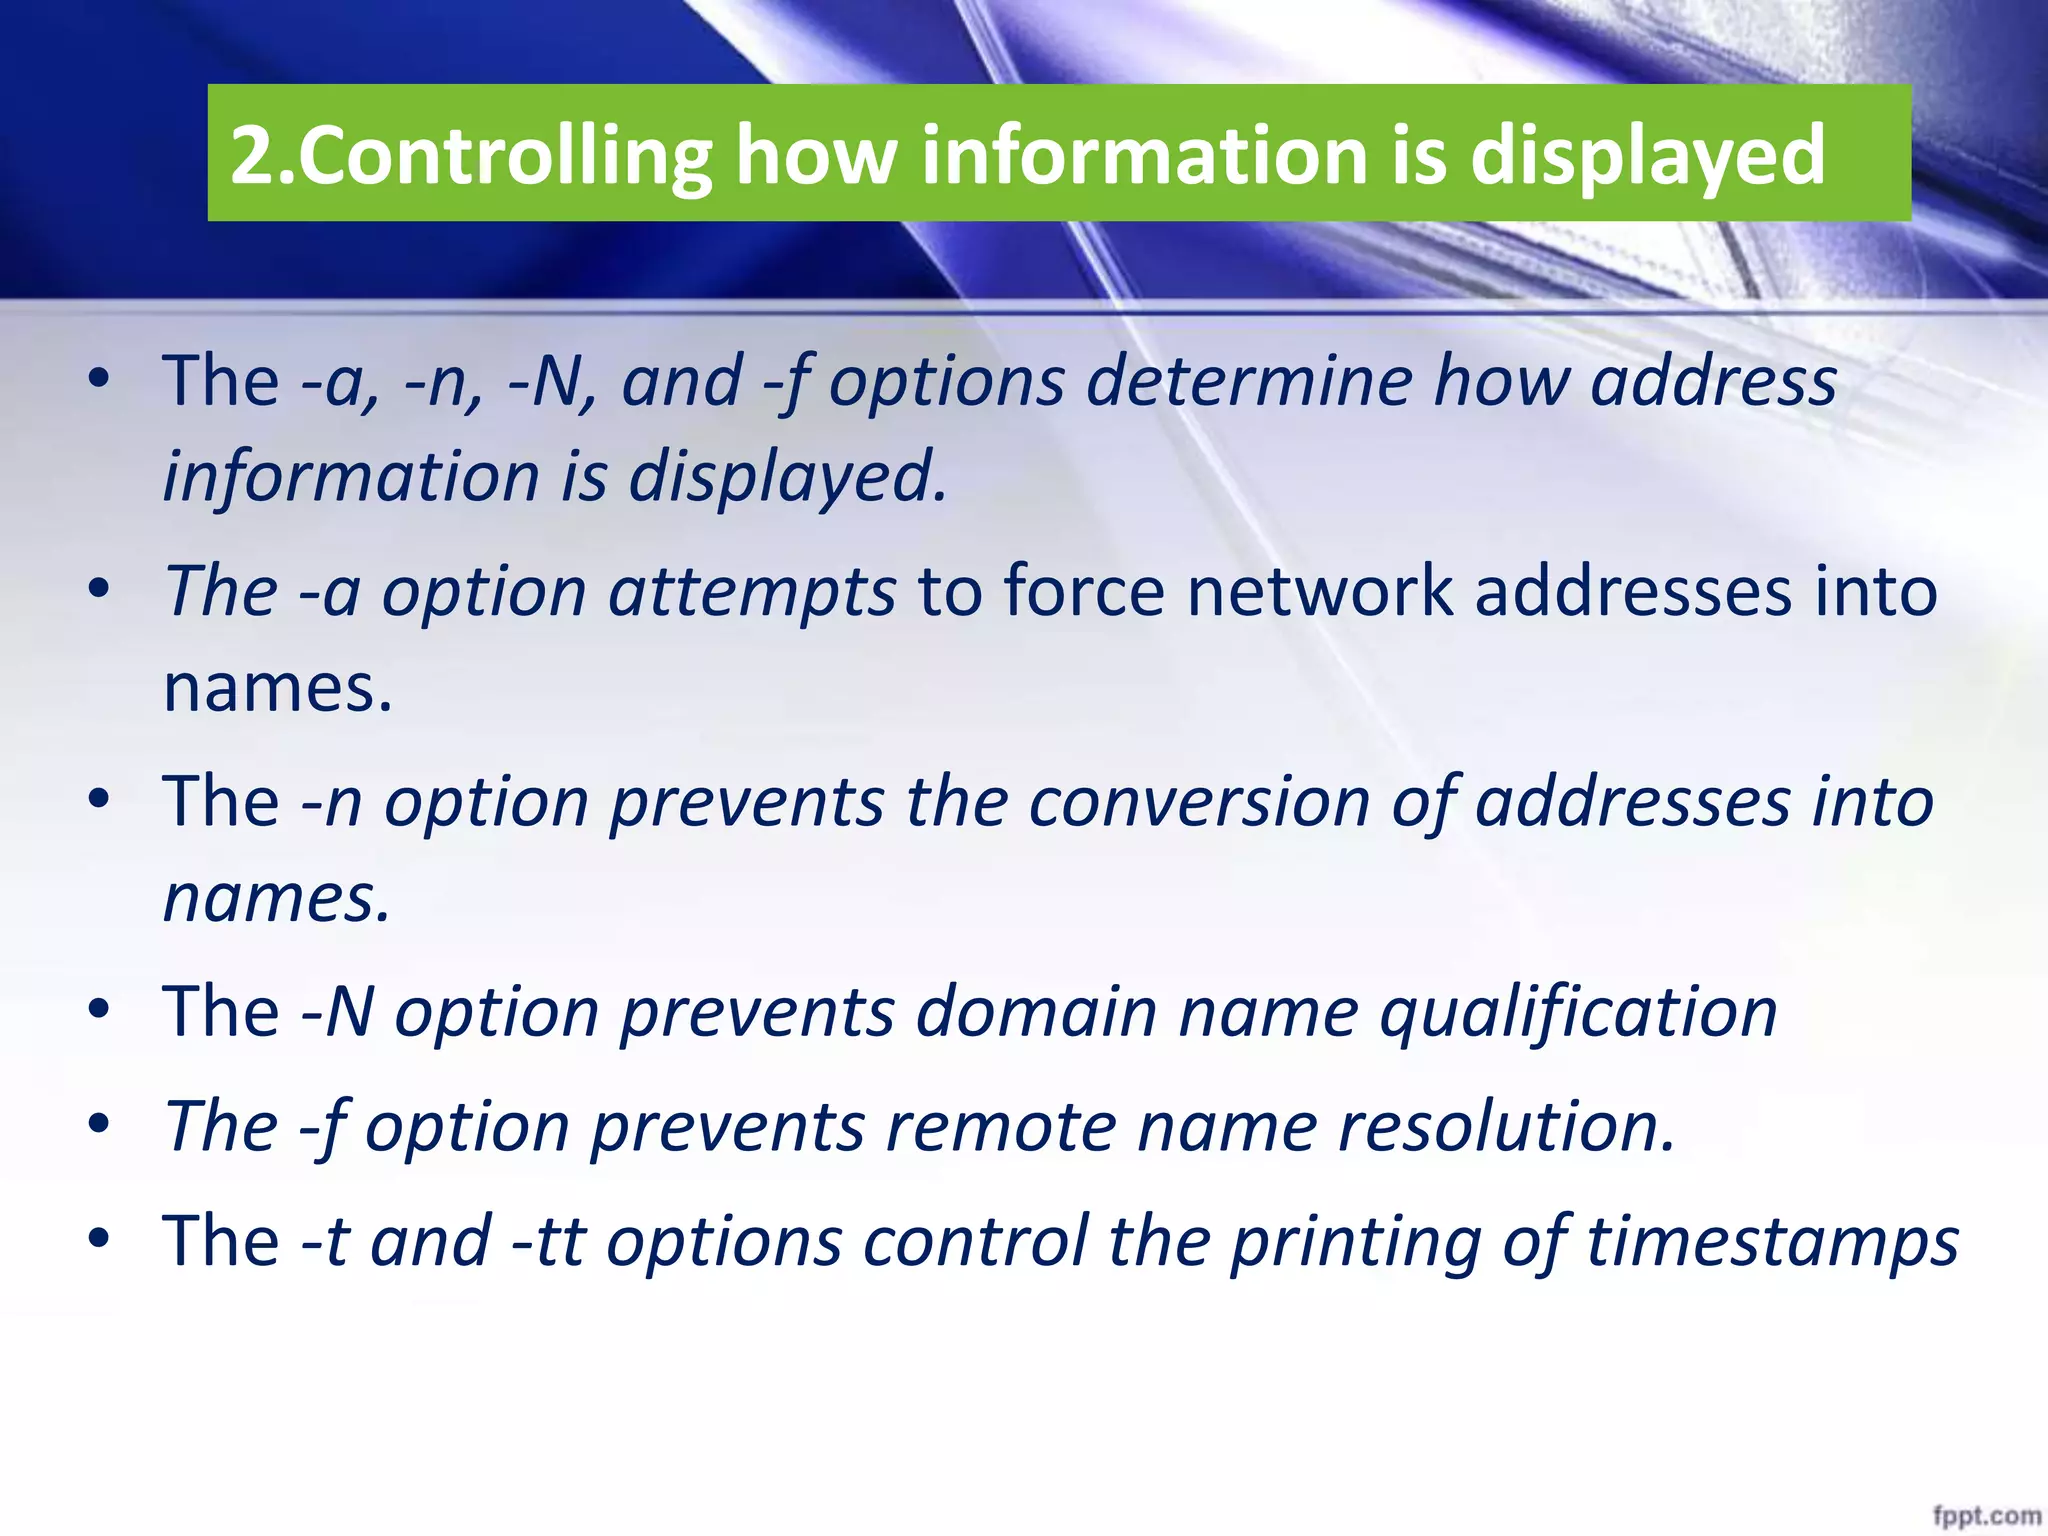
Explains how to control data display in tcpdump, including formatting options and how address information is represented.
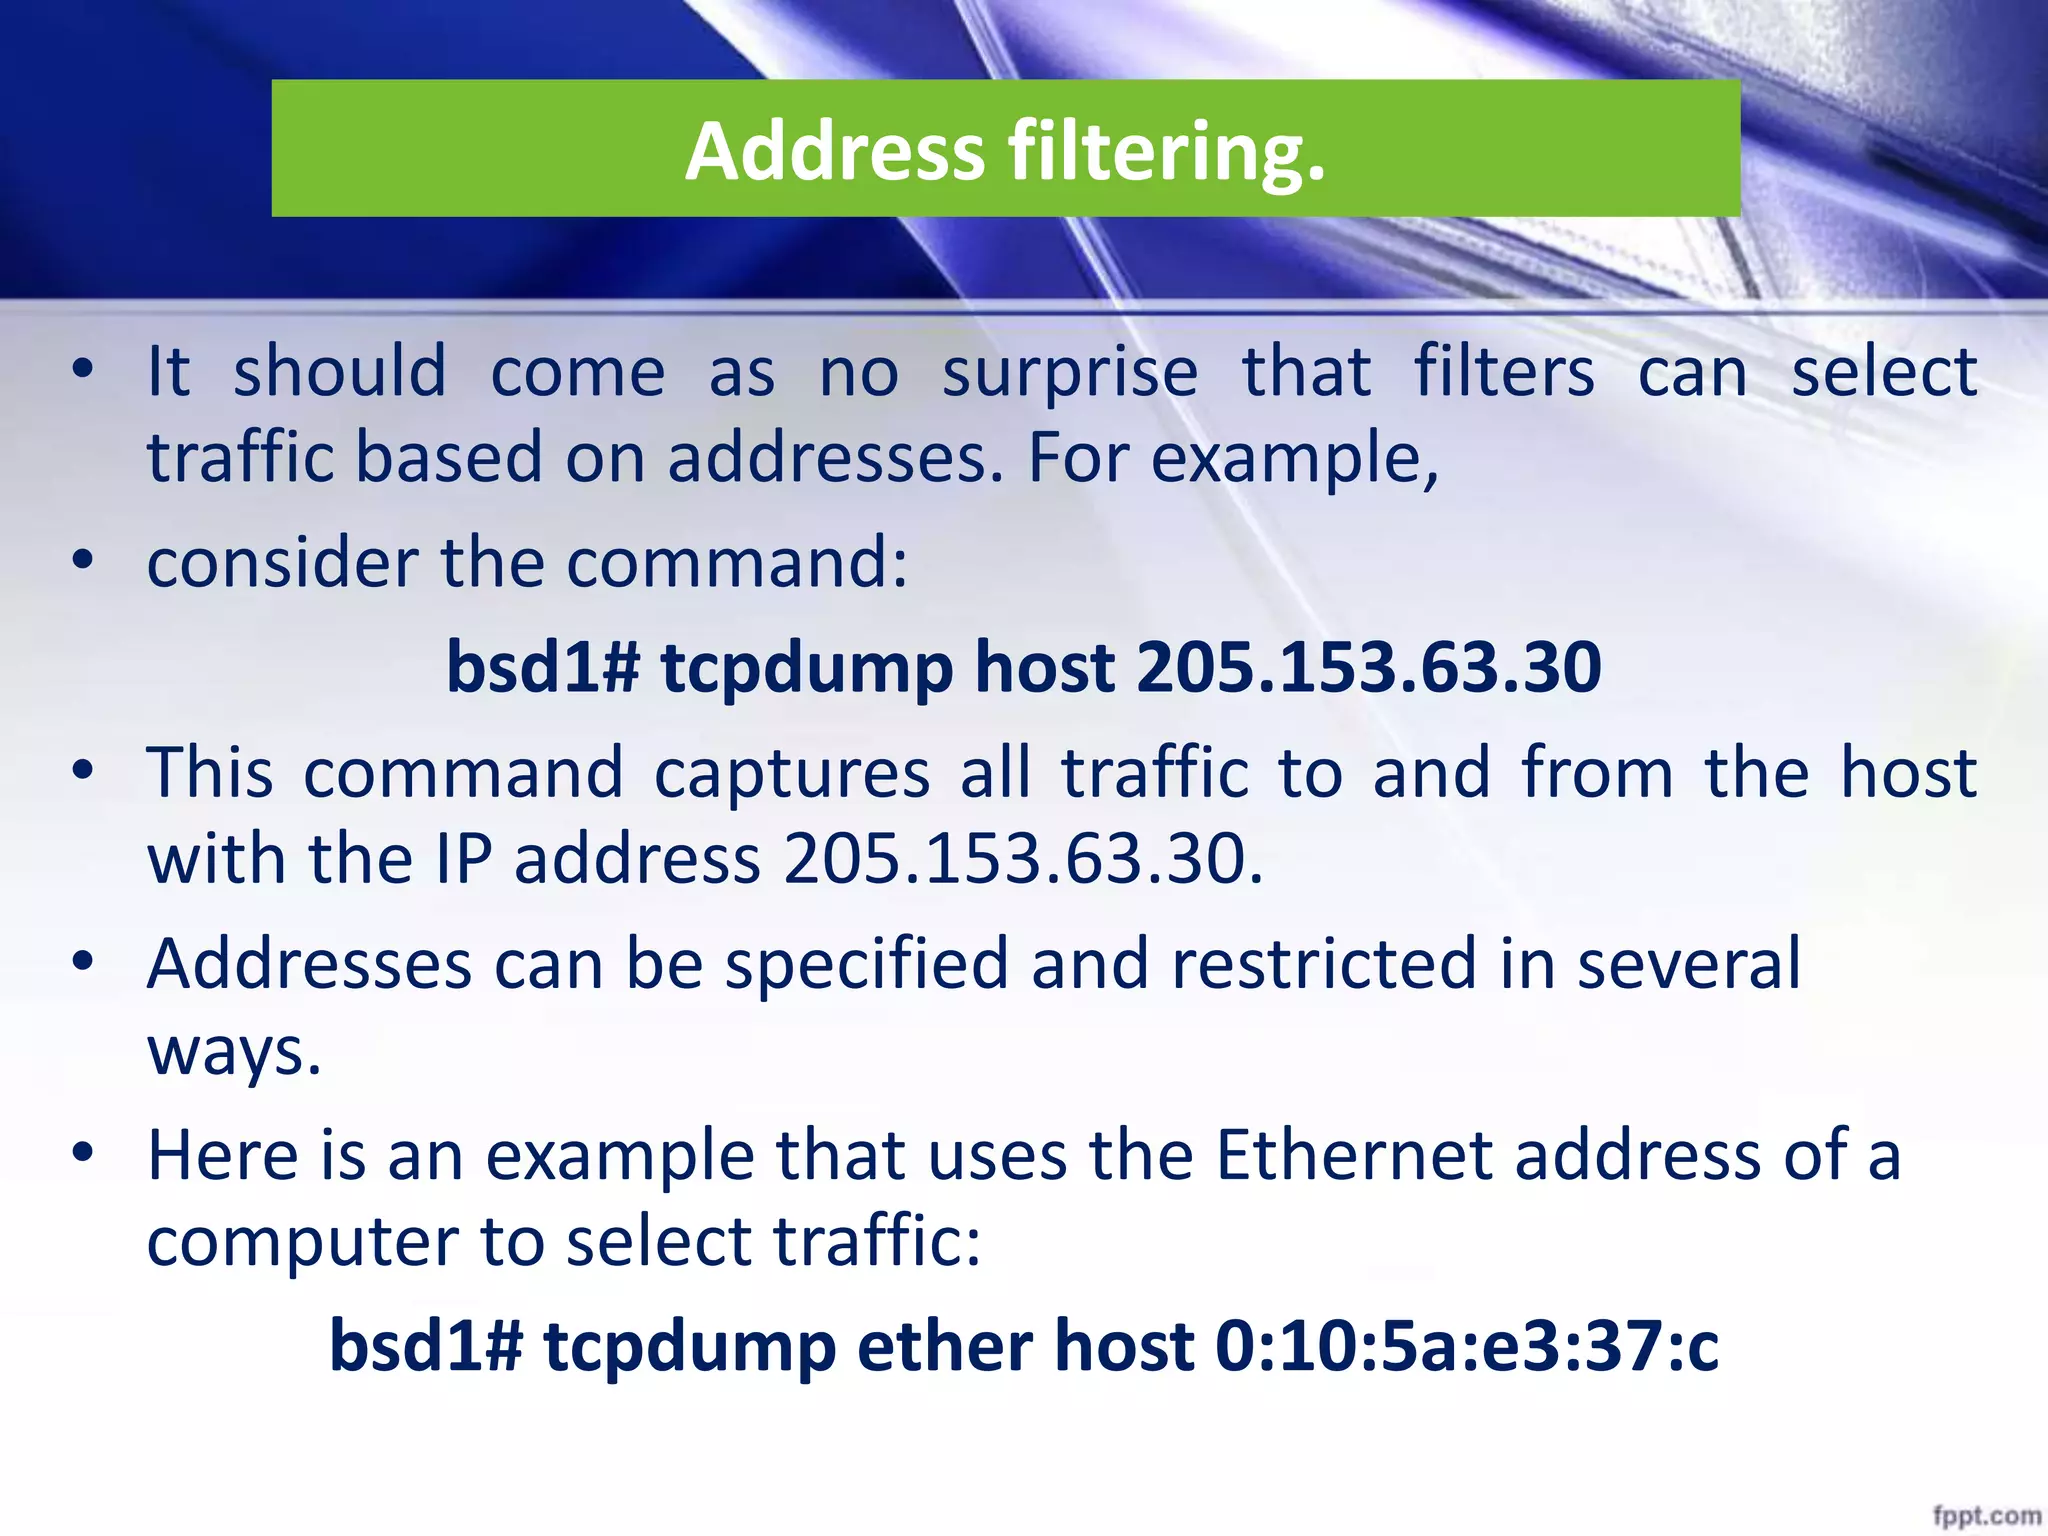
Overview of filtering techniques in tcpdump, including address filtering to focus on specific traffic.
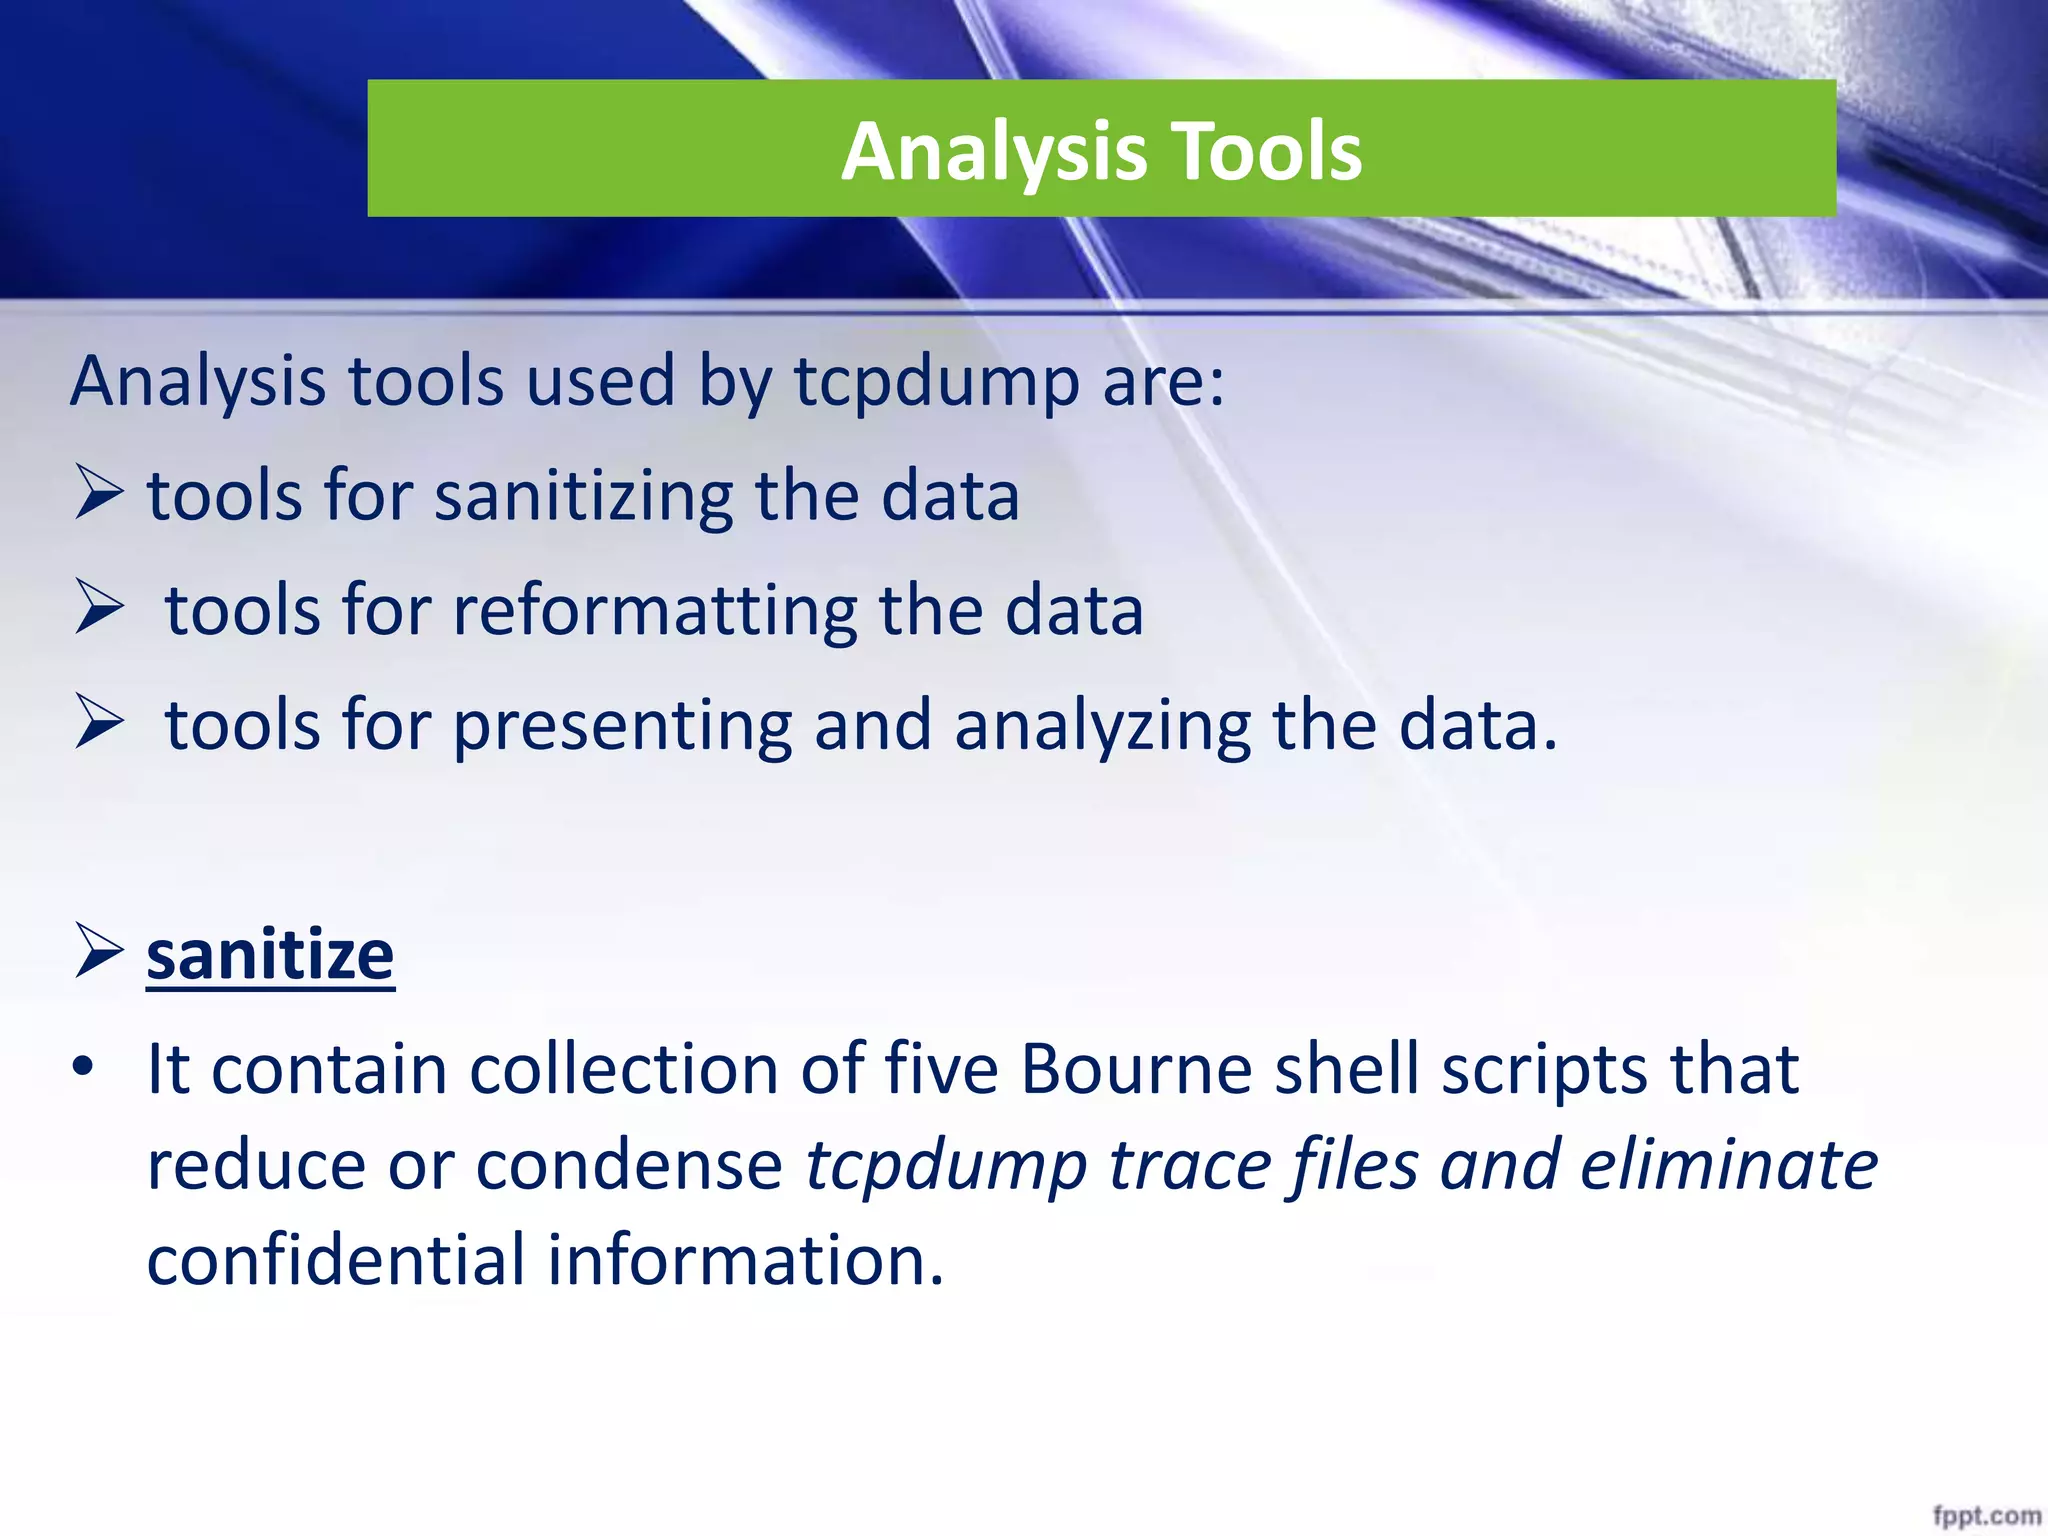
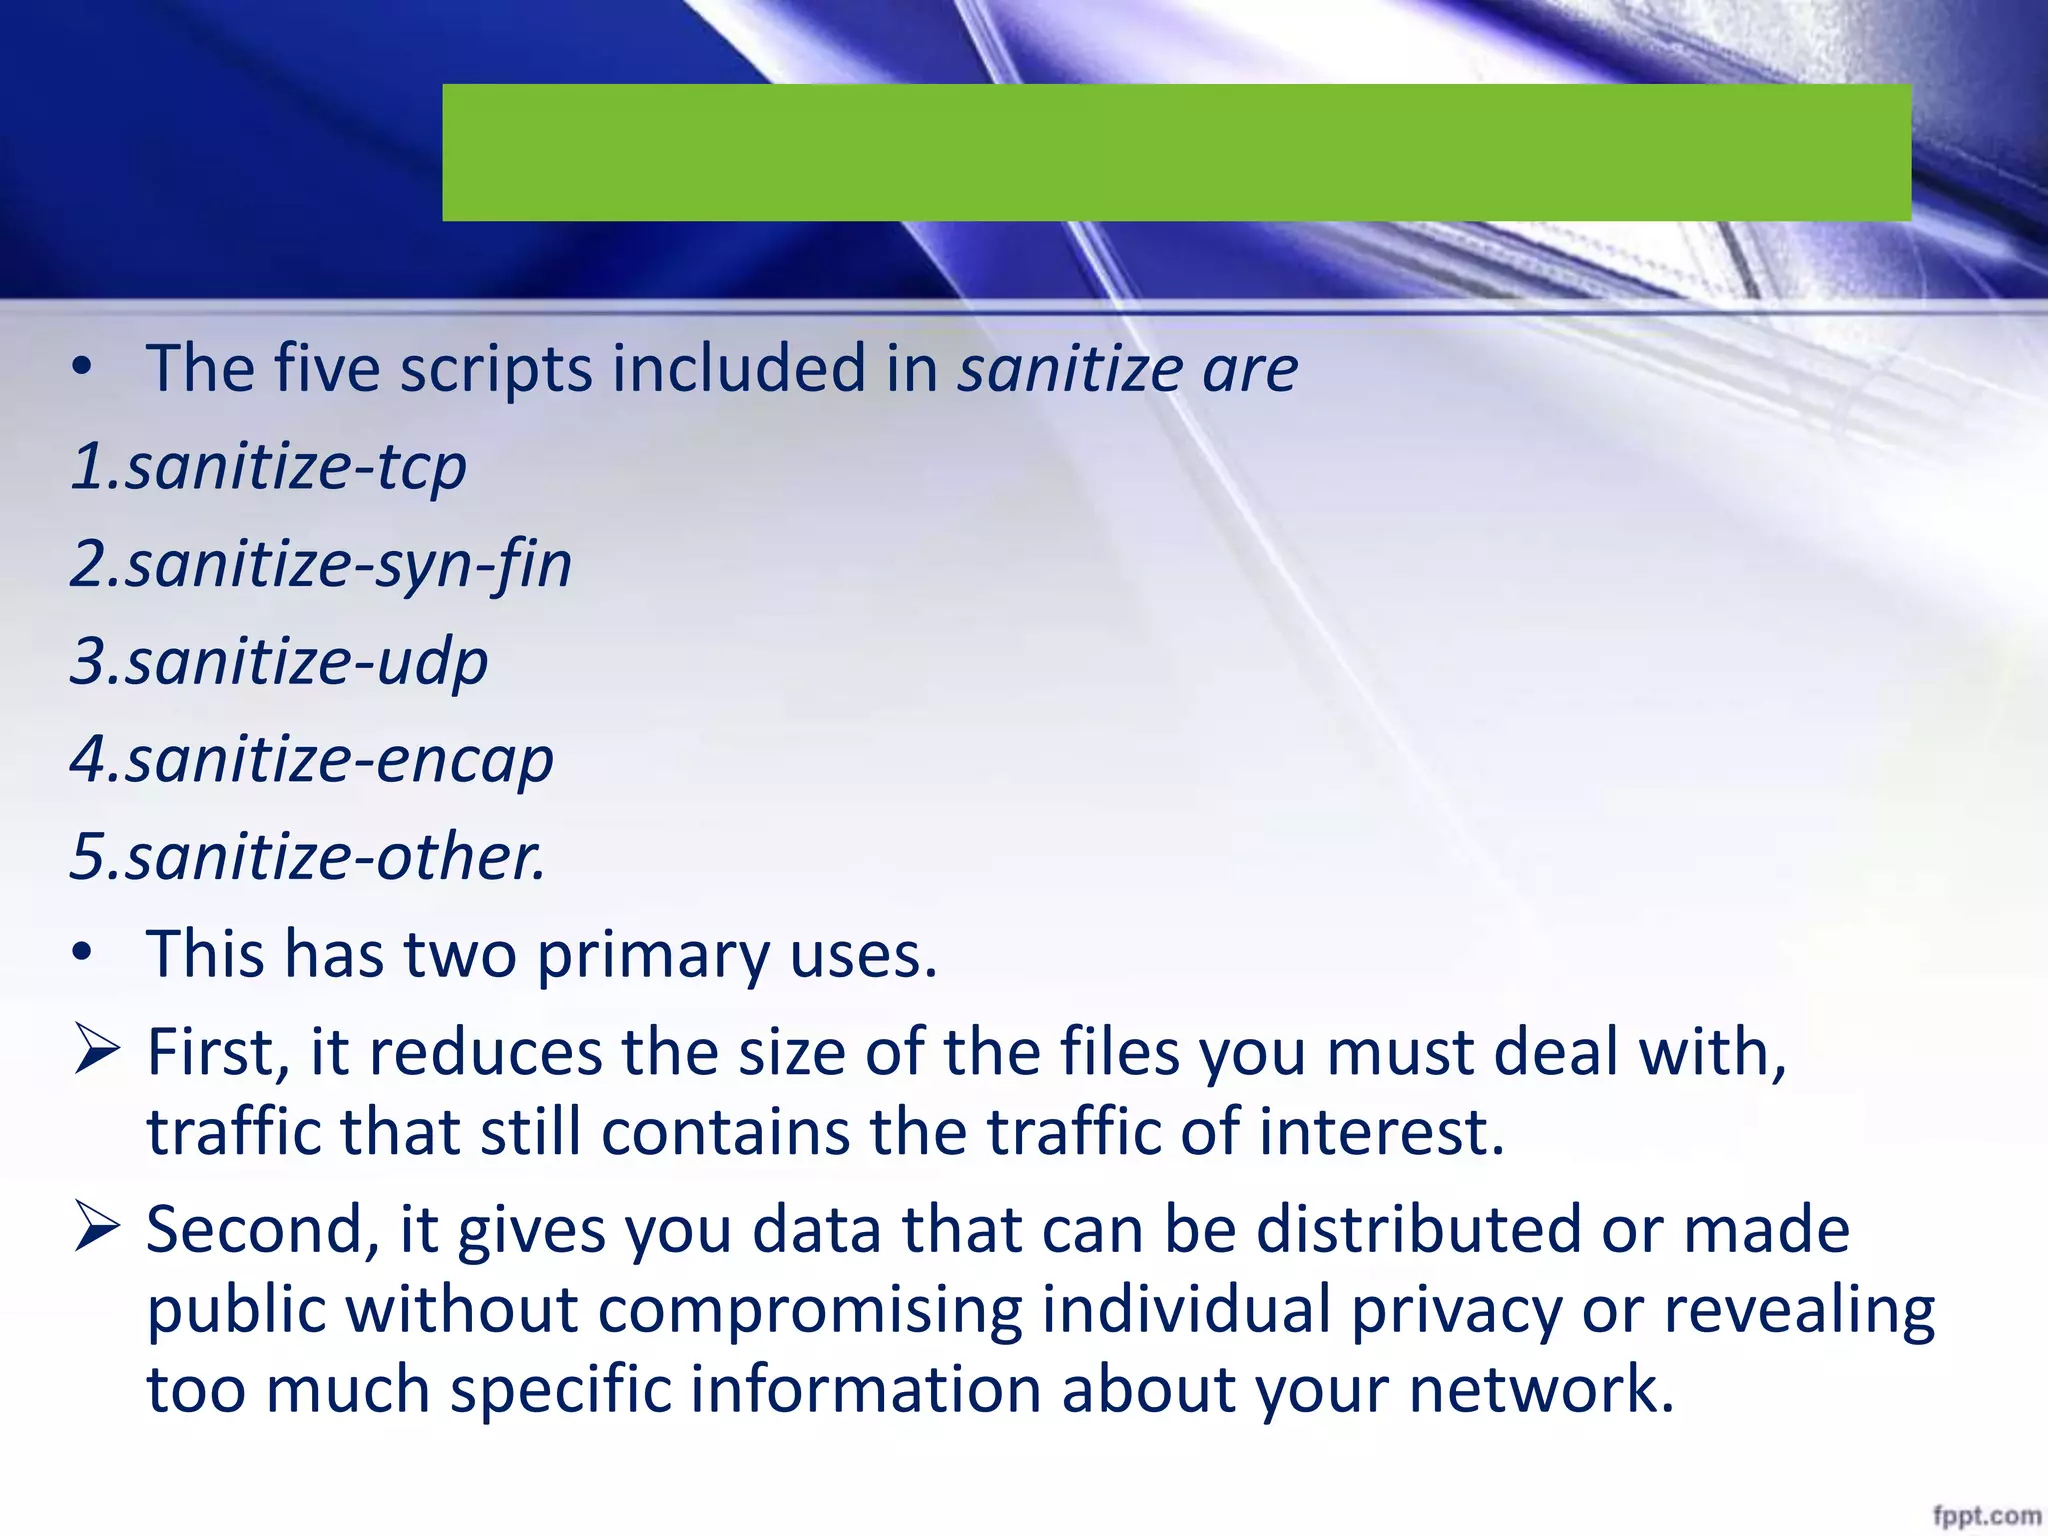
Discusses analysis tools used with tcpdump for sanitizing and reformatting data, including useful scripts for privacy.
Introduction to other packet capture programs, notably Sun's snoop, and their comparable functionalities to tcpdump.
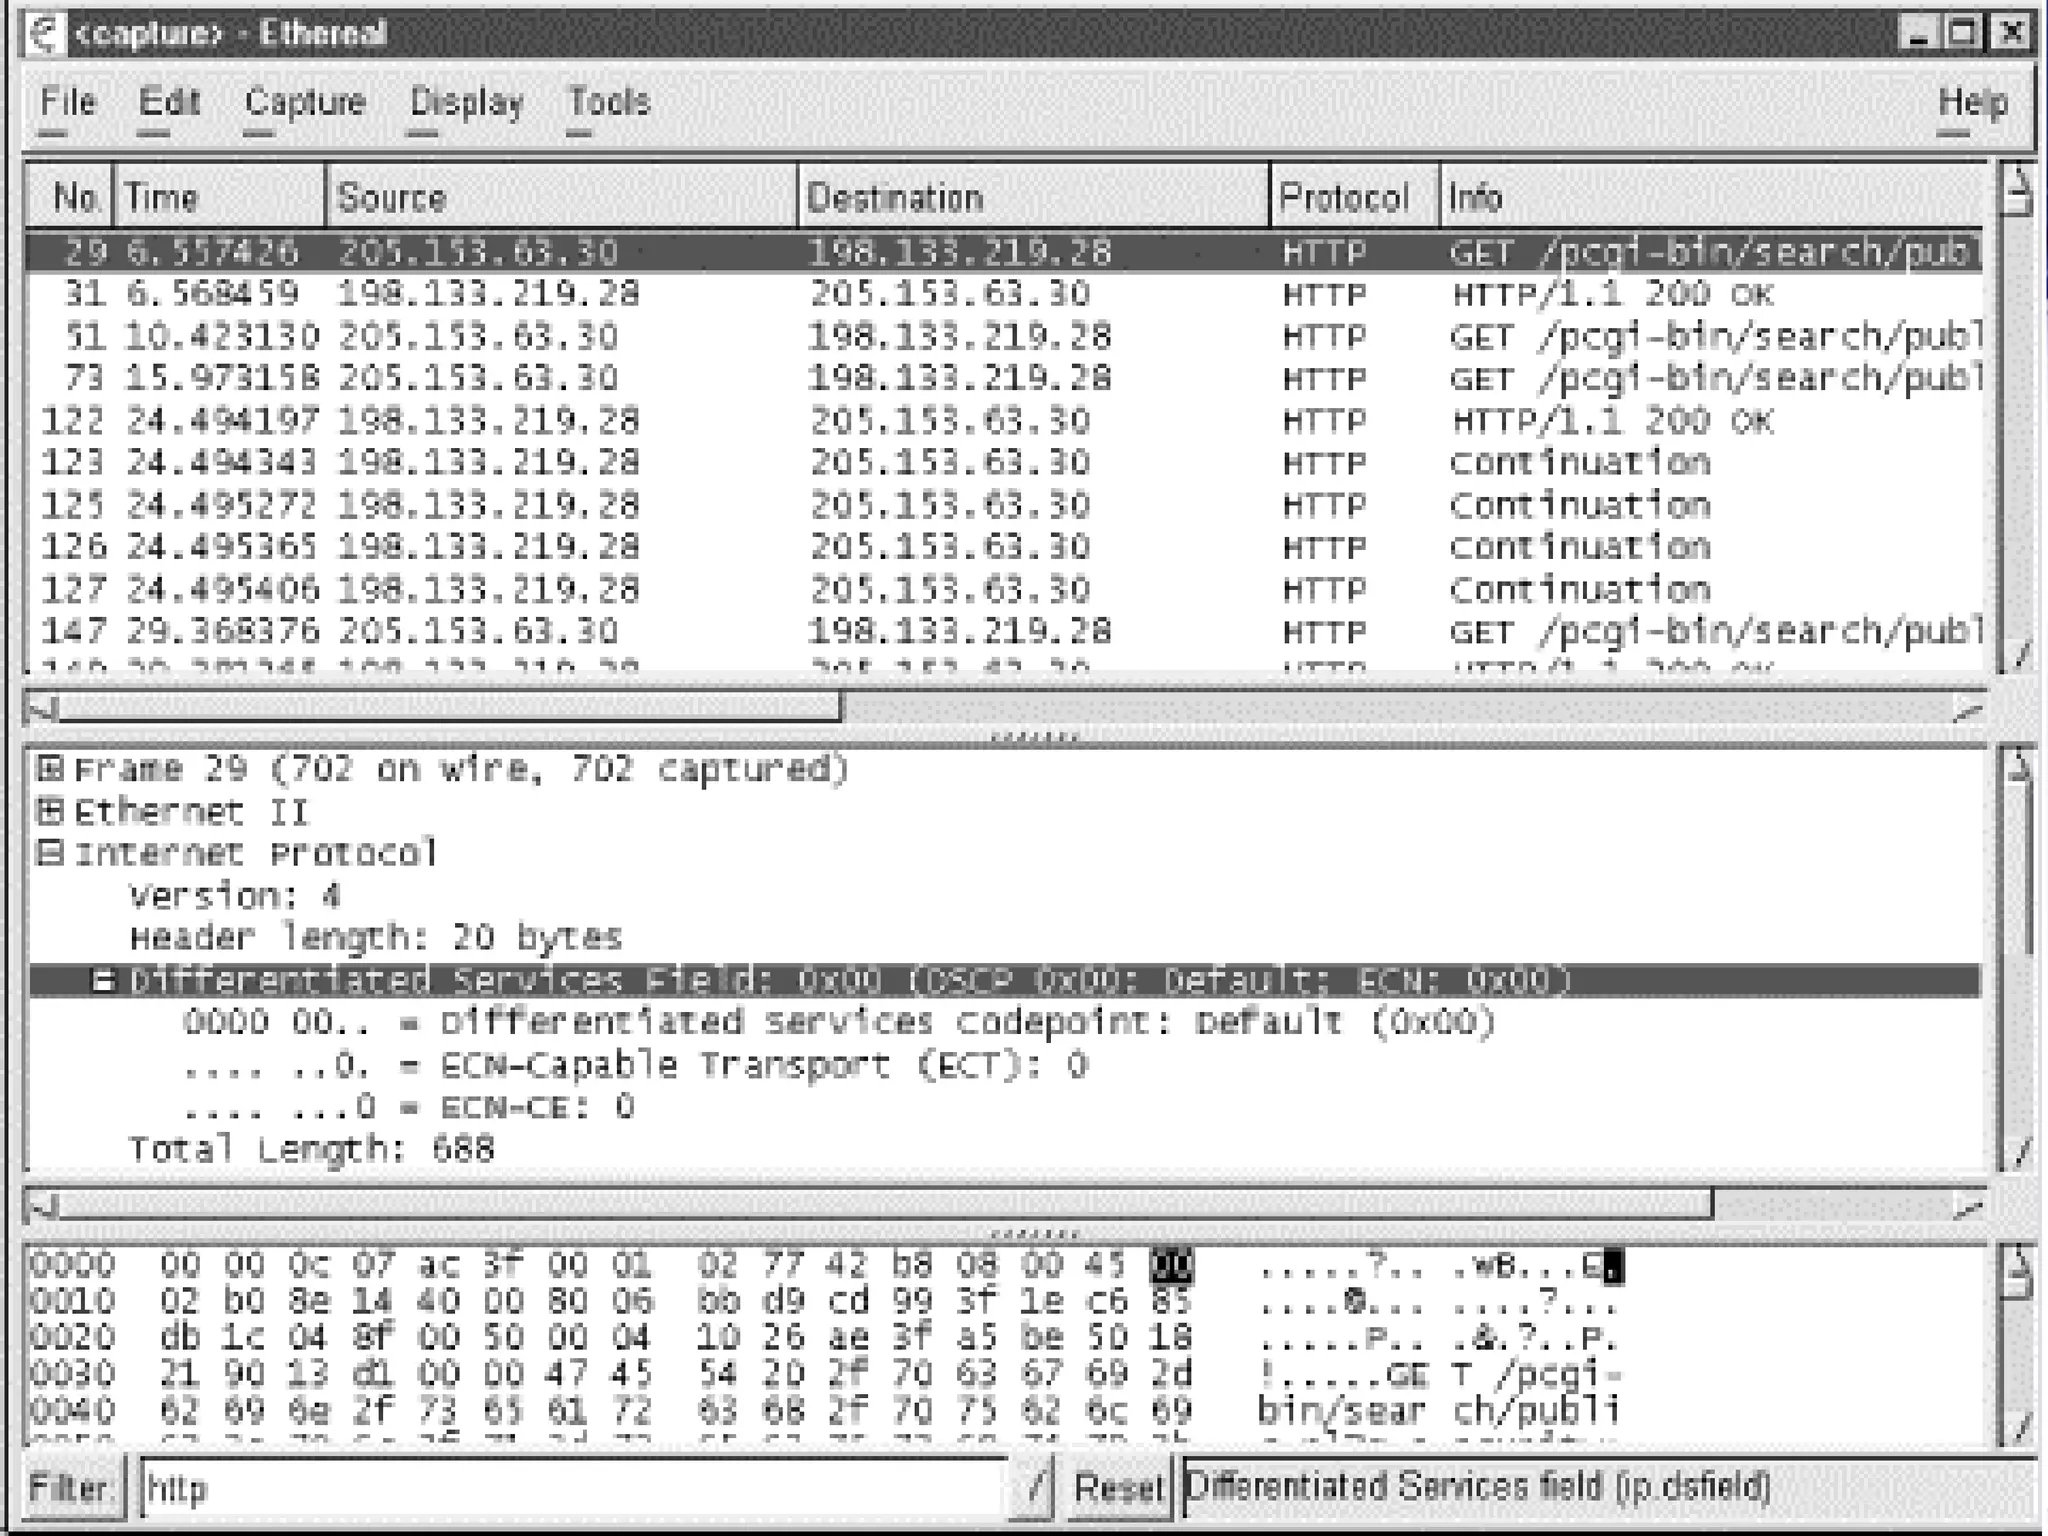
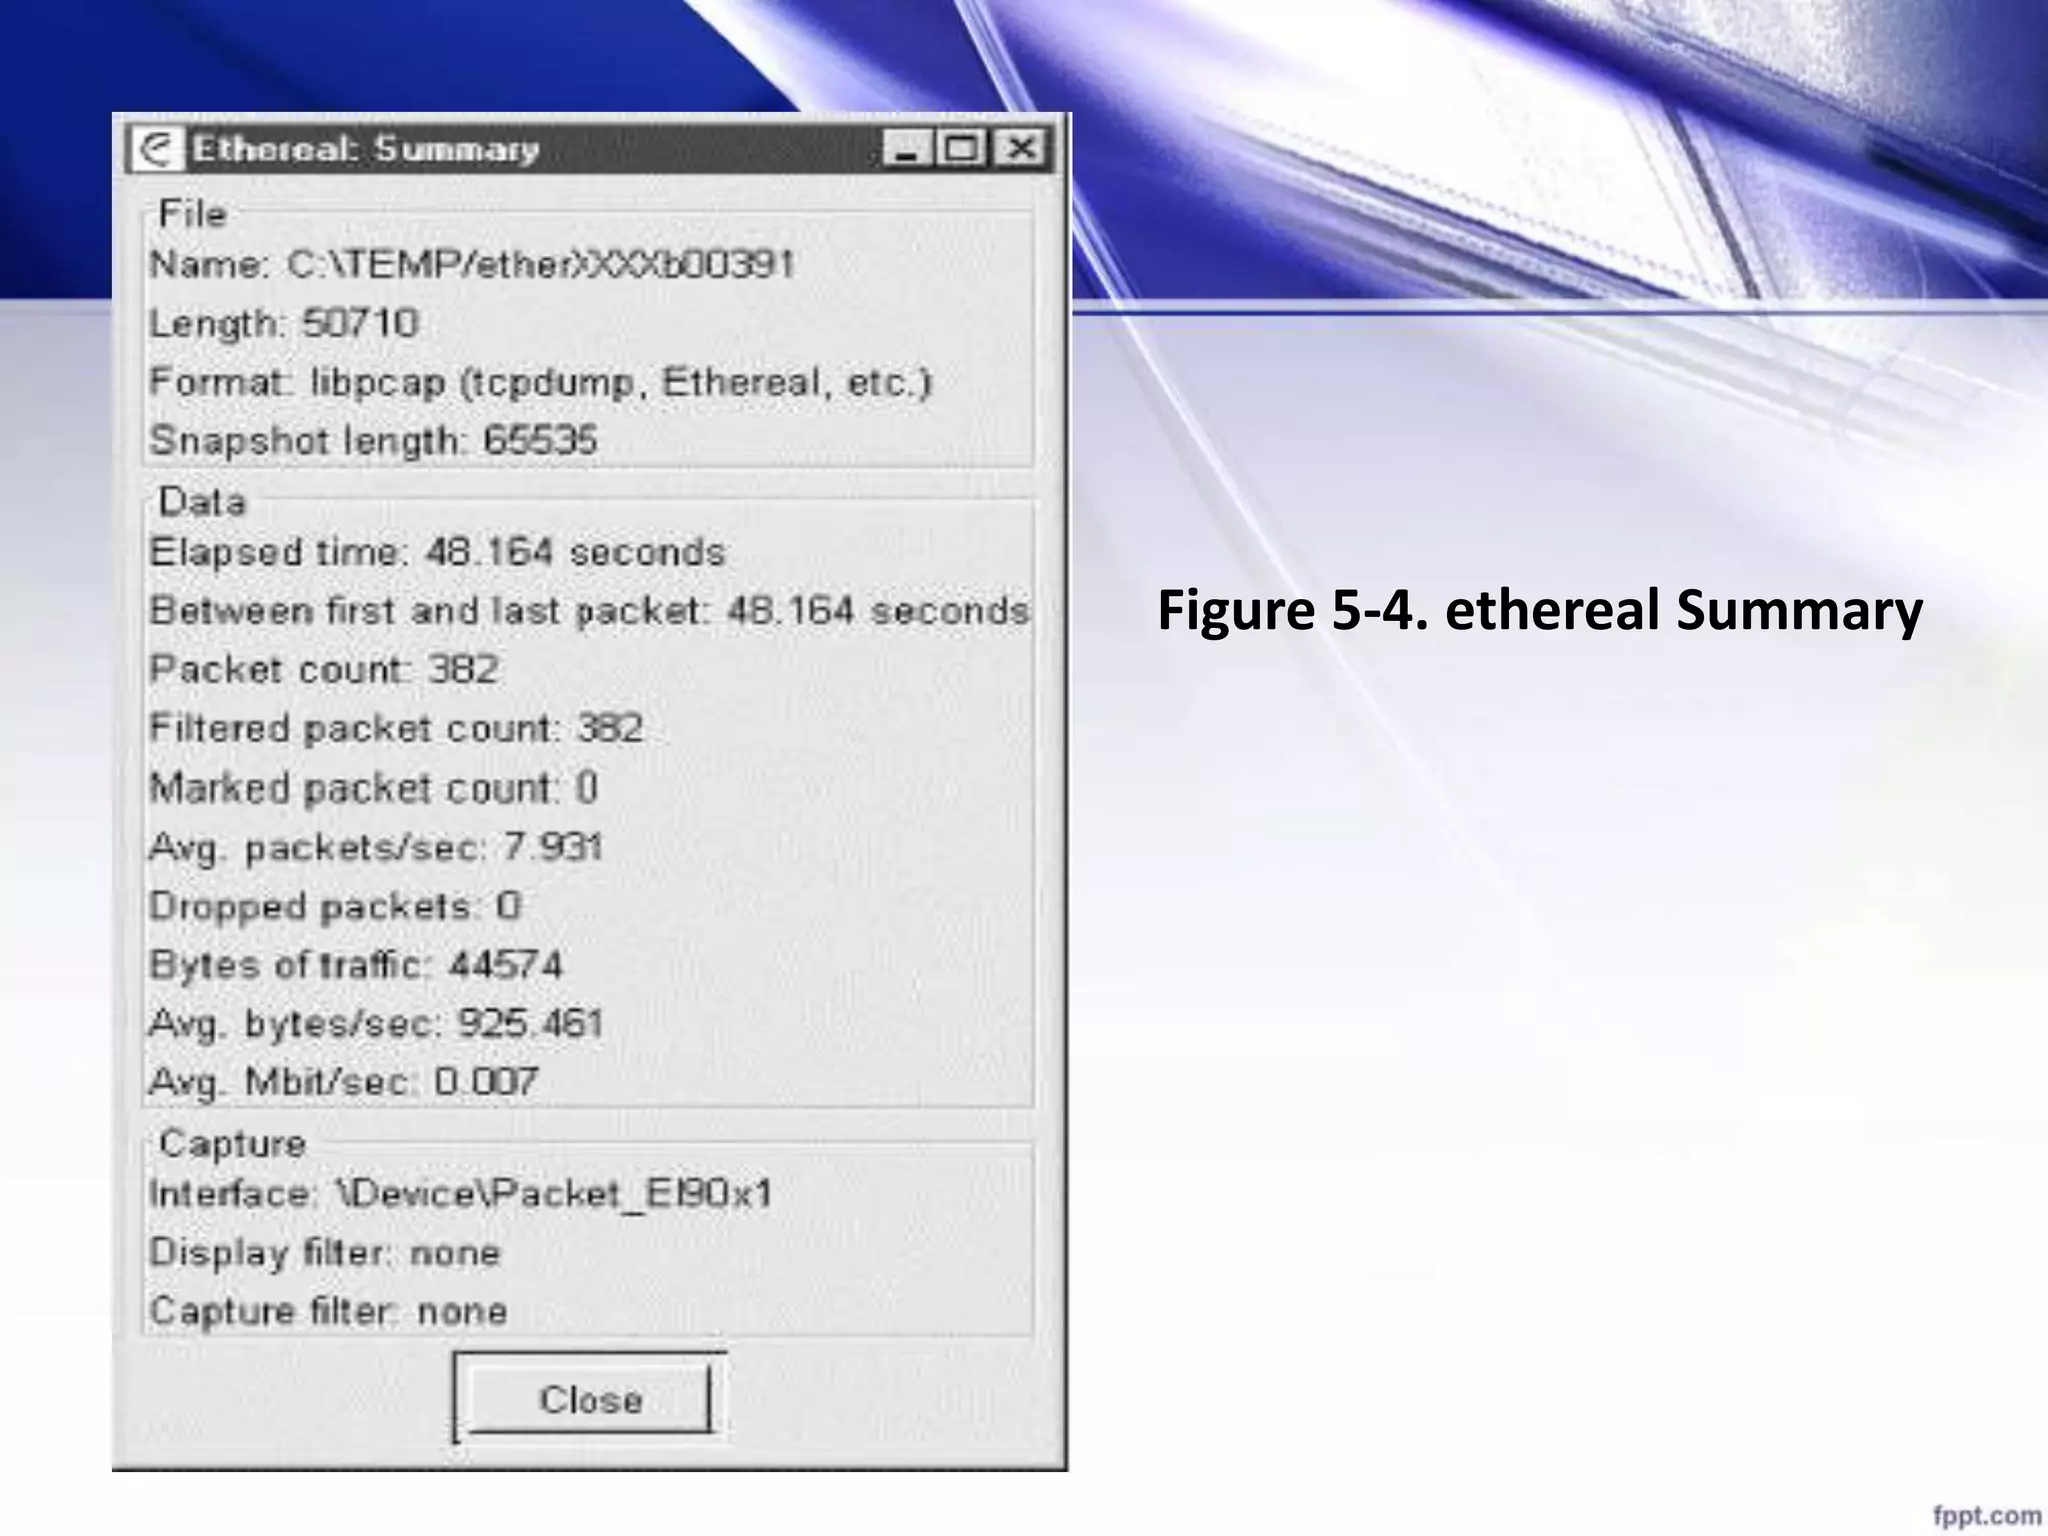
Overview of Ethereal as a packet analyzer, including its features and compatibility with tcpdump files.
How to use Ethereal for capturing data with various settings and options, including switching modes.
Details on managing and analyzing captured packets in Ethereal, including using display filters for detailed analysis.


![Number_Guessing_Game_Dsbsbssbzboc[1].pptx](https://cdn.slidesharecdn.com/ss_thumbnails/numberguessinggamedoc1-251206215042-a076fc05-thumbnail.jpg?width=640&height=640&fit=bounds)


