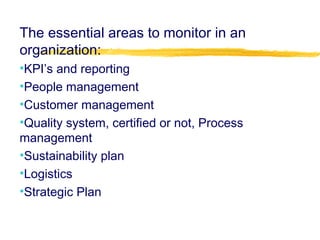
1) The document discusses concepts related to Total Quality Management including continuous improvement processes and principles. It provides examples of key performance indicators that can be used to measure quality in the health sector such as mortality rates, infection rates, and patient satisfaction.
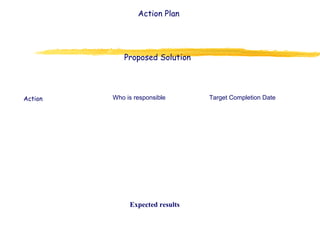
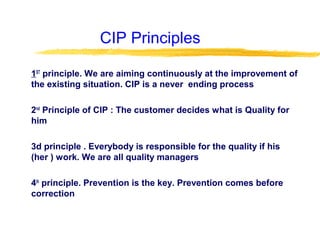
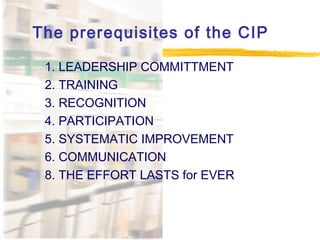
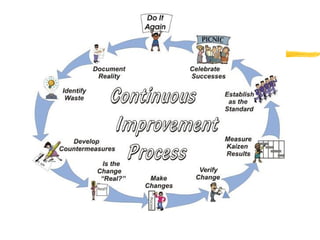
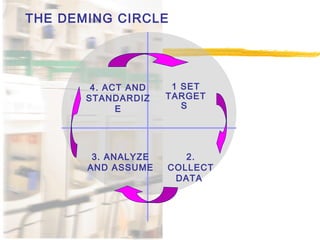
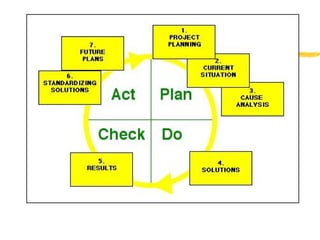
2) The continuous improvement process involves detecting issues, analyzing causes, finding solutions, and implementing corrections. Principles of the process include teamwork, prevention over correction, and commitment to improvement.
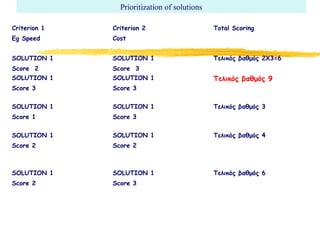
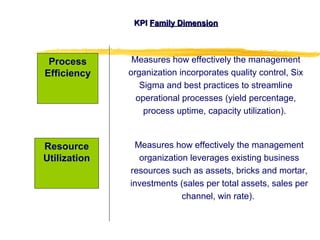
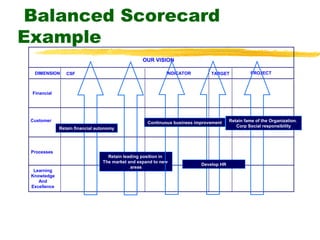
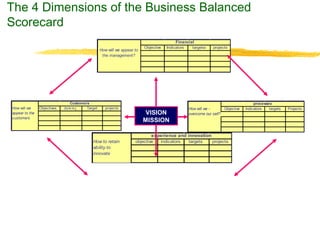
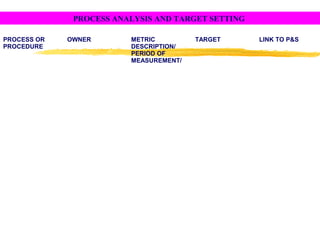
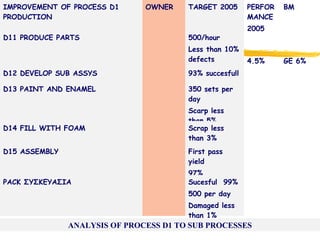
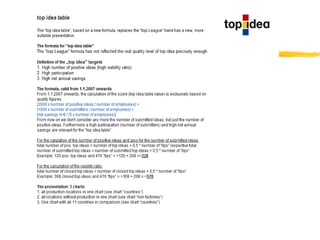
3) Effective performance management requires establishing key performance indicators, measuring and monitoring performance, and using results to reward employees and improve processes. Setting the right KPIs is important for effective management.


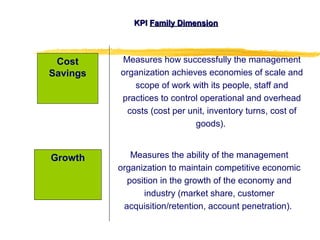
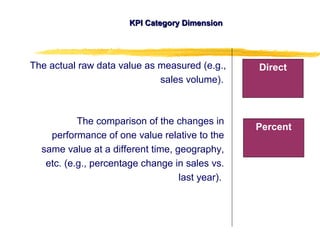


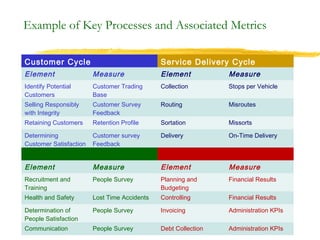


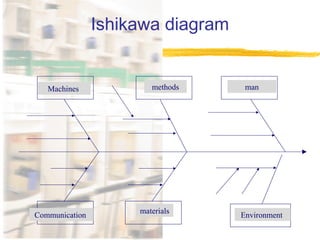
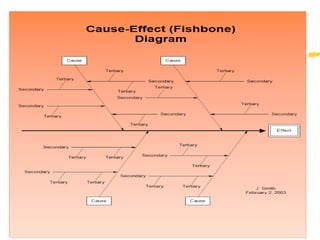
![7 main categories of causes :
(Machines)
(Method)
(Material)
(Management)
[Men (People )]
[Milleau(Environment)]
(Measurement)
(Cause & Effect Diagram -Fishbone)](https://image.slidesharecdn.com/total-quality-management-160907142341/85/Total-quality-management-96-320.jpg)