Downloaded 369 times
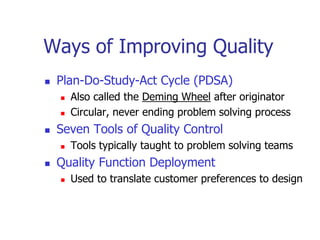
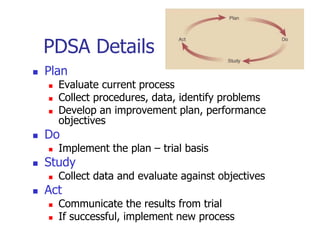
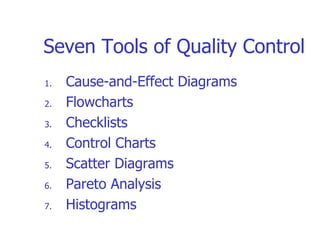
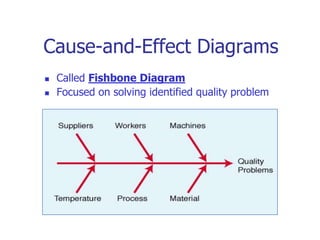
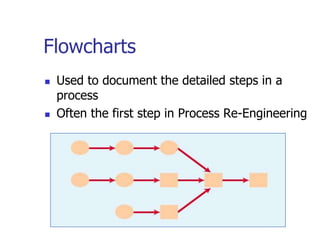
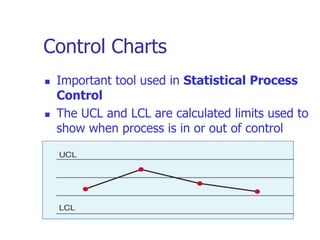
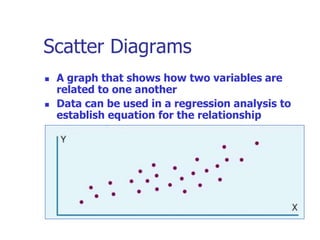
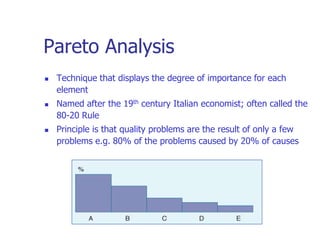
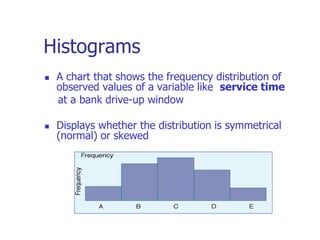
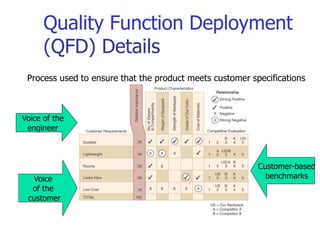
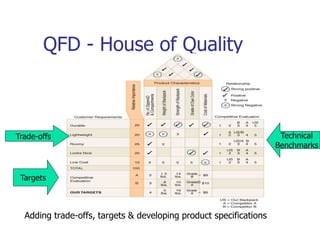
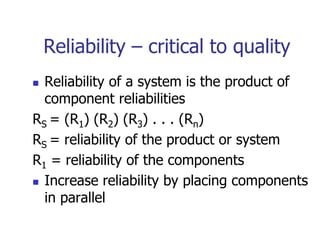
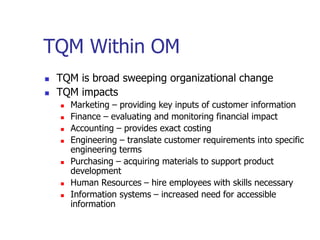
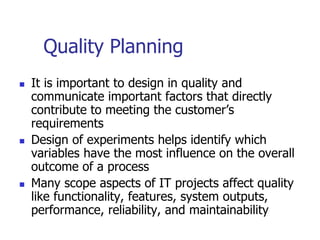
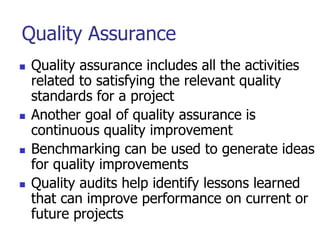
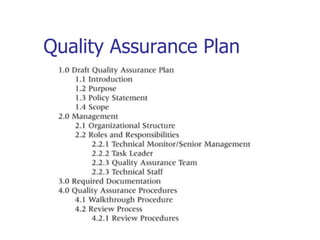
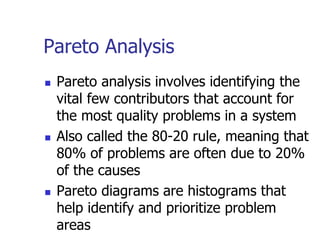
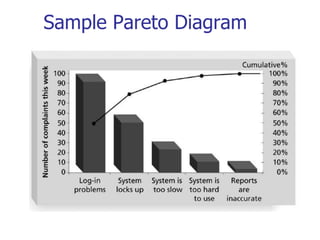
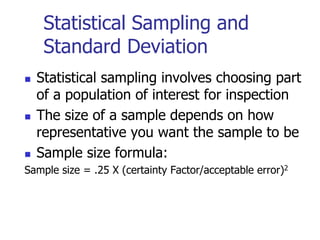
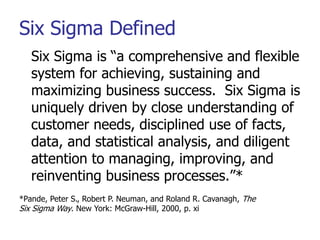
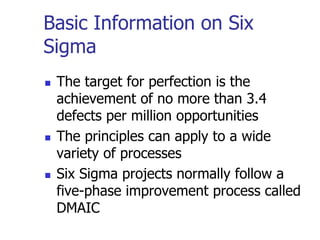
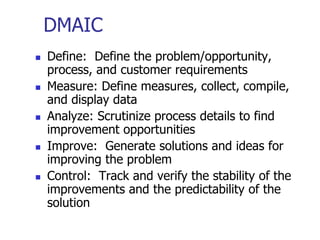
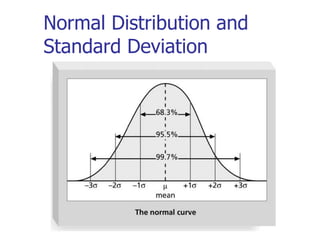
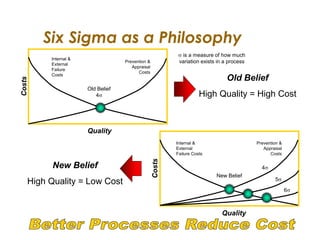
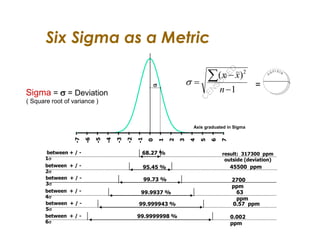
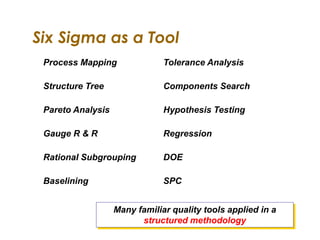
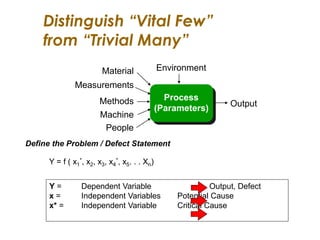
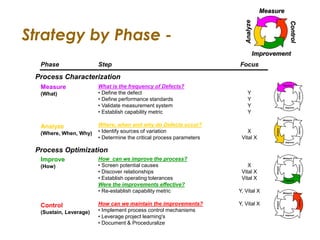
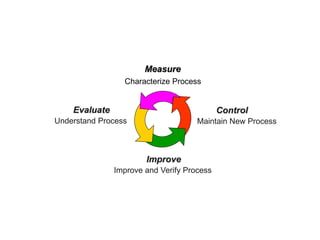
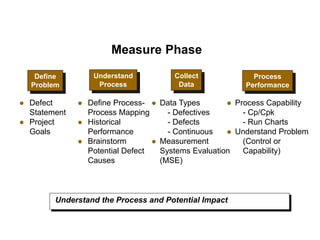
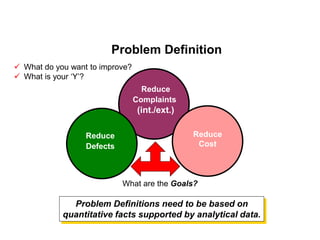
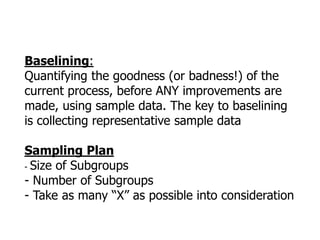
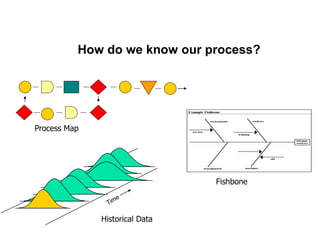
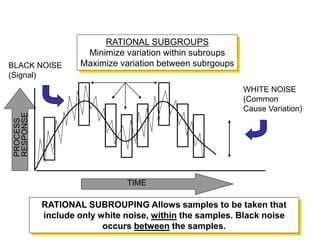
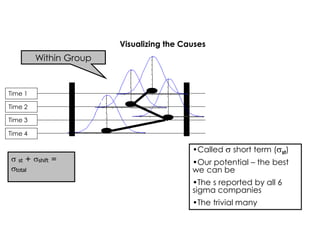
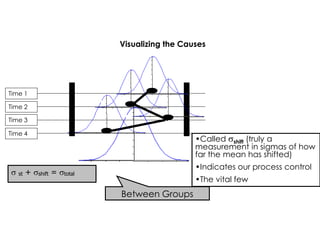
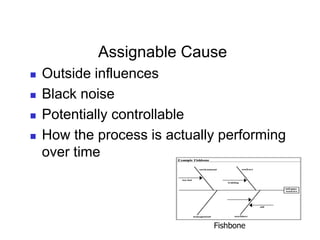
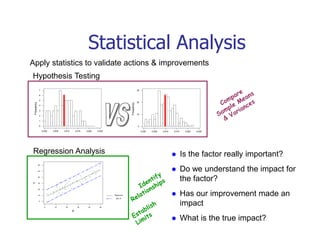
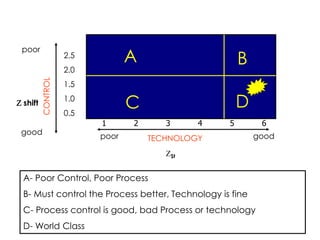
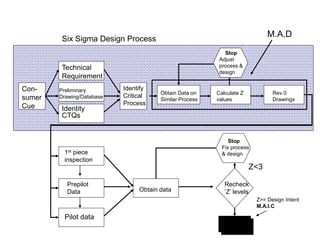
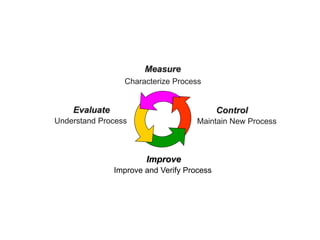
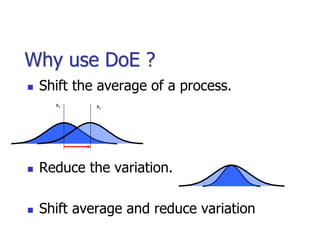

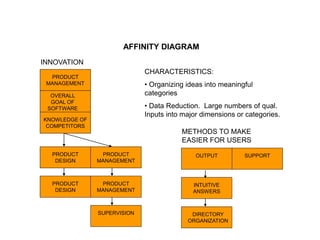
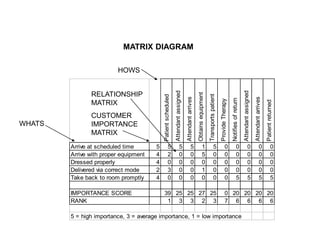
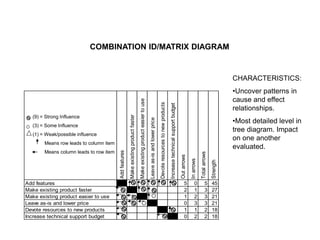
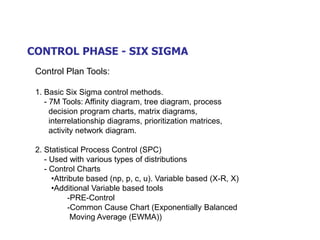
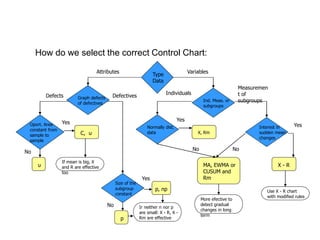
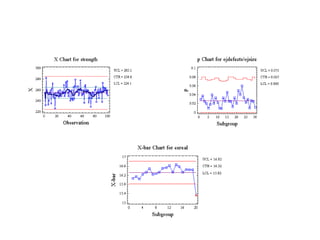
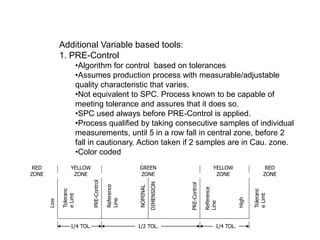
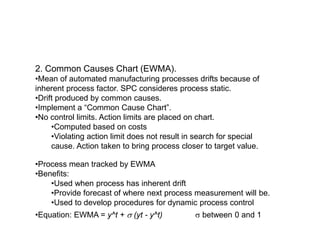


The document discusses quality management and planning. It describes the Plan-Do-Study-Act cycle for continuous improvement. The seven tools of quality control are explained, including cause-and-effect diagrams, flowcharts, control charts, scatter diagrams, Pareto analysis, and histograms. Quality Function Deployment is discussed as a tool to translate customer requirements into technical specifications. The concepts of reliability, process management, ISO standards, and reasons for TQM failures are summarized. Statistical sampling, standard deviation, Six Sigma methodology, and how Six Sigma differs from traditional quality control approaches are briefly outlined.


![74676371-Coagulation-and-Flocculation[1].ppt](https://cdn.slidesharecdn.com/ss_thumbnails/74676371-coagulation-and-flocculation1-260116154109-a3cbf55e-thumbnail.jpg?width=640&height=640&fit=bounds)

