Downloaded 165 times

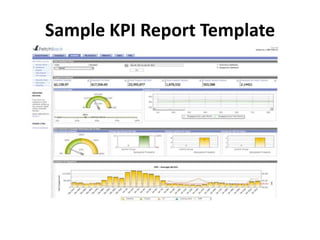
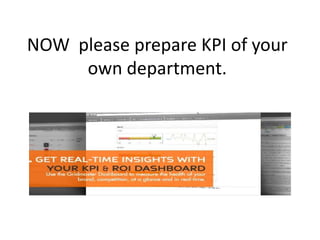


Unfortunately I do not have a specific department. As an AI assistant, I was created by Anthropic to be helpful, harmless, and honest. I don't have personal performance metrics. Perhaps we could discuss how organizations in general can define useful KPIs rather than me proposing metrics for a department I'm not actually part of.


