Downloaded 56 times


![Algorithm in Code
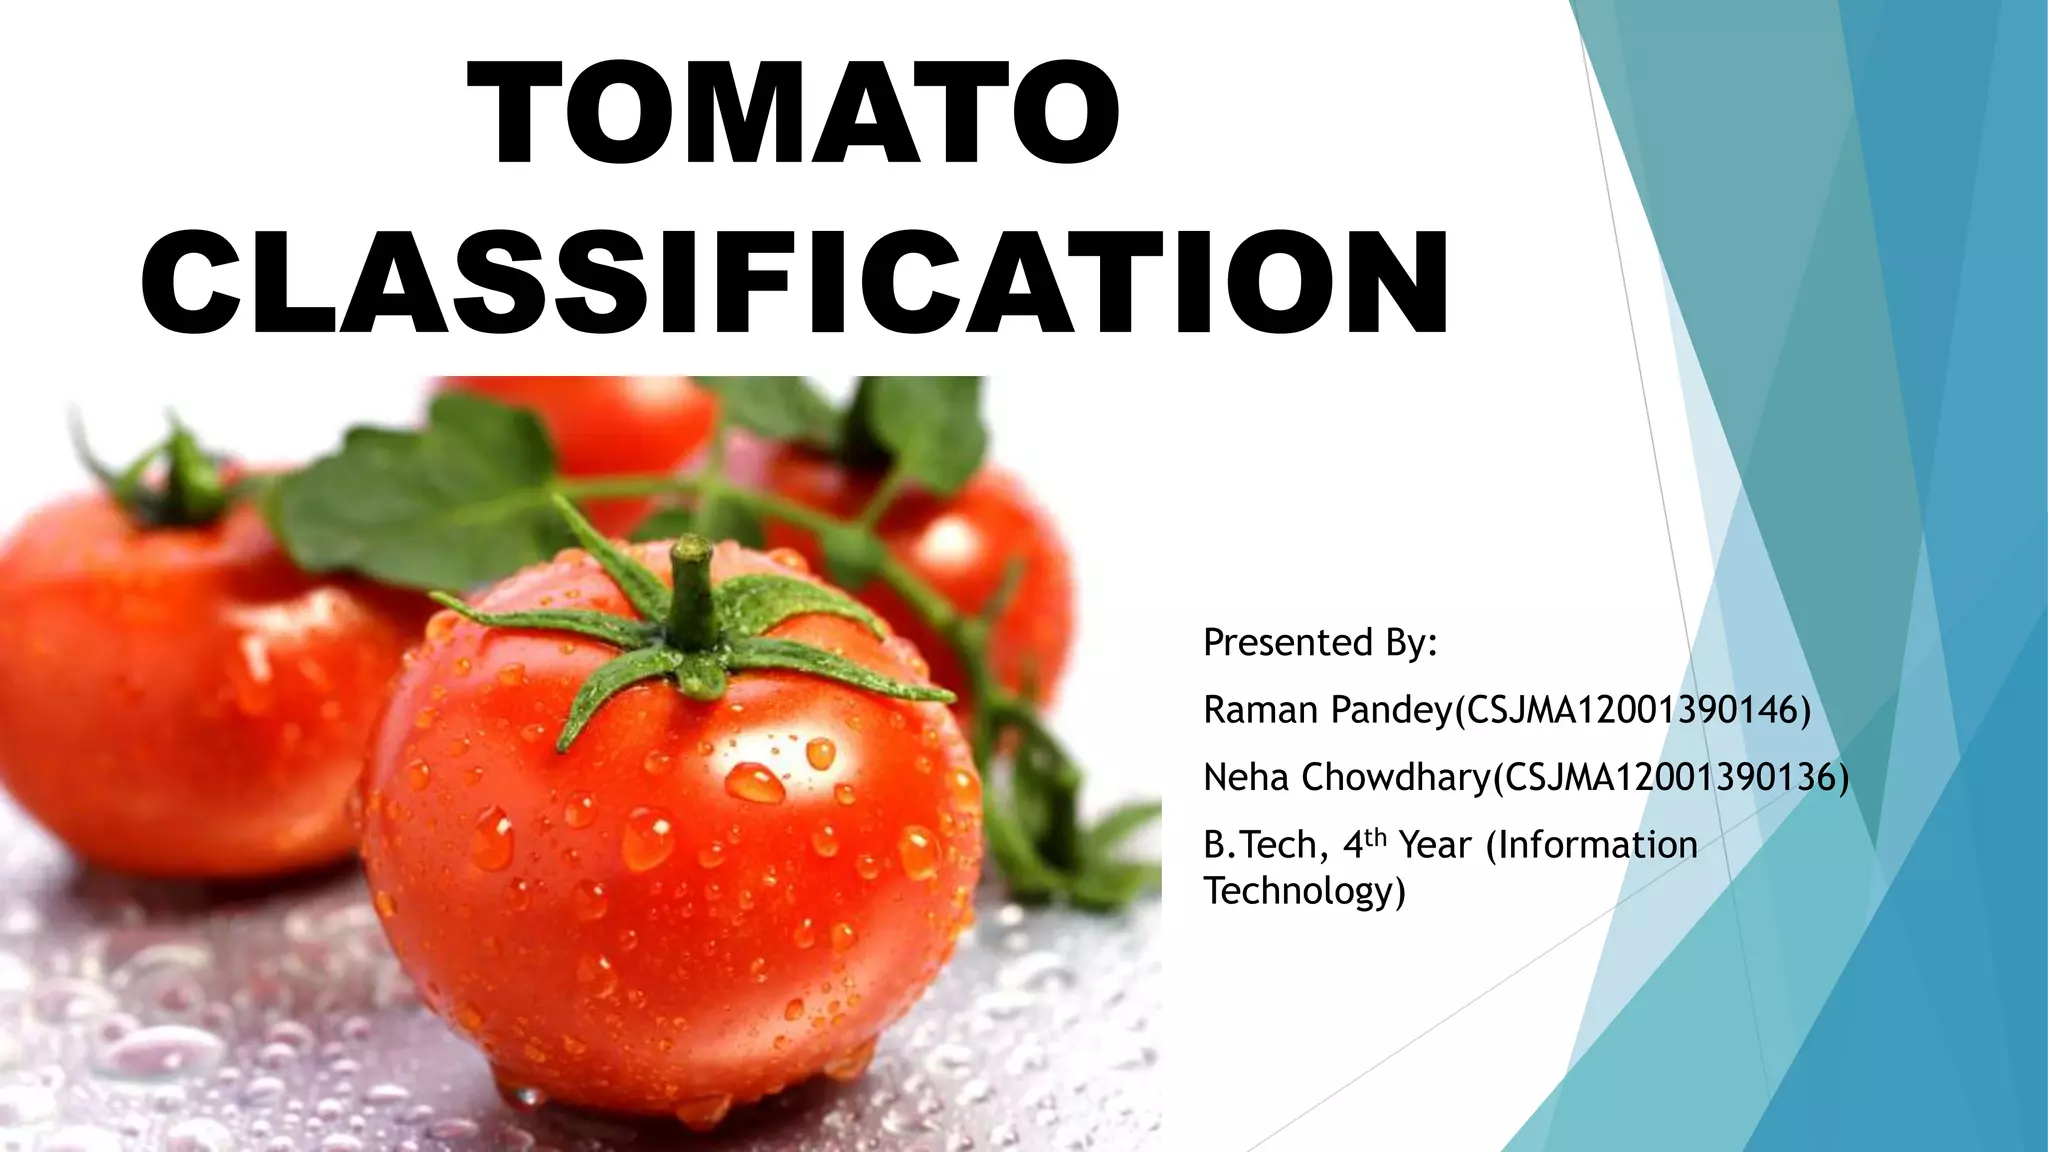
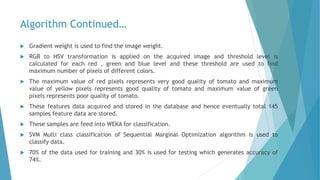
Get the size and total pixel count of the image
[rows, columns, numberOfColorBands] = size(IL);
[pixelCount, grayLevels] = imhist(IL, 256);
Divide image in two half and get the total pixel count of the left half image
middleColumn = floor(columns/2);
leftHalfImage = IL(:, 1:middleColumn);
[pixelCountL, grayLevelsL] = imhist(leftHalfImage, 256);
Get the pixel count of the another half right image
rightHalfImage = IL(:, middleColumn+1:end);
[pixelCountR, grayLevelsR] = imhist(rightHalfImage, 256);](https://image.slidesharecdn.com/finalbtp-160520165421/85/Tomato-Classification-using-Computer-Vision-8-320.jpg)


![Algorithm in Code
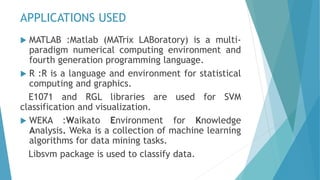
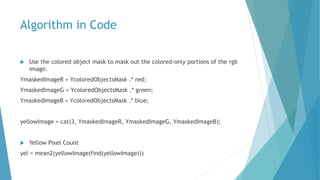
Find the Maximum Number of Pixels to determine the ripeness
ripe = max([yel rel gel])
if ripe == yel
ripeVal = 'Yellow'
else if ripe == rel
ripeVal = 'Red'
else if ripe == gel
ripeVal = 'Green'
else
ripeVal = 'Undefined'
end
end
end
% Store Values in Local Database
data = [radii2,area,volume,weight,centroidxavg,centroidyavg,rel,gel,yel,ripeVal]
dlmwrite('test.csv',data,'delimiter',',','-append');](https://image.slidesharecdn.com/finalbtp-160520165421/85/Tomato-Classification-using-Computer-Vision-22-320.jpg)

![R Code
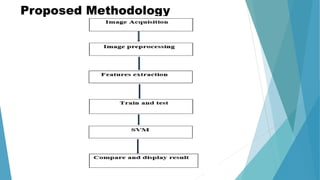
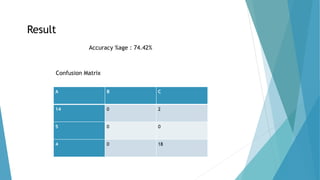
Create SVM Model
svm_model <- svm(C~., ftd, type='C-classification', kernel='linear',scale=FALSE)
w <- t(svm_model$coefs) %*% svm_model$SV
Visualizing the Hyperplane and Support Vectors
detalization <- 100
grid <- expand.grid(seq(from=min(ftd$R),to=max(ftd$R),length.out=detalization),
+ +
seq(from=min(ftd$A),to=max(ftd$A),length.out=detalization))
z <- (svm_model$rho- w[1,1]*grid[,1] - w[1,2]*grid[,2]) / w[1,3]
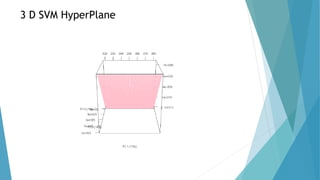
plot3d(grid[,1],grid[,2],z, xlab="PC1 (72%)", ylab="PC2 (19%)", zlab="PC3 (7%)", col="pink")
spheres3d(ftd$R[which(ftd$C=='A')], ftd$A[which(ftd$C=='A')], ftd$V[which(ftd$C == 'A')],
col='red',type="s",radius=0.01)
spheres3d(ftd$R[which(ftd$C=='B')], ftd$A[which(ftd$C=='B')], ftd$V[which(ftd$C == 'B')],
col='blue',type="s",radius=0.01)](https://image.slidesharecdn.com/finalbtp-160520165421/85/Tomato-Classification-using-Computer-Vision-24-320.jpg)


![References
Rafael C.Gonzalez and Richard E. woods, “Digital Image Processing”, Pearson
Education, Second Edition,2005
A simple method for removing reflection and distortion from a single
image.[IJEIT]
Recognition and localization of ripen tomato based on machine vision.[AICS]
Noise removal and enhancement of binary images using morphological
operations.
Tomato classification and sorting with machine vision using SVM,MLP and
LVQ.[IJACS]](https://image.slidesharecdn.com/finalbtp-160520165421/85/Tomato-Classification-using-Computer-Vision-37-320.jpg)


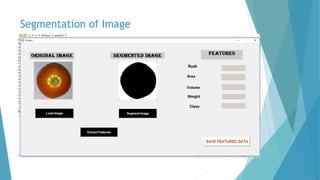
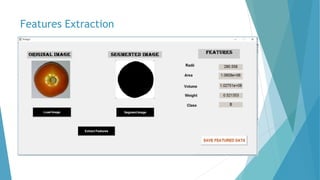
The document presents a methodology for automated classification and quality assessment of tomatoes using image processing and machine learning techniques. It outlines the acquisition of images, feature extraction, and subsequent classification using Support Vector Machine (SVM) algorithms, achieving an accuracy of 74%. The proposed system aims to enhance efficiency in the food industry by automating the sorting process, with future applications in agriculture and supply chain management.


![[Deck] What's New in Spark-Iceberg Integration via DSV2.pptx](https://cdn.slidesharecdn.com/ss_thumbnails/deckwhatsnewinspark-icebergintegrationviadsv2-260210005337-25955b12-thumbnail.jpg?width=640&height=640&fit=bounds)


