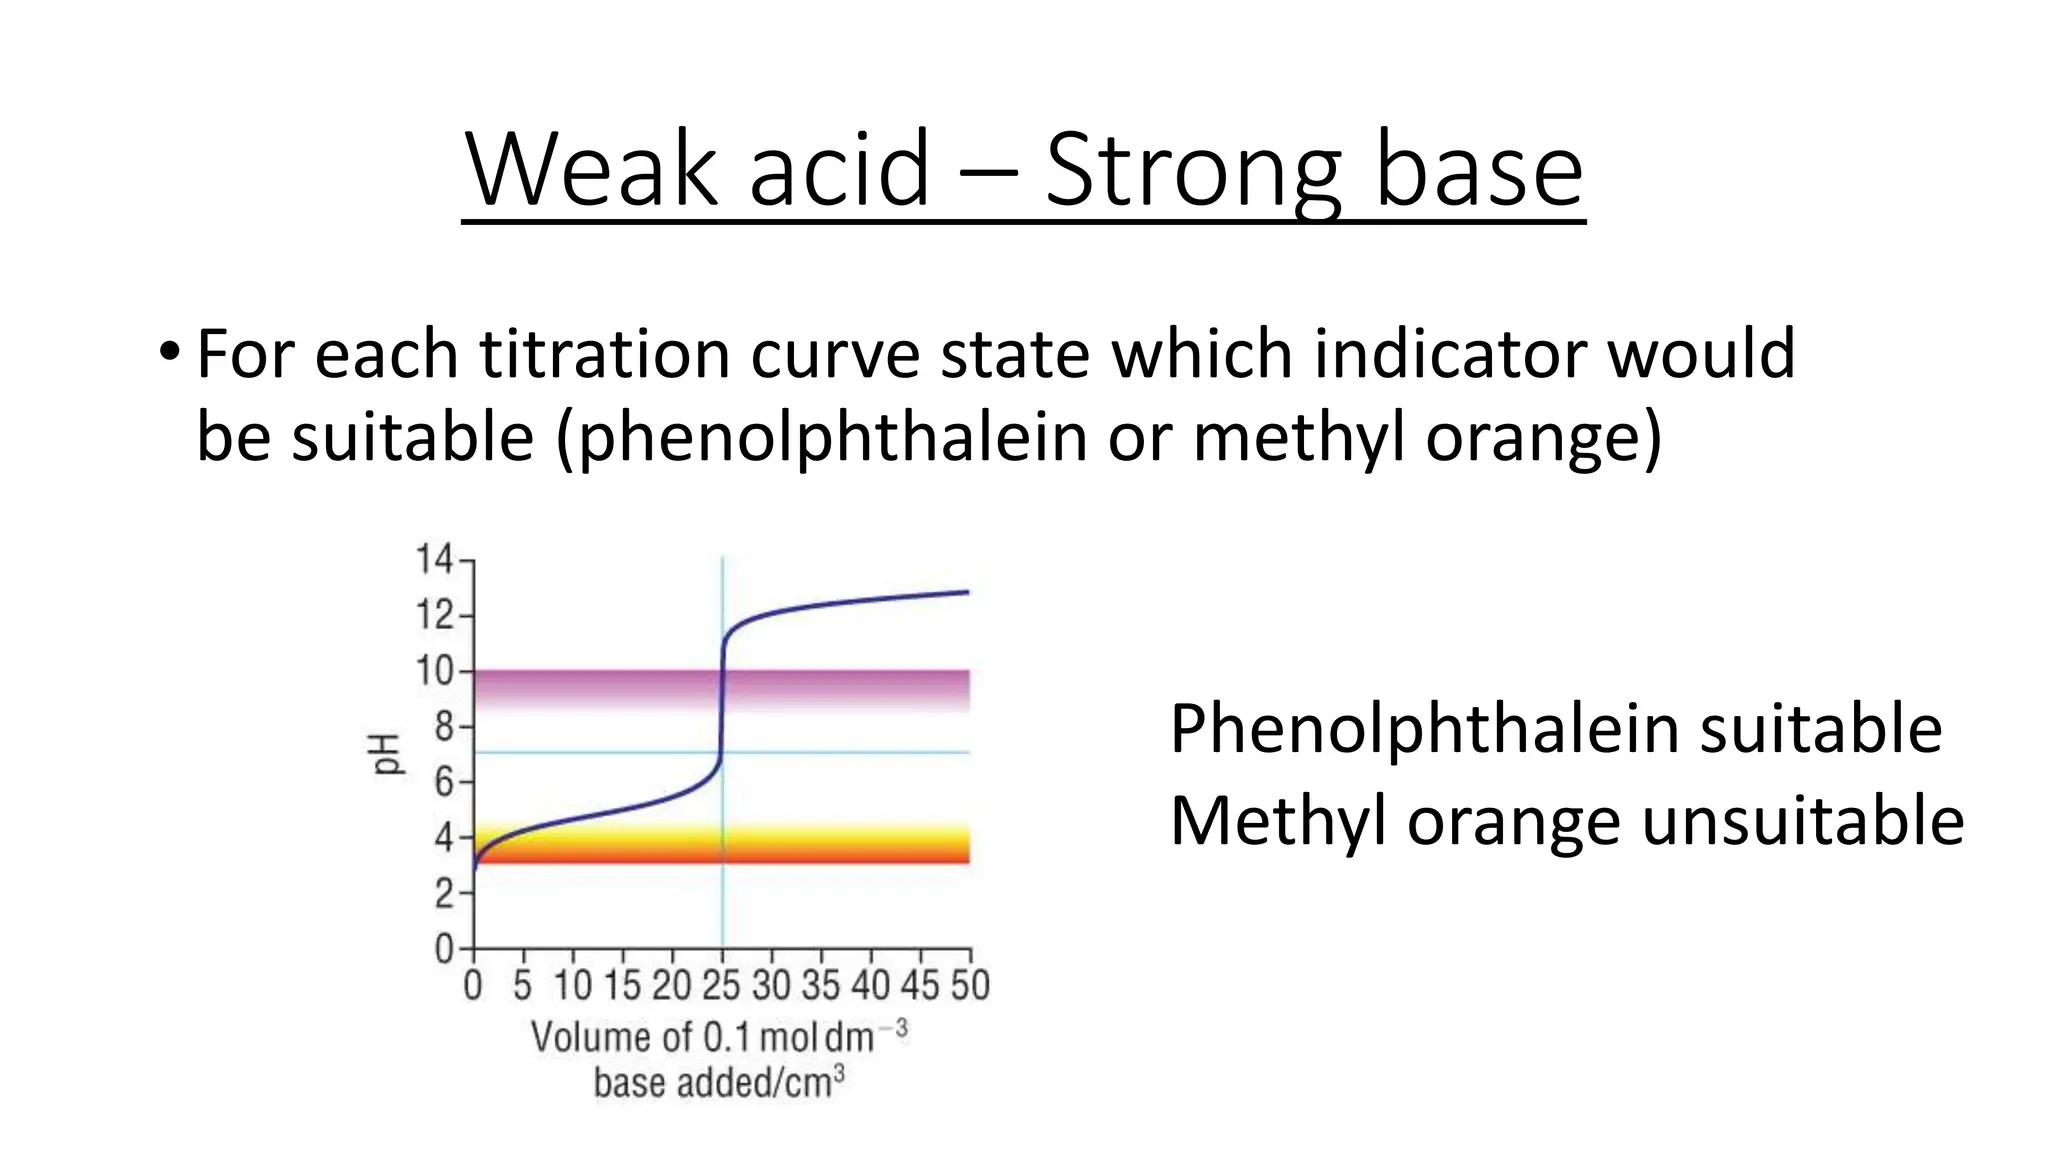
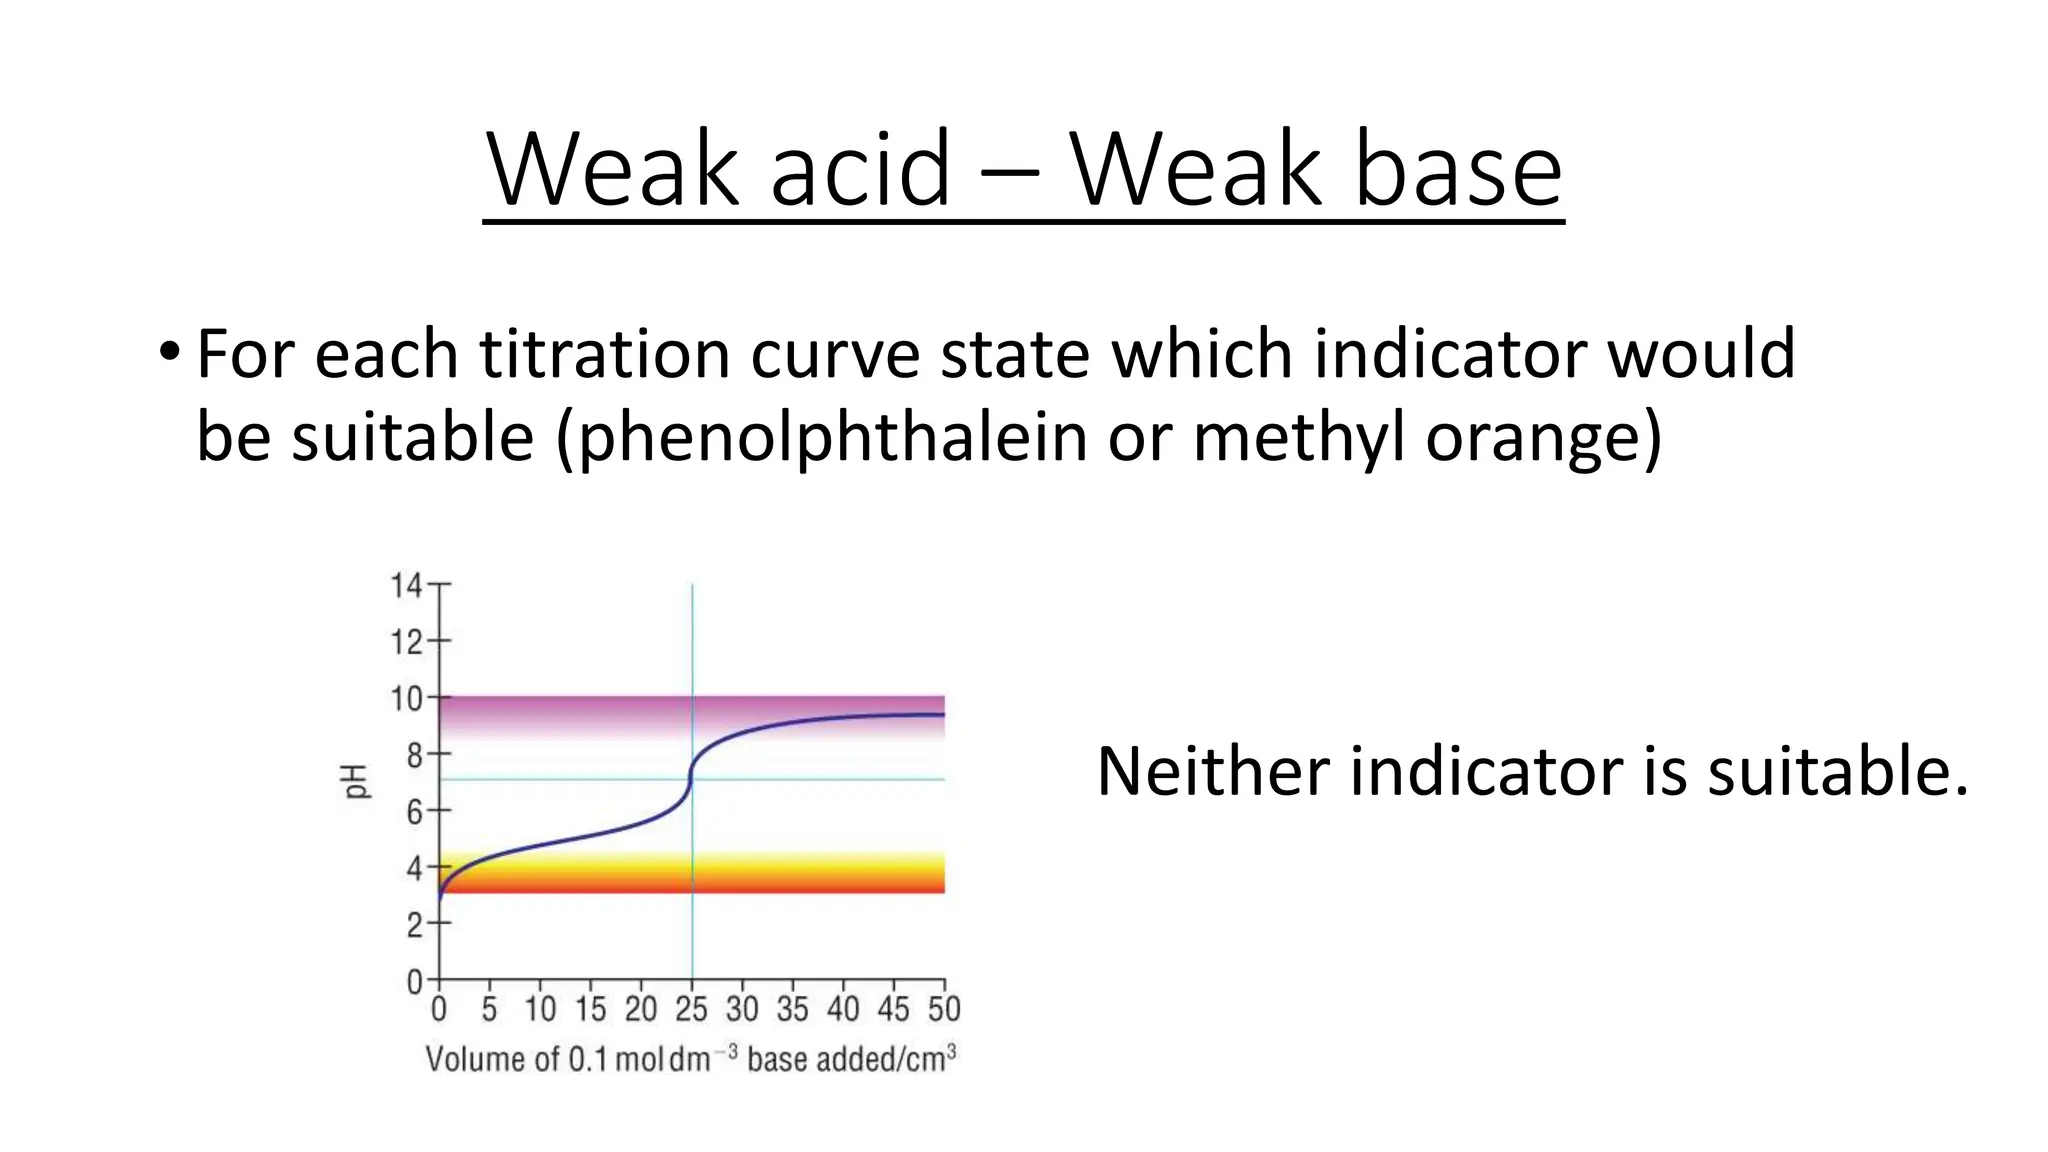
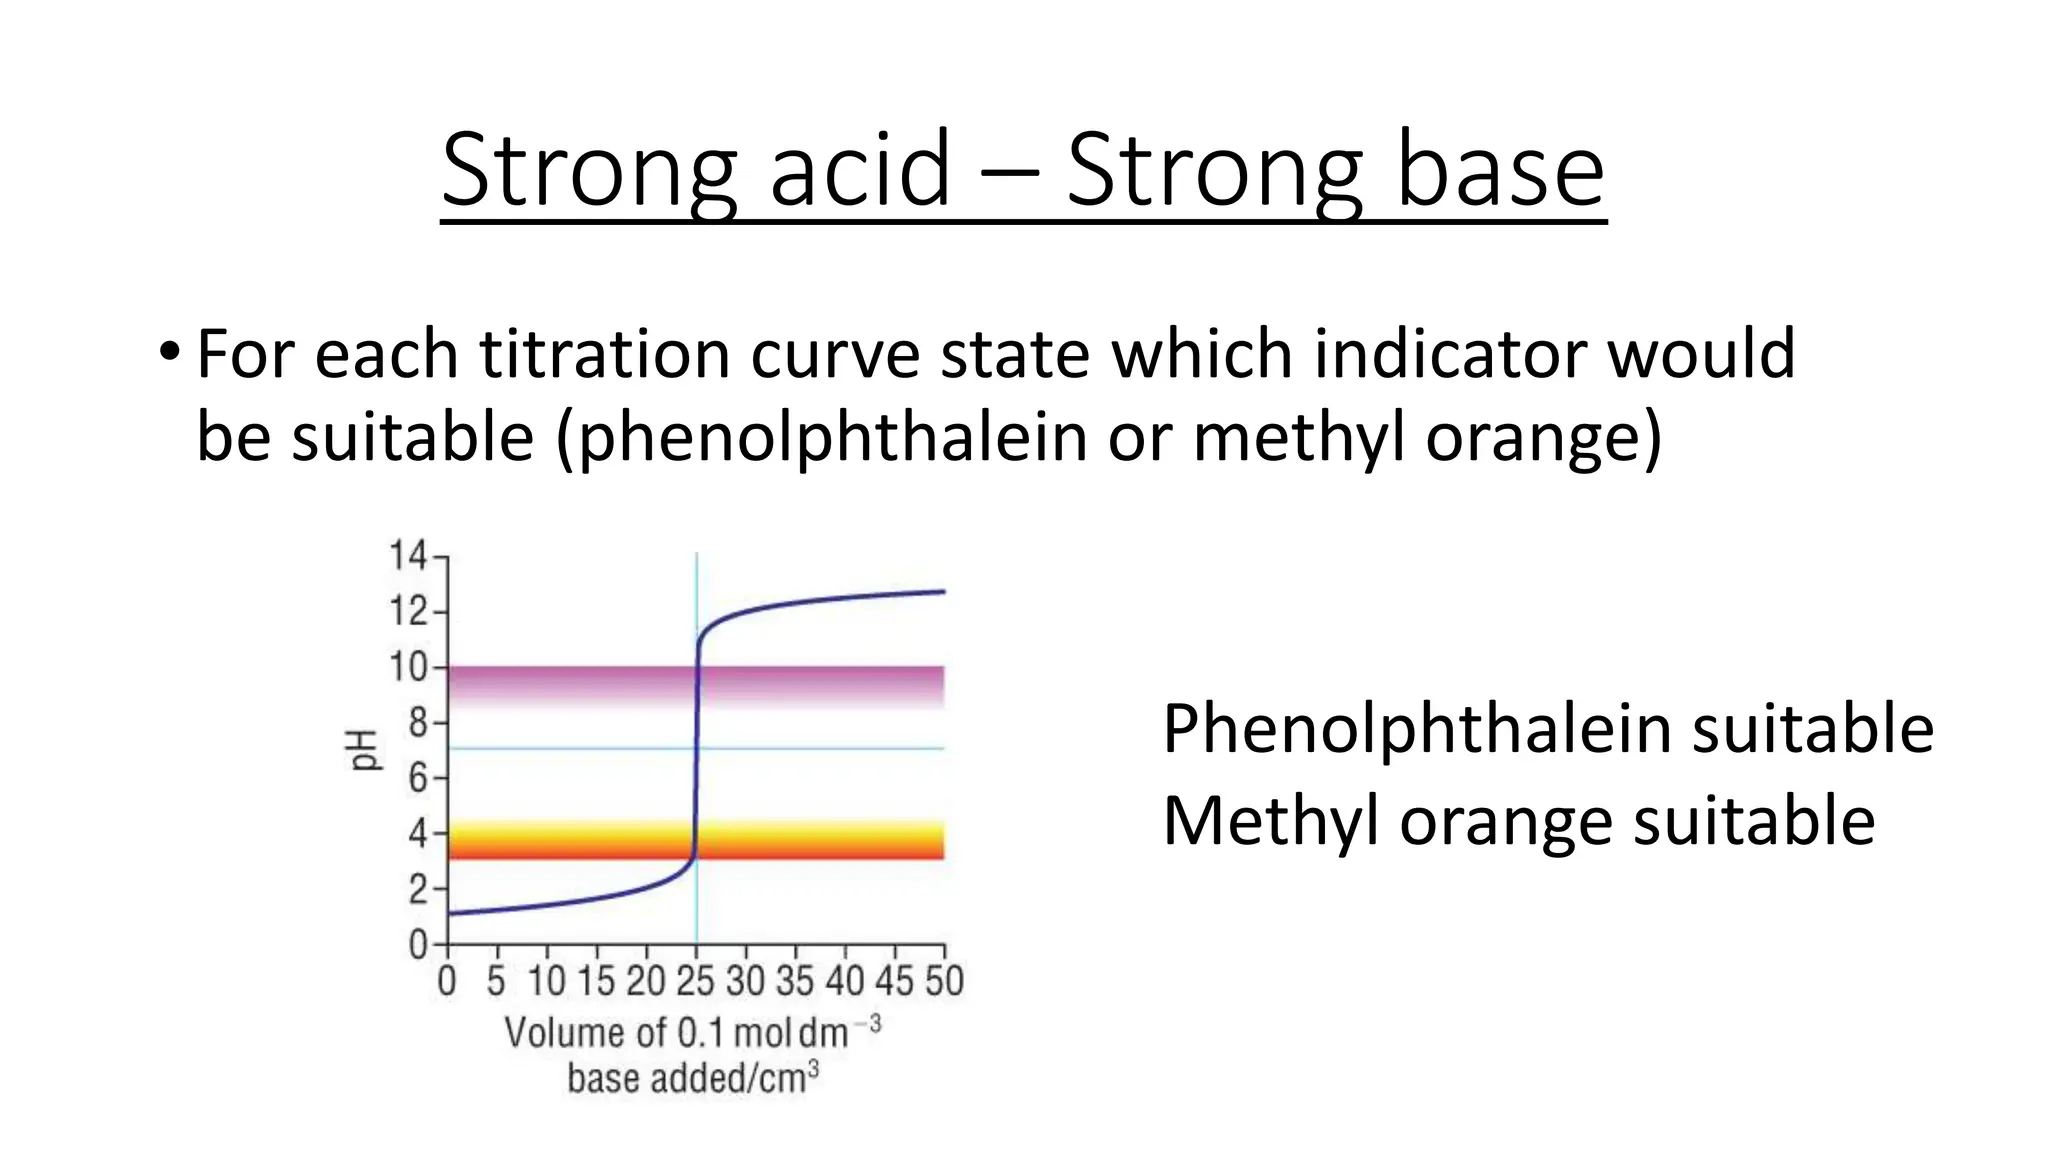
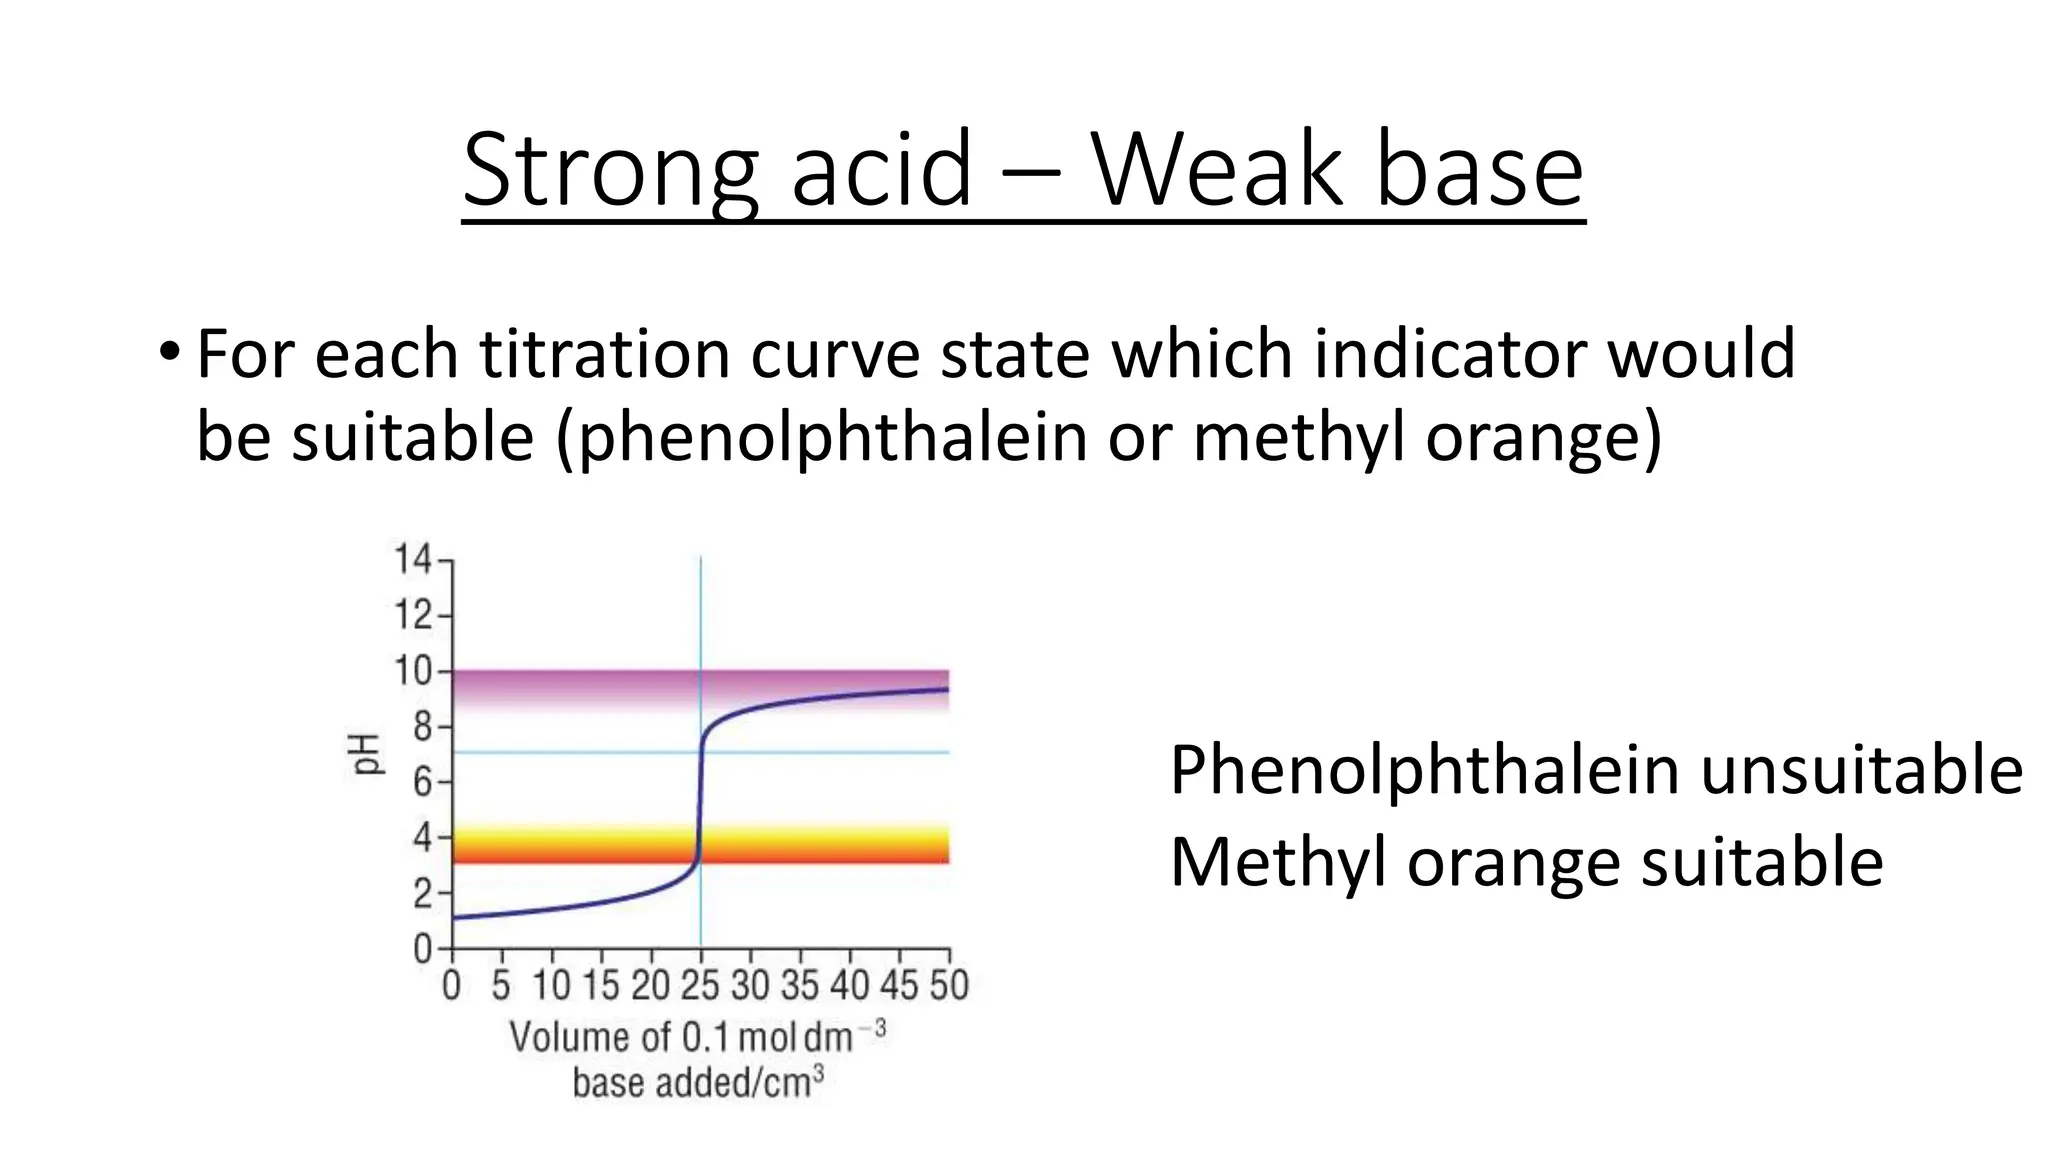
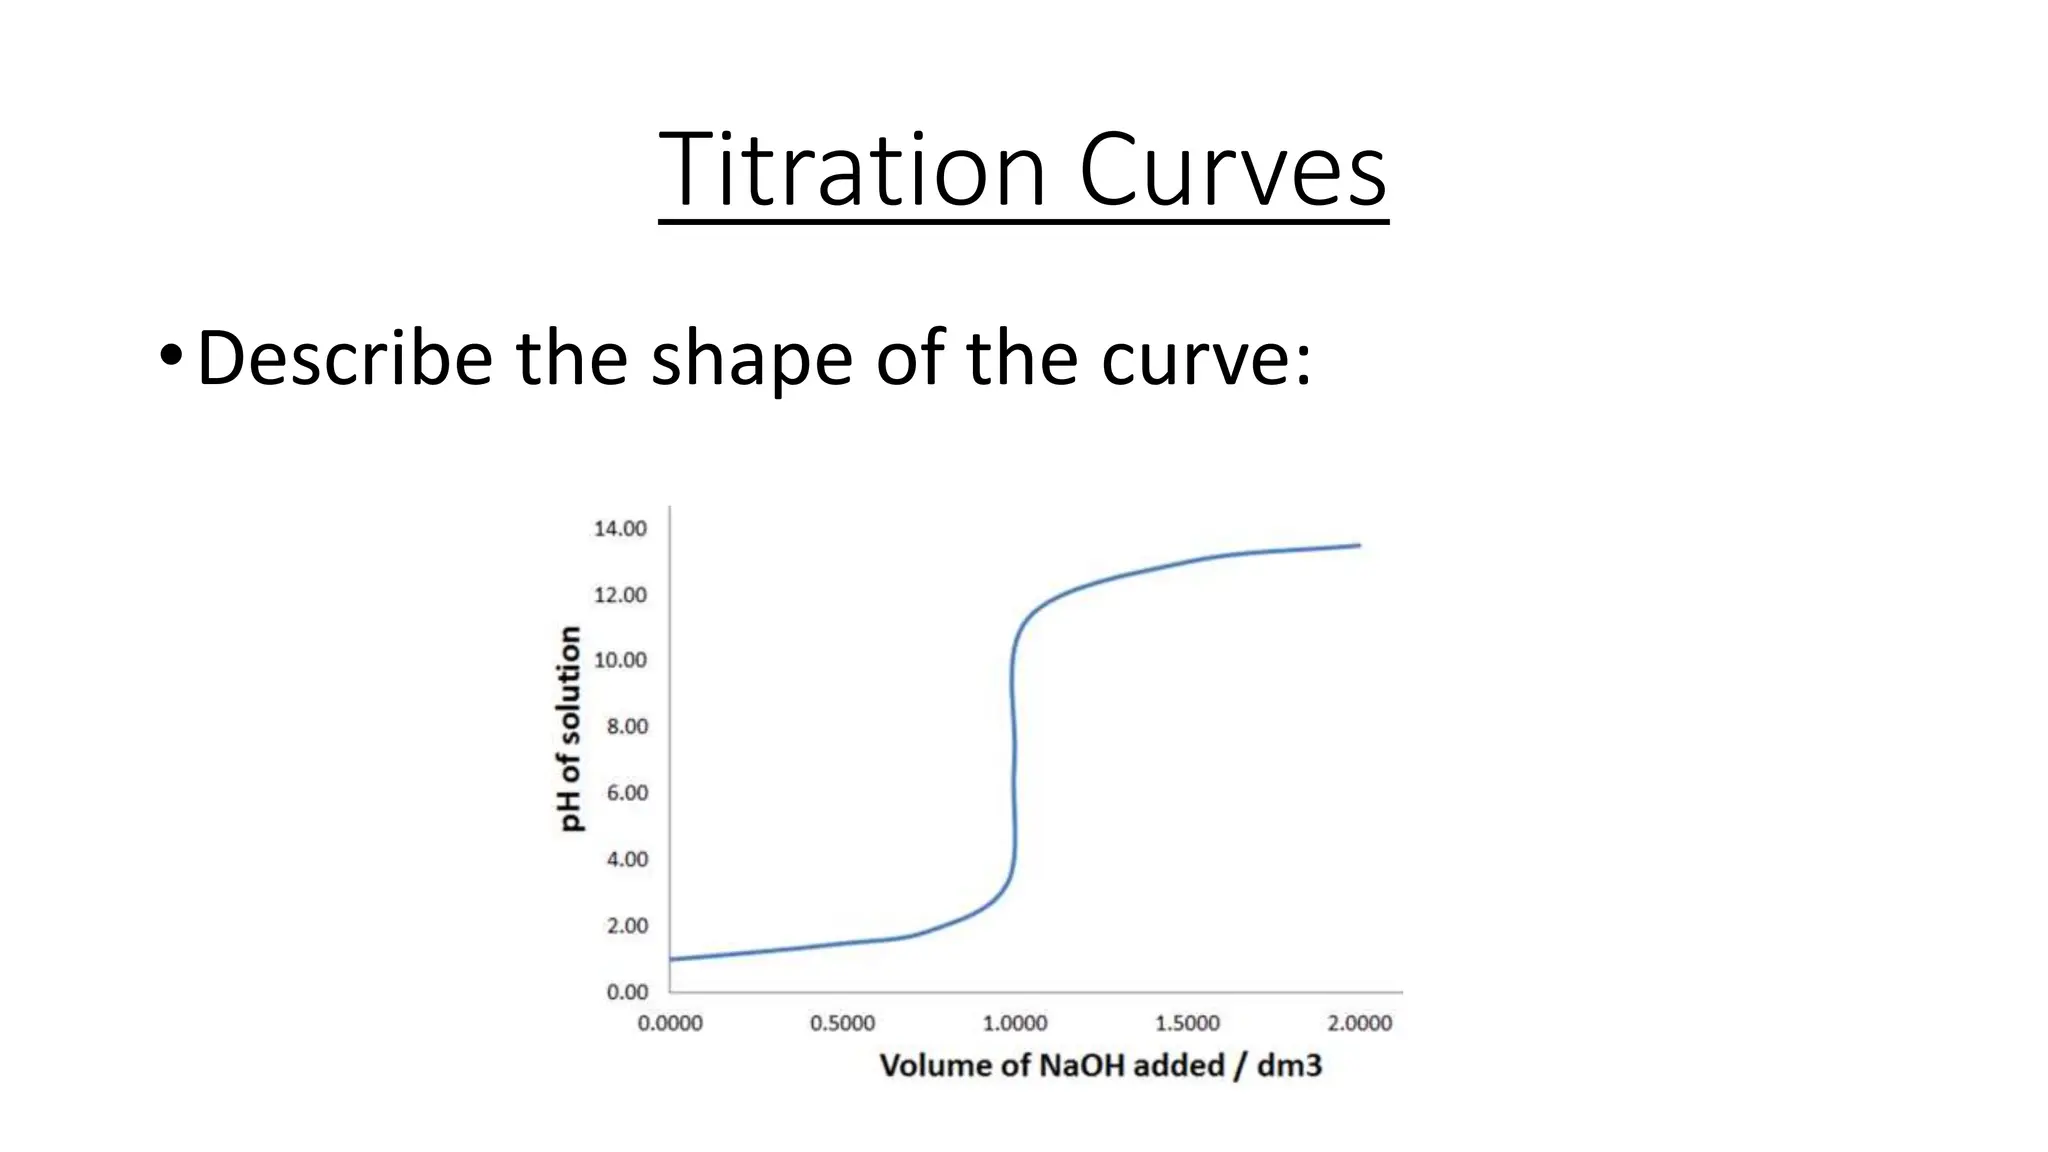
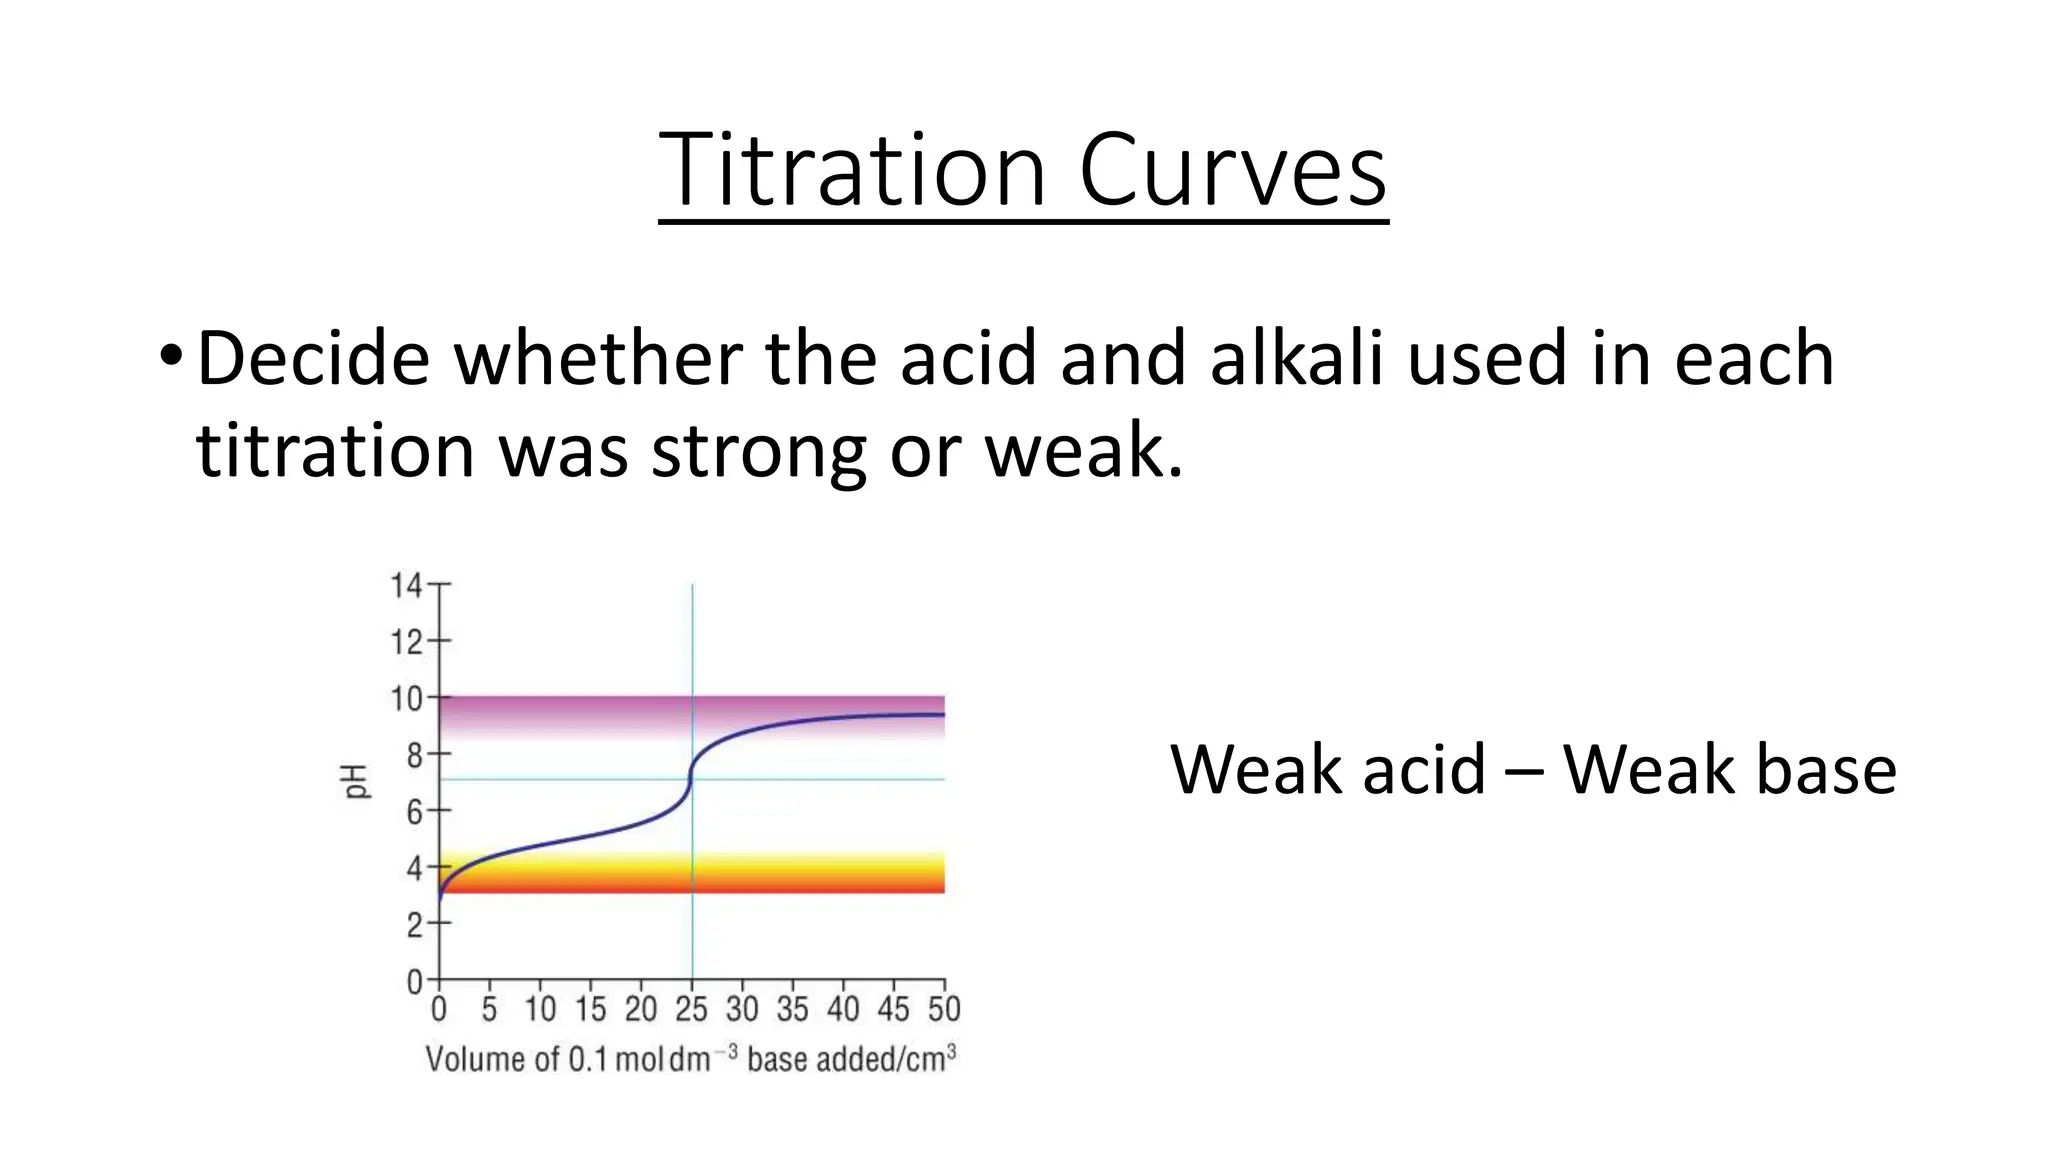
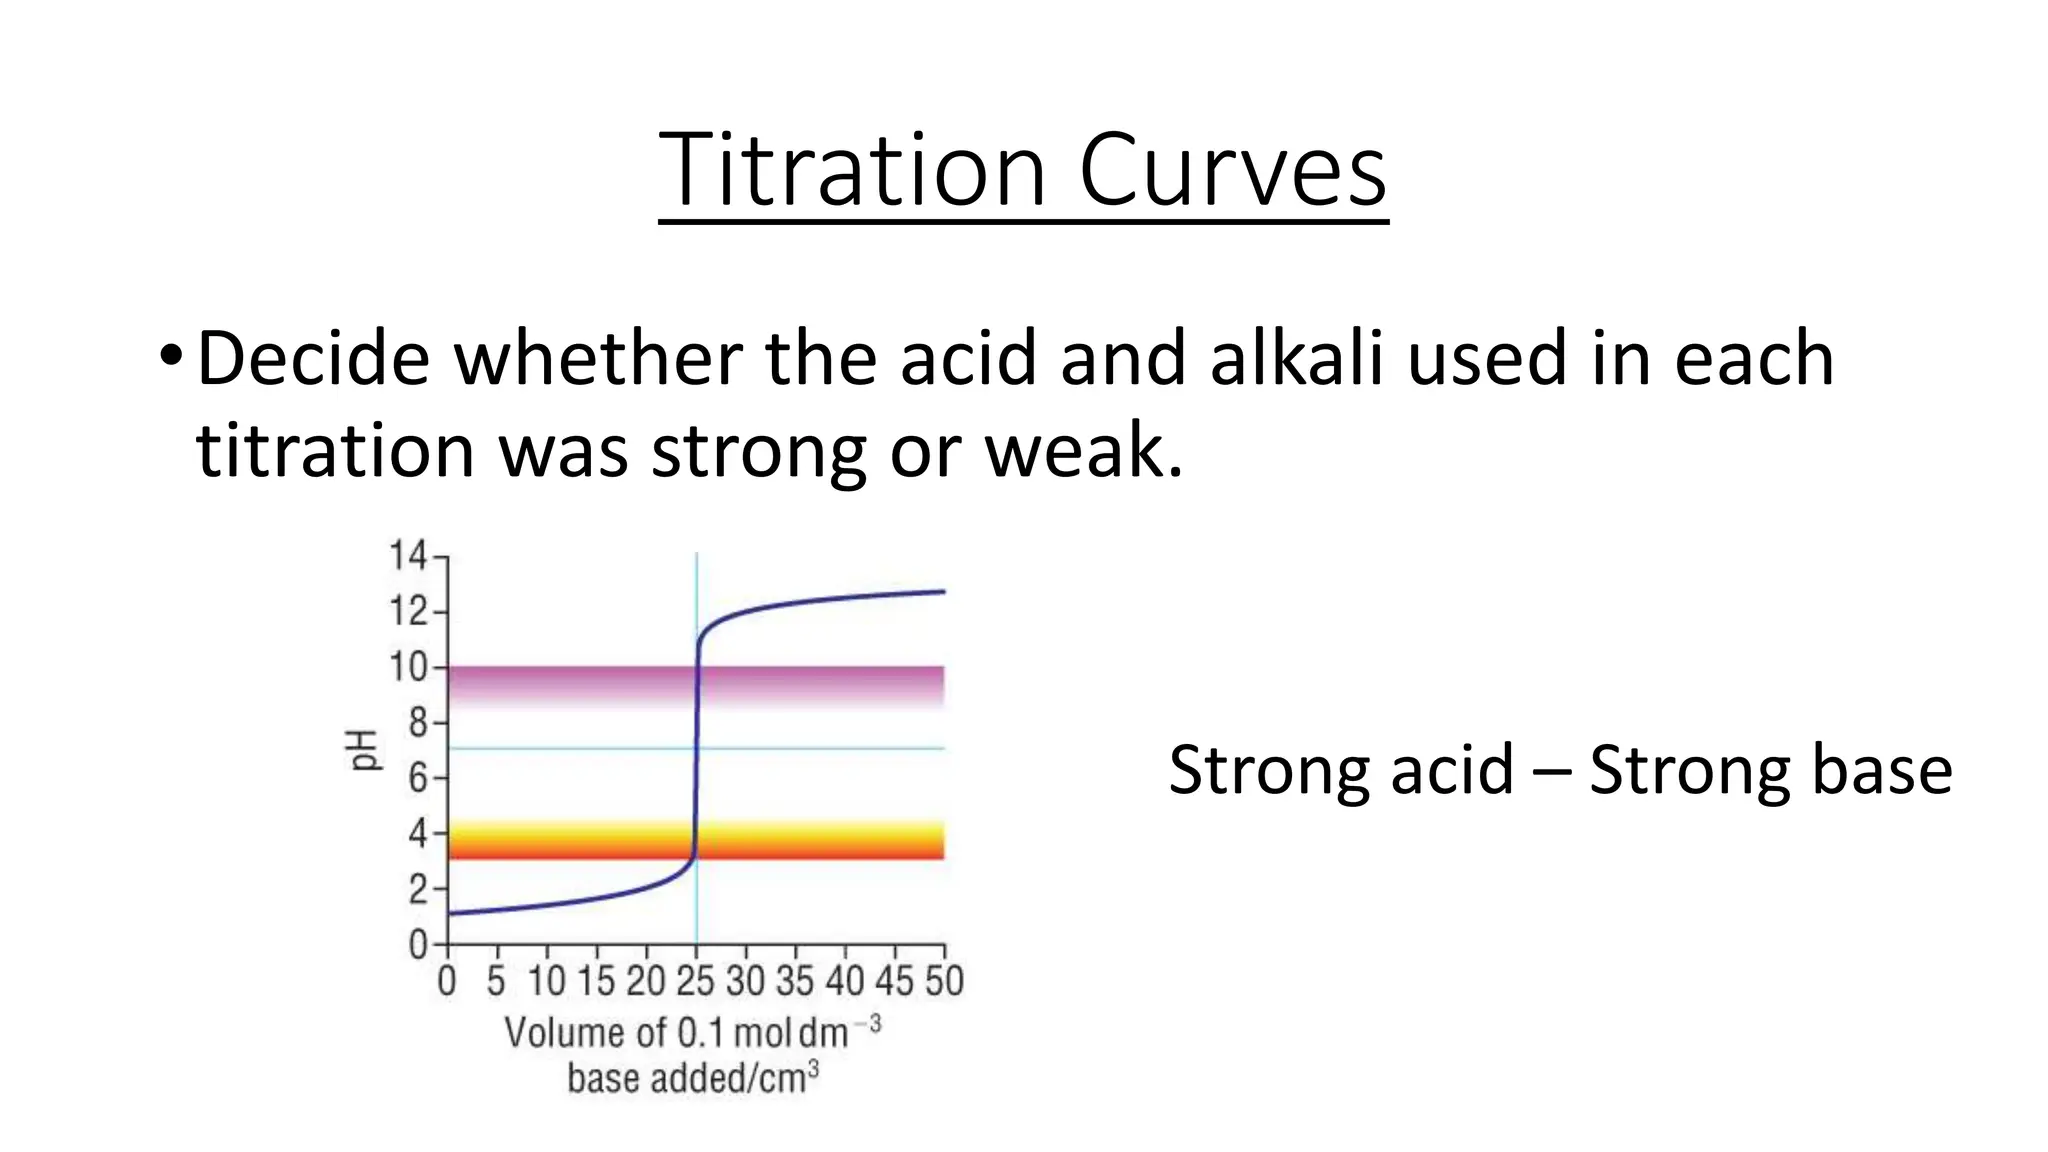
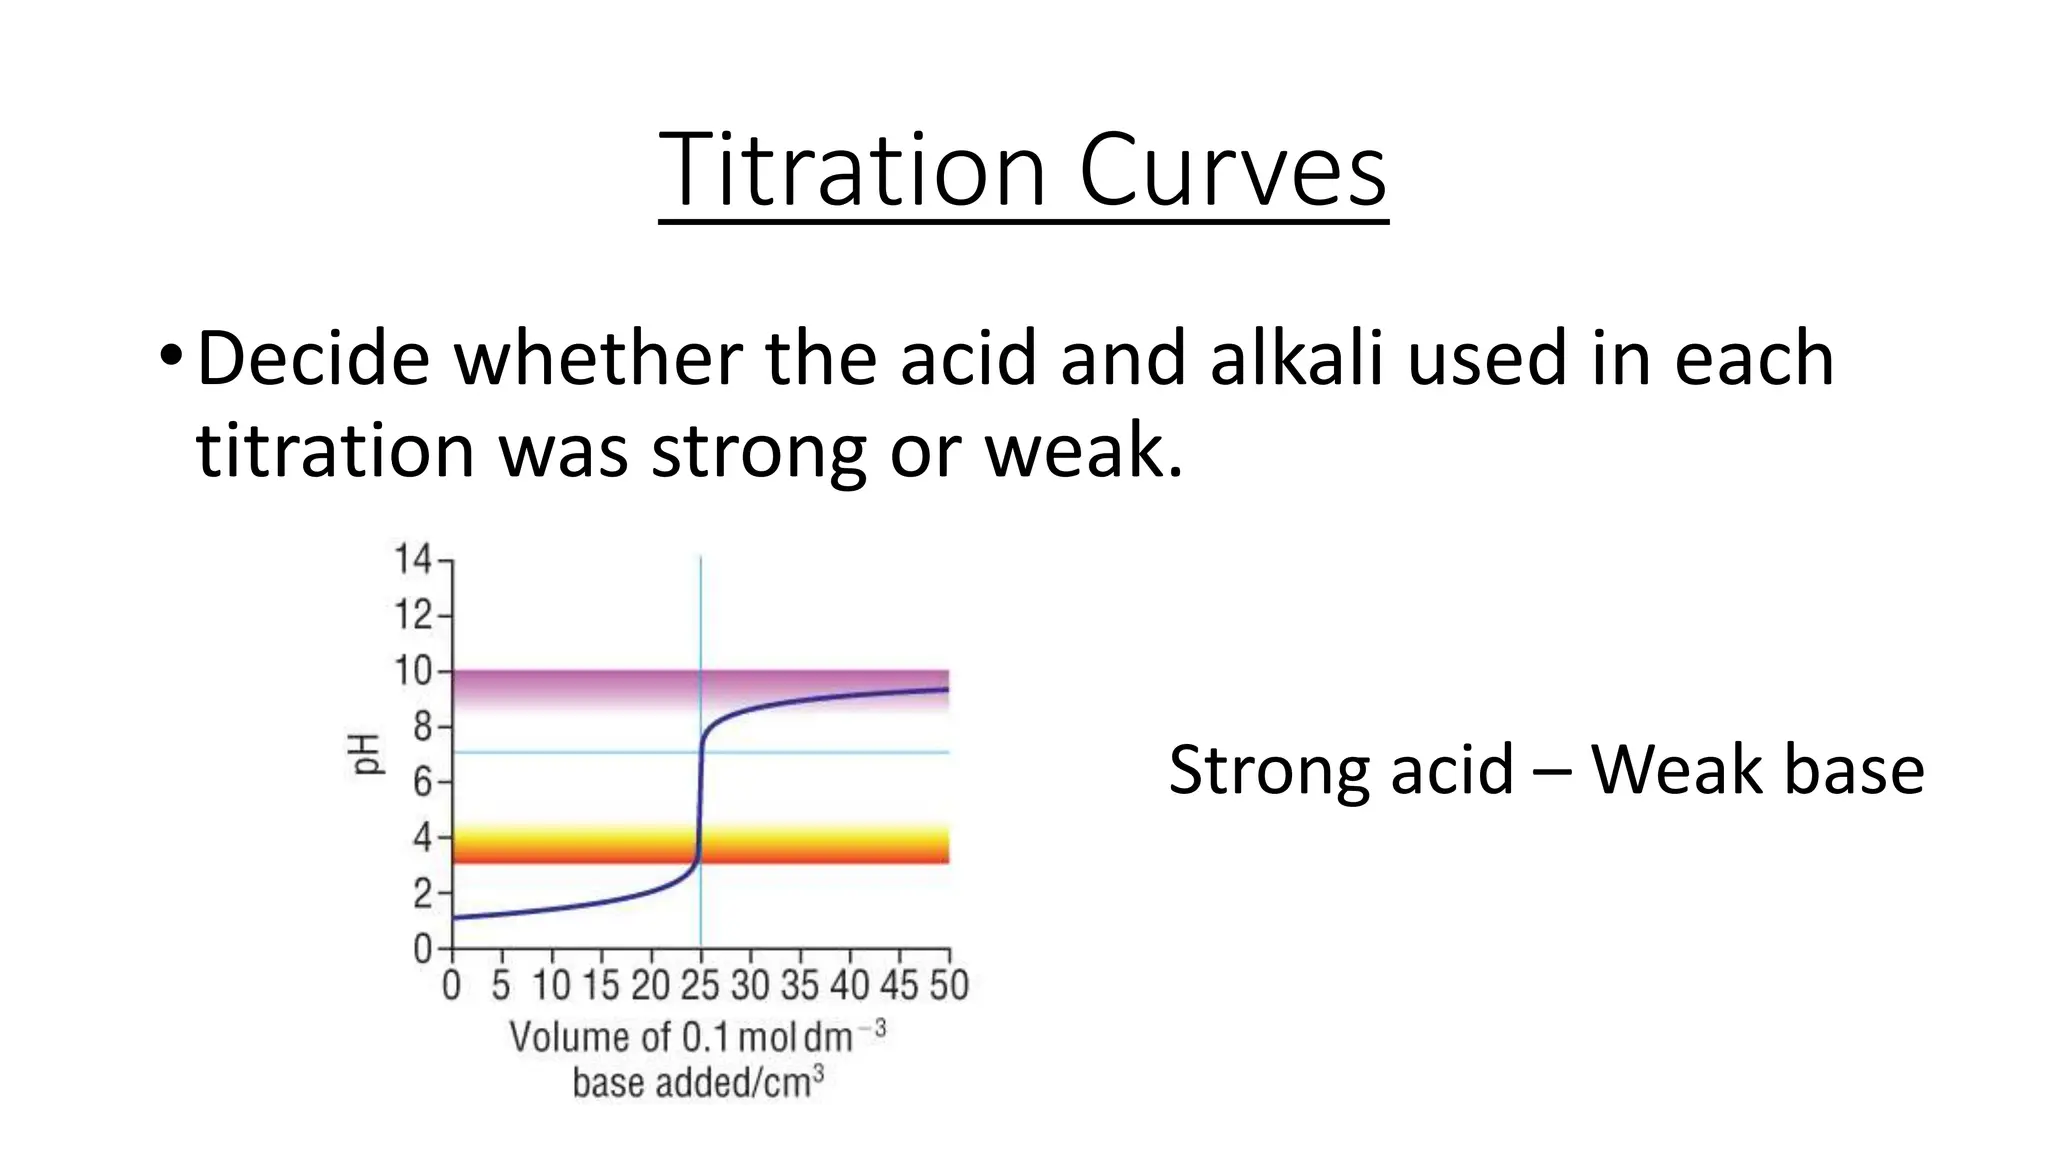
This document provides information about acid-base titrations including definitions of key terms like equivalence point and neutral point. It describes what happens during a titration and the typical shape of the titration curve. It explains that the titration curve for a strong acid with a strong base will have a sharp pH rise at the equivalence point, making phenolphthalein or methyl orange suitable indicators. The curve for a weak acid and weak base does not have a well-defined equivalence point, so neither indicator is suitable.

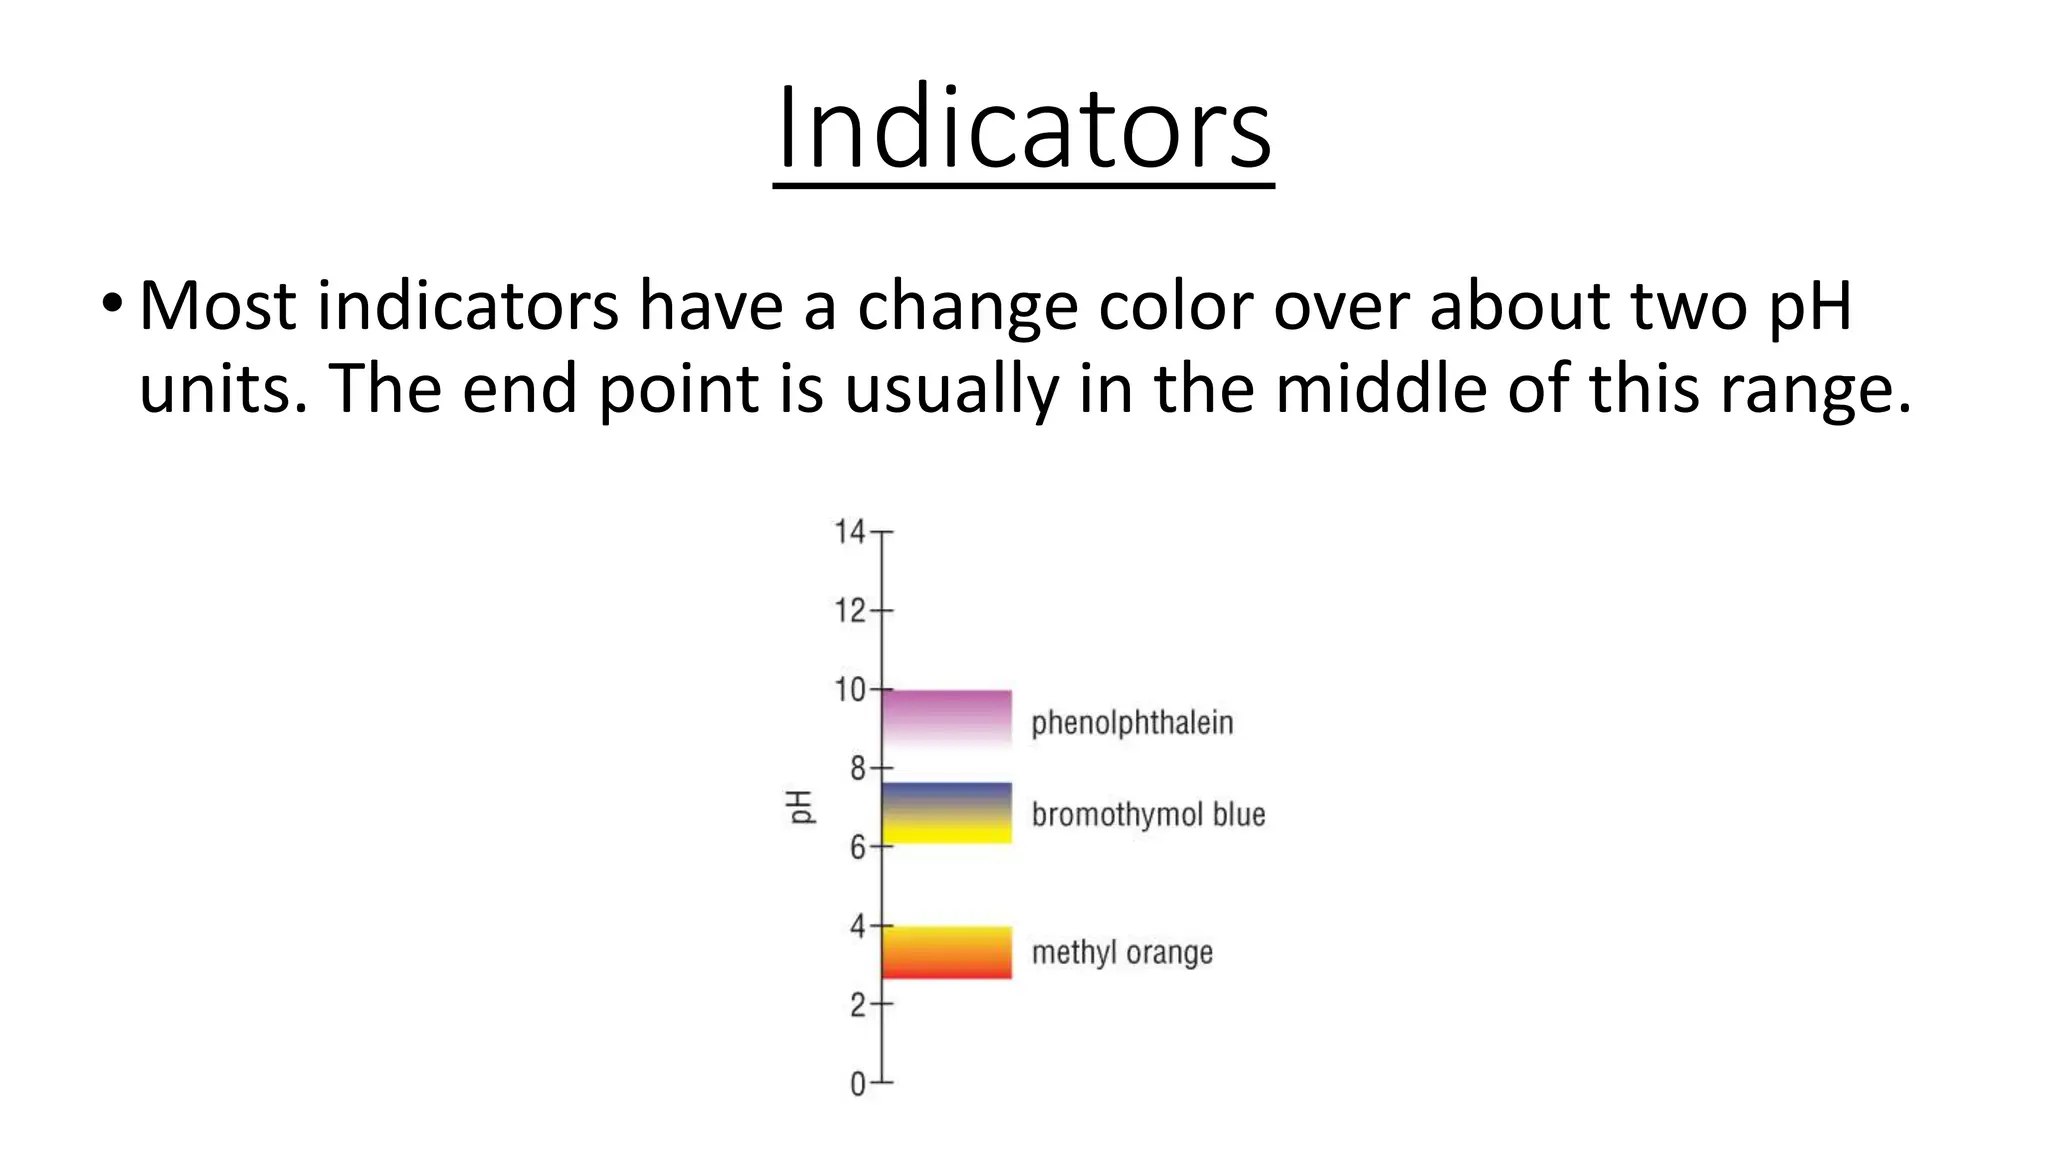
![Indicators
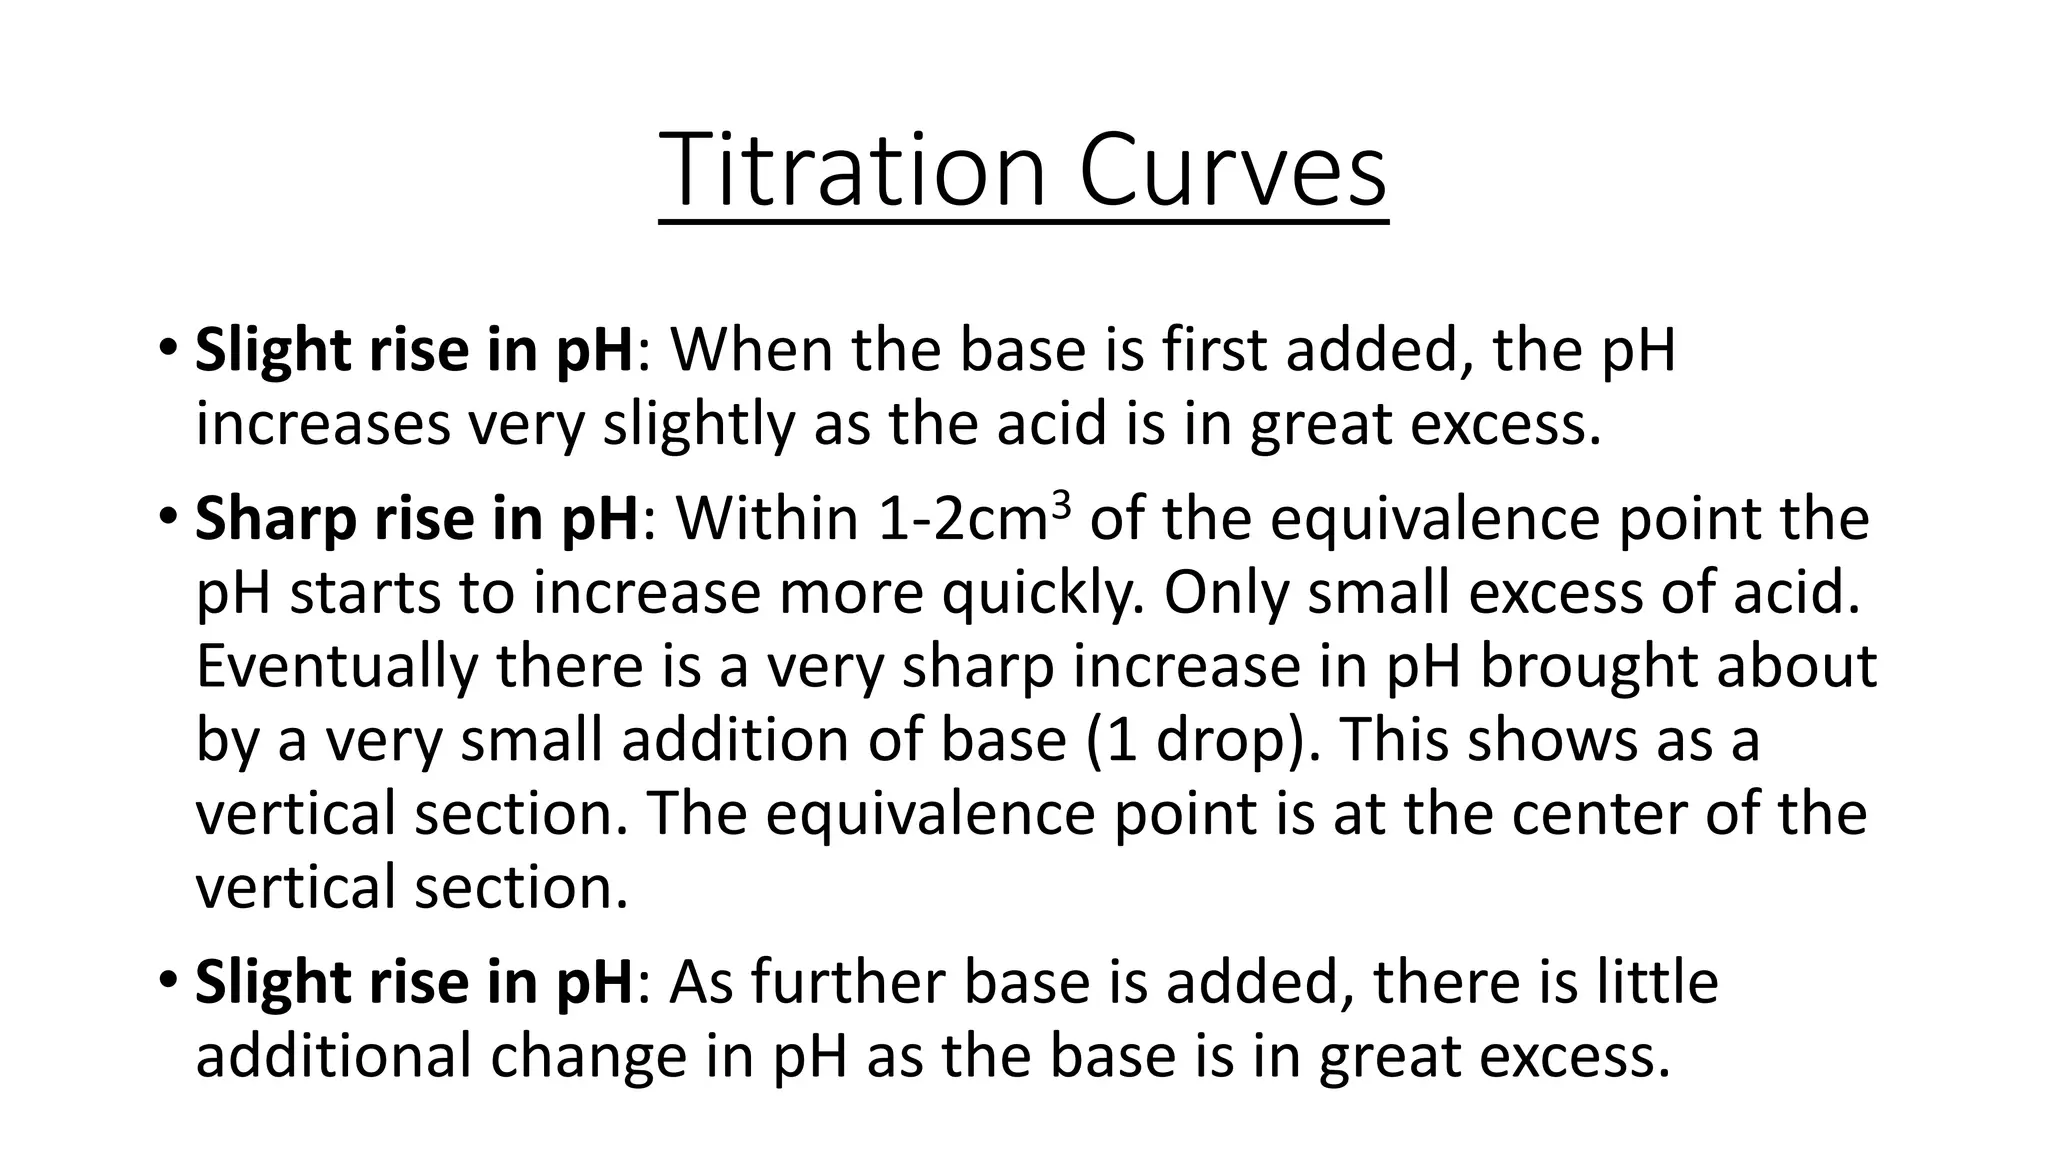
•For methyl orange, HIn is red and In- is yellow:
H+ +
•When there are equal amounts of the weak
acid and the conjugate base present:
•[HIn] = [In-] The indicator is at its end point.](https://image.slidesharecdn.com/titration-curves-240128084215-b90cbfa8/75/Titration-curves-pptx-16-2048.jpg)