Acid–Base Titration Curvesand
Indicators
Reference:
1. Quantitative Anlysis by V. Alexeyev
2. Pharmaceutical Analysis by Chaten
2.
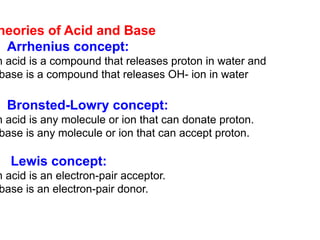
heories of Acidand Base
. Arrhenius concept:
n acid is a compound that releases proton in water and
base is a compound that releases OH- ion in water
. Bronsted-Lowry concept:
n acid is any molecule or ion that can donate proton.
base is any molecule or ion that can accept proton.
. Lewis concept:
n acid is an electron-pair acceptor.
base is an electron-pair donor.
3.
Principle of NeutralizationMethod
• The neutralization method is based on the neutralization reaction:
H+
+ OH -
↔ H2O
• By this method a standard solution of an acid can be used for the
quantitative determination of alkalies (alkalimetry) or a standard
solution of base can be used for the quantitative determination of
acid (acidimetry).
• From quantitative analysis, we know that any aqueous solution
regardless of the reaction contains H+
and OH -
as the result of
dissociation of water.
[H+
][OH -
] = KH2O = 10-14
at 22 0
C
• By the theory of electrolytic dissociation acidic properties of
solution depends on H+
ions and basic properties on OH –
ions.
The concentration of these ions are equal in water in all neutral
solutions. So,
[H+
] = [OH -
] = √KH2O = √ 10-14
= 10-7
gram-ion/liter
4.
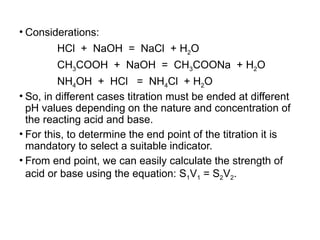
• Considerations:
HCl +NaOH = NaCl + H2O
CH3COOH + NaOH = CH3COONa + H2O
NH4OH + HCl = NH4Cl + H2O
• So, in different cases titration must be ended at different
pH values depending on the nature and concentration of
the reacting acid and base.
• For this, to determine the end point of the titration it is
mandatory to select a suitable indicator.
• From end point, we can easily calculate the strength of
acid or base using the equation: S1V1 = S2V2.
5.
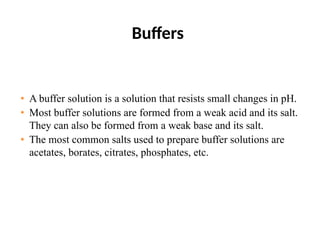
Buffers
• A buffersolution is a solution that resists small changes in pH.
• Most buffer solutions are formed from a weak acid and its salt.
They can also be formed from a weak base and its salt.
• The most common salts used to prepare buffer solutions are
acetates, borates, citrates, phosphates, etc.
6.
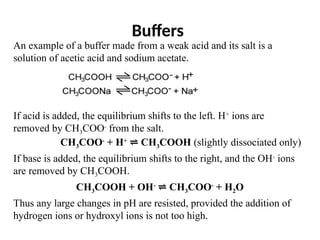
Buffers
An example ofa buffer made from a weak acid and its salt is a
solution of acetic acid and sodium acetate.
If acid is added, the equilibrium shifts to the left. H+
ions are
removed by CH3COO-
from the salt.
CH3COO-
+ H+
CH
⇌ 3COOH (slightly dissociated only)
If base is added, the equilibrium shifts to the right, and the OH-
ions
are removed by CH3COOH.
CH3COOH + OH-
CH
⇌ 3COO-
+ H2O
Thus any large changes in pH are resisted, provided the addition of
hydrogen ions or hydroxyl ions is not too high.
7.
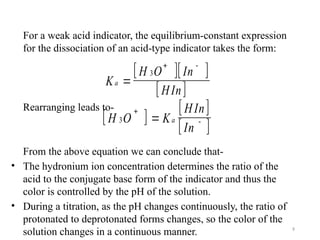
Buffers
The pH ofa weak acid- its salt buffer mixture is obtained using the Henderson-
Hesselbach equation:
pH = pKa + log ([conjugate base] / [acid])
Similarly, pH of a weak base- its salt buffer is obtained by:
pOH = pKb + log ([conjugate acid] / [base])
or, pH = pKw - pKb - log ([conjugate acid] / [base])
The buffering capacity of a buffer solution is a measure of its capacity to prevent
changes in pH. It depends on:
i) the total concentration of weak acid/base and its salt.
ii) the ratio of [salt] / [acid] or [salt] / [base] .
When choosing an acid for a buffer system, an acid should be chosen
whose pKa is close to the desired pH at which the buffering system is desired to
function.
8.
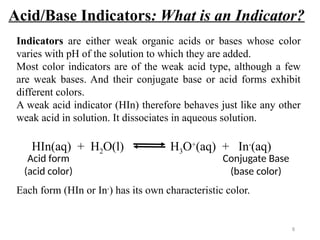
Acid/Base Indicators: Whatis an Indicator?
Indicators are either weak organic acids or bases whose color
varies with pH of the solution to which they are added.
Most color indicators are of the weak acid type, although a few
are weak bases. And their conjugate base or acid forms exhibit
different colors.
A weak acid indicator (HIn) therefore behaves just like any other
weak acid in solution. It dissociates in aqueous solution.
Each form (HIn or In-
) has its own characteristic color.
HIn(aq) + H2O(l) H3O+
(aq) + In-
(aq)
Acid form
(acid color)
Conjugate Base
(base color)
8
9.
For a weakacid indicator, the equilibrium-constant expression
for the dissociation of an acid-type indicator takes the form:
Rearranging leads to-
From the above equation we can conclude that-
• The hydronium ion concentration determines the ratio of the
acid to the conjugate base form of the indicator and thus the
color is controlled by the pH of the solution.
• During a titration, as the pH changes continuously, the ratio of
protonated to deprotonated forms changes, so the color of the
solution changes in a continuous manner.
K
H O In
HIn
a
3
H O K
HIn
In
a
3
+
+
-
-
9
10.
Similarly, the equilibriumfor a base-type indicator (In) is:
In + H2O InH+
+ OH-
Application: Indicators are used to detect the end point in a
titration. they cannot give a particular numerical value for pH.
They are useful for the visual determination of
neutralization/equivalence points only.
10
Base form
(base color)
Conjugate Acid
(acid color)
11.
Theories of Indicator
-Arrheneus theory of dissociation (1887)
- Ostwald (1894) formulate the ionic theory of indicators. By this
theory:
Neutralization indicators are weak acids or bases in which
undissociated molecules differ in color from their ions.
e.g. litmus contain certain acid (azolitmic), the undissociated form
is red while its anion is blue in color. So the acidic indicator can be
expressed as HInd.
HInd ↔ H+
+ Ind-
(acidic indicator)
Red Blue
Drawbacks:
- This theory is not quite correct for certain organic
compound whose color depends upon the structure of the molecules
and color changes occur due to intramolecular rearrangement.
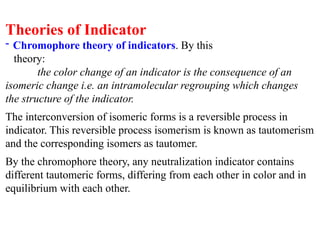
12.
Theories of Indicator
-Chromophore theory of indicators. By this
theory:
the color change of an indicator is the consequence of an
isomeric change i.e. an intramolecular regrouping which changes
the structure of the indicator.
The interconversion of isomeric forms is a reversible process in
indicator. This reversible process isomerism is known as tautomerism
and the corresponding isomers as tautomer.
By the chromophore theory, any neutralization indicator contains
different tautomeric forms, differing from each other in color and in
equilibrium with each other.
13.
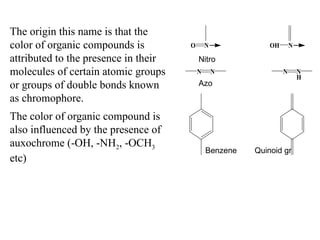
The origin thisname is that the
color of organic compounds is
attributed to the presence in their
molecules of certain atomic groups
or groups of double bonds known
as chromophore.
The color of organic compound is
also influenced by the presence of
auxochrome (-OH, -NH2, -OCH3
etc)
O N OH N
N N N N
H
Nitro
Azo
Benzene Quinoid gr
14.
N
OH
N
O
O
O OH
O
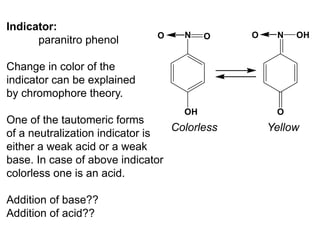
Indicator:
paranitro phenol
Changein color of the
indicator can be explained
by chromophore theory.
One of the tautomeric forms
of a neutralization indicator is
either a weak acid or a weak
base. In case of above indicator
colorless one is an acid.
Addition of base??
Addition of acid??
Colorless Yellow
15.
Selection of anIndicator for a Titration:
To select an appropriate indicator, it is necessary to know what
would be the pH at the equivalence point of the titration.
The pH of a titration changes dramatically near the equivalence
point. A very small addition of the titrant causes a large
change in the pH. So if the indicator changes colors near this
drastic pH change, the indicator error will be small.
An indicator is chosen whose pKIn is close to the equivalence
point pH, so that the color transition range of the indicator
overlaps with the suspected or known equivalence point pH.
In this way, the visual endpoint that the indicator gives will be
very close to the actual equivalence point.
15
16.
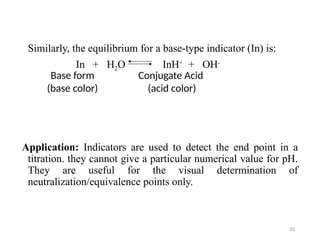
Principle of Selectionof Indicator
HInd ↔ H+
+ Ind-
-
K = [H+
][Ind-
] / [HInd]
-
K = [H+
] Calk / Cacid
-
[H+
] = K Cacid / Calk
-log [H+
] = -log K - logCacid / Calk
pH = pK - logCacid / Calk
pH = pK - 1 [if acid/alkali is 91/9 i.e 10:1]
pH = pK + 1 [if acid/alkali is 9/91 i.e 1:10]
pH range = pK 1
17.
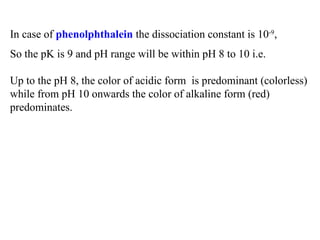
In case ofphenolphthalein the dissociation constant is 10-9
,
So the pK is 9 and pH range will be within pH 8 to 10 i.e.
Up to the pH 8, the color of acidic form is predominant (colorless)
while from pH 10 onwards the color of alkaline form (red)
predominates.
18.
For selection ofa suitable indicator
- You need to know the pH range of the indicator
- the pH range of indicator must overlap the pH change of the
titration through equivalence point
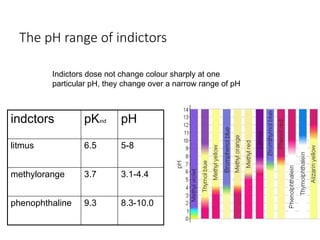
The pH rangeof indictors
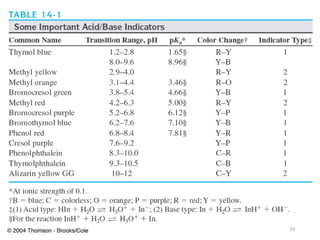
indctors pKind pH
litmus 6.5 5-8
methylorange 3.7 3.1-4.4
phenophthaline 9.3 8.3-10.0
Indictors dose not change colour sharply at one
particular pH, they change over a narrow range of pH
21.
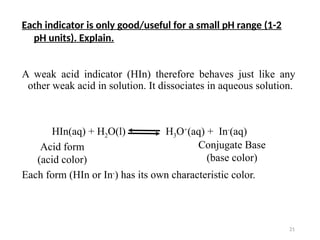
A weak acidindicator (HIn) therefore behaves just like any
other weak acid in solution. It dissociates in aqueous solution.
Each form (HIn or In-
) has its own characteristic color.
21
HIn(aq) + H2O(l) H3O+
(aq) + In-
(aq)
Each indicator is only good/useful for a small pH range (1-2
pH units). Explain.
Acid form
(acid color)
Conjugate Base
(base color)
22.
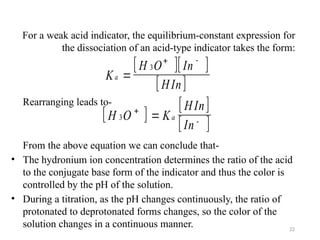
For a weakacid indicator, the equilibrium-constant expression for
the dissociation of an acid-type indicator takes the form:
Rearranging leads to-
From the above equation we can conclude that-
• The hydronium ion concentration determines the ratio of the acid
to the conjugate base form of the indicator and thus the color is
controlled by the pH of the solution.
• During a titration, as the pH changes continuously, the ratio of
protonated to deprotonated forms changes, so the color of the
solution changes in a continuous manner.
K
H O In
HIn
a
3
H O K
HIn
In
a
3
+ -
+
-
22
23.
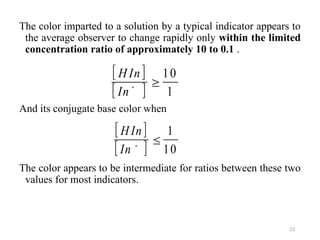
The color impartedto a solution by a typical indicator appears to
the average observer to change rapidly only within the limited
concentration ratio of approximately 10 to 0.1 .
And its conjugate base color when
The color appears to be intermediate for ratios between these two
values for most indicators.
23
H In
In
10
1
H In
In
1
10
-
-
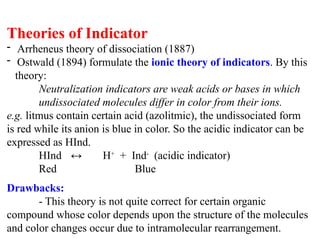
24.
For the fullacid color,
[H3O+
] = 10Ka
and similarly for the full conjugate base color,
[H3O+
] = 0.1Ka
To obtain the indicator pH range, we take the negative
logarithms of the two expression:
pH (acid color) = -log (10Ka) = pKa - 1
pH (conjugate base color) = -log (0.1Ka) = pKa + 1
Therefore, Indicator pH range = pKa 1
24
25.
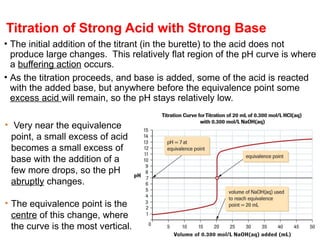
• The initialaddition of the titrant (in the burette) to the acid does not
produce large changes. This relatively flat region of the pH curve is where
a buffering action occurs.
• As the titration proceeds, and base is added, some of the acid is reacted
with the added base, but anywhere before the equivalence point some
excess acid will remain, so the pH stays relatively low.
• Very near the equivalence
point, a small excess of acid
becomes a small excess of
base with the addition of a
few more drops, so the pH
abruptly changes.
• The equivalence point is the
centre of this change, where
the curve is the most vertical.
Titration of Strong Acid with Strong Base
26.
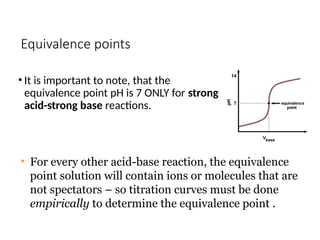
Equivalence points
• Itis important to note, that the
equivalence point pH is 7 ONLY for strong
acid-strong base reactions.
• For every other acid-base reaction, the equivalence
point solution will contain ions or molecules that are
not spectators – so titration curves must be done
empirically to determine the equivalence point .
27.
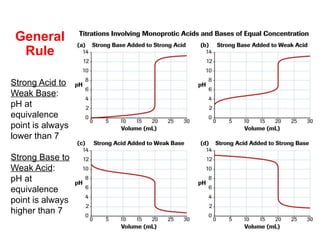
General
Rule
Strong Acid to
WeakBase:
pH at
equivalence
point is always
lower than 7
Strong Base to
Weak Acid:
pH at
equivalence
point is always
higher than 7
28.
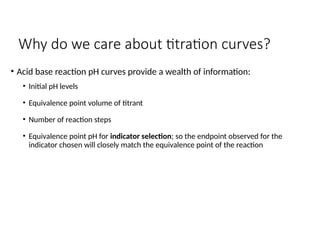
Why do wecare about titration curves?
• Acid base reaction pH curves provide a wealth of information:
• Initial pH levels
• Equivalence point volume of titrant
• Number of reaction steps
• Equivalence point pH for indicator selection; so the endpoint observed for the
indicator chosen will closely match the equivalence point of the reaction
29.
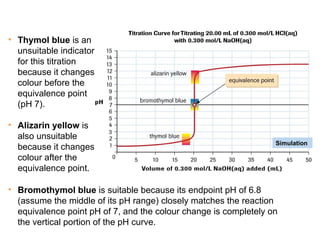
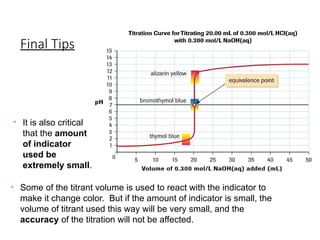
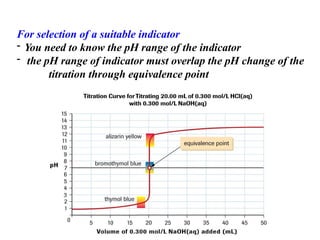
• Thymol blueis an
unsuitable indicator
for this titration
because it changes
colour before the
equivalence point
(pH 7).
• Alizarin yellow is
also unsuitable
because it changes
colour after the
equivalence point.
• Bromothymol blue is suitable because its endpoint pH of 6.8
(assume the middle of its pH range) closely matches the reaction
equivalence point pH of 7, and the colour change is completely on
the vertical portion of the pH curve.
Simulation
30.
• It isalso critical
that the amount
of indicator
used be
extremely small.
• Some of the titrant volume is used to react with the indicator to
make it change color. But if the amount of indicator is small, the
volume of titrant used this way will be very small, and the
accuracy of the titration will not be affected.
Final Tips
31.
Summary
• An indicatorfor an acid–base titration analysis must be chosen
to have an endpoint (change of colour) at very nearly the same
pH as the pH at the equivalence point of the reaction solution.
• The pH of the solution at the equivalence point for a strong
monoprotic acid–strong monoprotic base reaction will be 7.
• The pH of the solution at the equivalence point for any other
acid–base reaction must be determined experimentally, by
plotting a titration pH curve.

![Principle of Neutralization Method
• The neutralization method is based on the neutralization reaction:
H+
+ OH -
↔ H2O
• By this method a standard solution of an acid can be used for the
quantitative determination of alkalies (alkalimetry) or a standard
solution of base can be used for the quantitative determination of
acid (acidimetry).
• From quantitative analysis, we know that any aqueous solution
regardless of the reaction contains H+
and OH -
as the result of
dissociation of water.
[H+
][OH -
] = KH2O = 10-14
at 22 0
C
• By the theory of electrolytic dissociation acidic properties of
solution depends on H+
ions and basic properties on OH –
ions.
The concentration of these ions are equal in water in all neutral
solutions. So,
[H+
] = [OH -
] = √KH2O = √ 10-14
= 10-7
gram-ion/liter](https://image.slidesharecdn.com/titrationprocessforaquoussolution-250810020242-89365620/85/Titration-process-for-aquous-solution-pptx-3-320.jpg)
![Buffers
The pH of a weak acid- its salt buffer mixture is obtained using the Henderson-
Hesselbach equation:
pH = pKa + log ([conjugate base] / [acid])
Similarly, pH of a weak base- its salt buffer is obtained by:
pOH = pKb + log ([conjugate acid] / [base])
or, pH = pKw - pKb - log ([conjugate acid] / [base])
The buffering capacity of a buffer solution is a measure of its capacity to prevent
changes in pH. It depends on:
i) the total concentration of weak acid/base and its salt.
ii) the ratio of [salt] / [acid] or [salt] / [base] .
When choosing an acid for a buffer system, an acid should be chosen
whose pKa is close to the desired pH at which the buffering system is desired to
function.](https://image.slidesharecdn.com/titrationprocessforaquoussolution-250810020242-89365620/85/Titration-process-for-aquous-solution-pptx-7-320.jpg)
![Principle of Selection of Indicator
HInd ↔ H+
+ Ind-
-
K = [H+
][Ind-
] / [HInd]
-
K = [H+
] Calk / Cacid
-
[H+
] = K Cacid / Calk
-log [H+
] = -log K - logCacid / Calk
pH = pK - logCacid / Calk
pH = pK - 1 [if acid/alkali is 91/9 i.e 10:1]
pH = pK + 1 [if acid/alkali is 9/91 i.e 1:10]
pH range = pK 1](https://image.slidesharecdn.com/titrationprocessforaquoussolution-250810020242-89365620/85/Titration-process-for-aquous-solution-pptx-16-320.jpg)
![For the full acid color,
[H3O+
] = 10Ka
and similarly for the full conjugate base color,
[H3O+
] = 0.1Ka
To obtain the indicator pH range, we take the negative
logarithms of the two expression:
pH (acid color) = -log (10Ka) = pKa - 1
pH (conjugate base color) = -log (0.1Ka) = pKa + 1
Therefore, Indicator pH range = pKa 1
24](https://image.slidesharecdn.com/titrationprocessforaquoussolution-250810020242-89365620/85/Titration-process-for-aquous-solution-pptx-24-320.jpg)