This document provides an overview of demand, supply, and market equilibrium. It discusses the basic economic units of firms and households and how they interact in markets. Key concepts explained include:
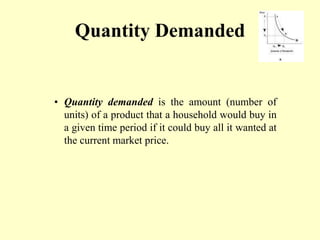
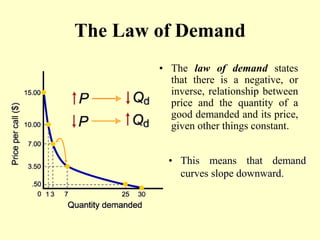
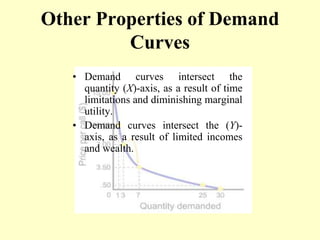
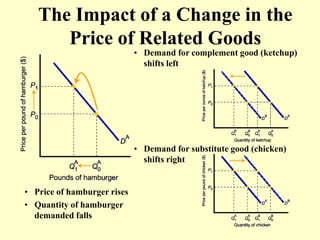
- Demand curves which show the relationship between price and quantity demanded. The law of demand states that demand is negatively related to price.
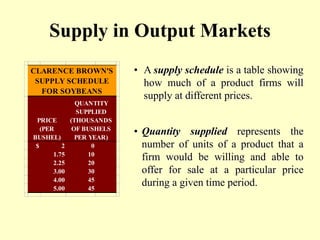
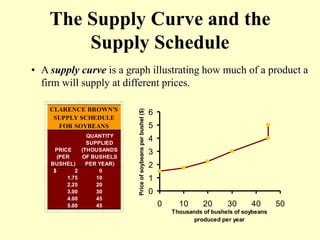
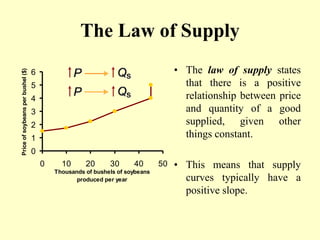
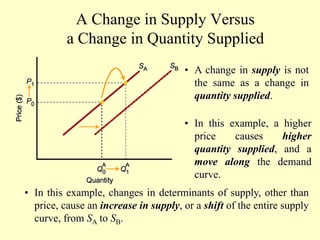
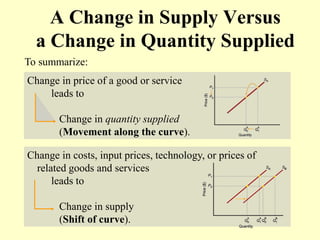
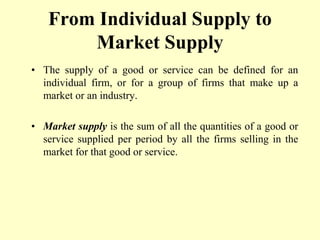
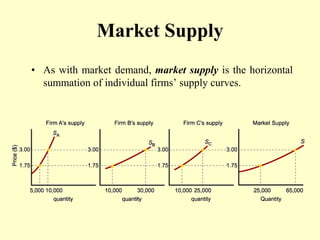
- Supply curves which show the positive relationship between price and quantity supplied according to the law of supply.
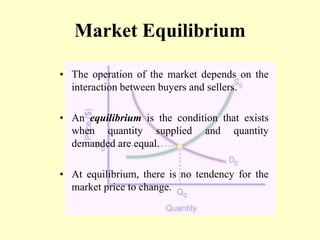
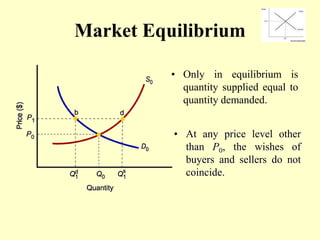
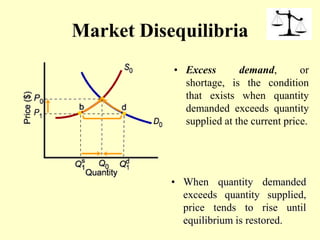
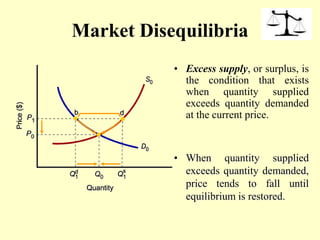
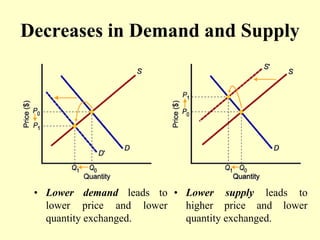
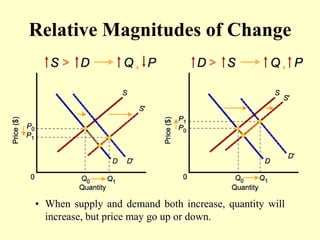
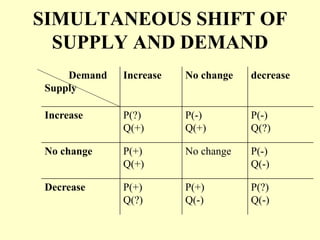
- Market equilibrium is reached at the price where quantity demanded equals quantity supplied. Disequilibria like excess demand and excess supply cause prices to change.
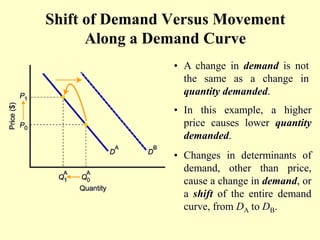
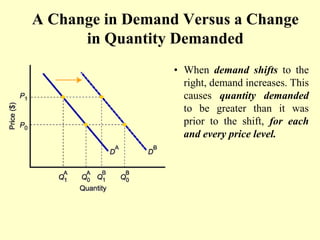
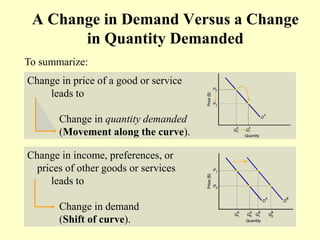
- Shifts in demand or supply curves versus movements along the curves in response to price changes.