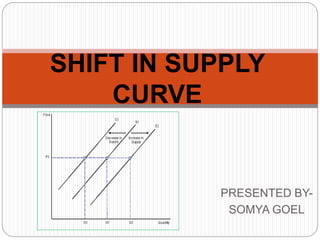
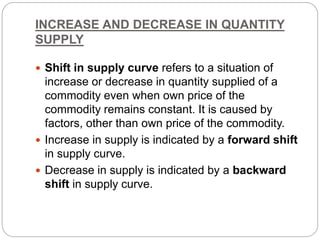
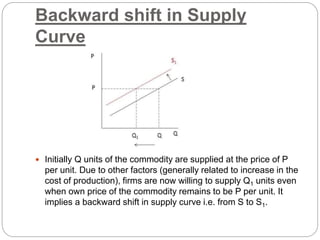
This document discusses shifts in supply curves, which refer to changes in the quantity supplied of a commodity even when its own price remains constant. An increase in supply is indicated by a forward shift of the supply curve, caused by factors that reduce production costs and increase the willingness of firms to supply more units at the same price. A decrease in supply is shown by a backward shift of the supply curve and can be caused by factors that increase costs and decrease firms' willingness to supply units at a given price. The document provides examples of specific factors that can lead to increases or decreases in supply.
Its is the power point presentation on the topic demand. it includes various topics like definition of demand, factors affecting demand, law of demand, demand function, expansion-contraction,increase-decrease, price elasticity, income elasticity and cross elasticity. And it is most useful to the students who want to learn the concept of demand.
Price elasticity of supply measures the responsiveness to the supply of a good or service after a change in its market price. According to basic economic theory, the supply of a good will increase when its price rises. Conversely, the supply of a good will decrease when its price decreases.
Unemployment in Bangladesh: Challenges and prospects Md Jakir Hossaion
Though it was a group presentation but most of the data are designed by me. Jakir Hossain - Student - Dhaka University Campus, Dhaka, Dhaka Division, Bangladesh - University of Dhaka.
Supply content slideshow. Designed for the Economic A level qualification. Can be used in revision and in class.
Subtopics:
Intro to Supply
The Supply Curve
Why is the Supply Curve Upward Sloping?
Determinants of Supply
Joint Supply
Individual supply is the supply of an individual producer at each price. Market supply is the sum of the individual supply schedules of all producers in the industry
Read| The latest issue of The Challenger is here! We are thrilled to announce that our school paper has qualified for the NATIONAL SCHOOLS PRESS CONFERENCE (NSPC) 2024. Thank you for your unwavering support and trust. Dive into the stories that made us stand out!
This is a presentation by Dada Robert in a Your Skill Boost masterclass organised by the Excellence Foundation for South Sudan (EFSS) on Saturday, the 25th and Sunday, the 26th of May 2024.
He discussed the concept of quality improvement, emphasizing its applicability to various aspects of life, including personal, project, and program improvements. He defined quality as doing the right thing at the right time in the right way to achieve the best possible results and discussed the concept of the "gap" between what we know and what we do, and how this gap represents the areas we need to improve. He explained the scientific approach to quality improvement, which involves systematic performance analysis, testing and learning, and implementing change ideas. He also highlighted the importance of client focus and a team approach to quality improvement.
How to Create Map Views in the Odoo 17 ERPCeline George
The map views are useful for providing a geographical representation of data. They allow users to visualize and analyze the data in a more intuitive manner.
Model Attribute Check Company Auto PropertyCeline George
In Odoo, the multi-company feature allows you to manage multiple companies within a single Odoo database instance. Each company can have its own configurations while still sharing common resources such as products, customers, and suppliers.
Students, digital devices and success - Andreas Schleicher - 27 May 2024..pptxEduSkills OECD
Andreas Schleicher presents at the OECD webinar ‘Digital devices in schools: detrimental distraction or secret to success?’ on 27 May 2024. The presentation was based on findings from PISA 2022 results and the webinar helped launch the PISA in Focus ‘Managing screen time: How to protect and equip students against distraction’ https://www.oecd-ilibrary.org/education/managing-screen-time_7c225af4-en and the OECD Education Policy Perspective ‘Students, digital devices and success’ can be found here - https://oe.cd/il/5yV
Operation “Blue Star” is the only event in the history of Independent India where the state went into war with its own people. Even after about 40 years it is not clear if it was culmination of states anger over people of the region, a political game of power or start of dictatorial chapter in the democratic setup.
The people of Punjab felt alienated from main stream due to denial of their just demands during a long democratic struggle since independence. As it happen all over the word, it led to militant struggle with great loss of lives of military, police and civilian personnel. Killing of Indira Gandhi and massacre of innocent Sikhs in Delhi and other India cities was also associated with this movement.
Welcome to TechSoup New Member Orientation and Q&A (May 2024).pdfTechSoup
In this webinar you will learn how your organization can access TechSoup's wide variety of product discount and donation programs. From hardware to software, we'll give you a tour of the tools available to help your nonprofit with productivity, collaboration, financial management, donor tracking, security, and more.
The Art Pastor's Guide to Sabbath | Steve ThomasonSteve Thomason
What is the purpose of the Sabbath Law in the Torah. It is interesting to compare how the context of the law shifts from Exodus to Deuteronomy. Who gets to rest, and why?
Ethnobotany and Ethnopharmacology:
Ethnobotany in herbal drug evaluation,
Impact of Ethnobotany in traditional medicine,
New development in herbals,
Bio-prospecting tools for drug discovery,
Role of Ethnopharmacology in drug evaluation,
Reverse Pharmacology.
2. INCREASE AND DECREASE IN QUANTITY
SUPPLY
Shift in supply curve refers to a situation of
increase or decrease in quantity supplied of a
commodity even when own price of the
commodity remains constant. It is caused by
factors, other than own price of the commodity.
Increase in supply is indicated by a forward shift
in supply curve.
Decrease in supply is indicated by a backward
shift in supply curve.
3. Forward shift in Supply Curve
Initially Q1 units of the commodity are supplied at the price of P1
per unit. Due to other factors (generally related to reduction in
the cost of production), firms are now willing to supply Q2 units
even when own price of the commodity remains to be P1 per unit.
It implies a forward shift in supply curve i.e. from S1 to S2.
4. Causes of Increase in Supply
Increase in supply may occur due to the following factors:
i. Improvement in technology leading to a fall in cost of production
and fall in cost of production.
ii. Reduction in factor prices causing a fall in cost of production.
iii. Decrease in the price of a competing product. It prompts the
producer to sell more at the existing price.
iv. Increase in number of firms in the industry. It causes increase in
market supply even when price of the commodity remains the
same.
v. High business expectations. It prompts the producers to
increase investments. Accordingly, supply increases.
vi. Shifts in goal of the firm to sales maximisation. ‘Clearance
Sale’ often leads to higher supplies even when price remains the
same.
vii. Decrease in taxation increases sales due to decrease in cost of
5. Backward shift in Supply
Curve
Initially Q units of the commodity are supplied at the price of P
per unit. Due to other factors (generally related to increase in the
cost of production), firms are now willing to supply Q1 units even
when own price of the commodity remains to be P per unit. It
implies a backward shift in supply curve i.e. from S to S1.
6. Causes of Decrease in Supply
Decrease in supply occurs due to the following reasons:
i. Use of outdated technology, causing a fall in efficiency
and rise in cost of production.
ii. Increase in factor prices, causing increase in cost of
production.
iii. Increase in price of a competing product. It prompt
the producers to restrict their supplies at the prevailing
price.
iv. Decrease in number of firms in the industry. This
decreases market supply of the product even when price
remains constant.
v. Low business expectations. It prompts the producers
to reduce investment. Accordingly, supply reduces.
vi. Shift in goal of the firm to profit maximisation. When
the focus is on profit maximisation, firms often restricts
sale of their product.
vii. Increase in taxation decreases sales due to increase in