Download free for 30 days
Sign in
Upload
Language (EN)
Support
Business
Mobile
Social Media
Marketing
Technology
Art & Photos
Career
Design
Education
Presentations & Public Speaking
Government & Nonprofit
Healthcare
Internet
Law
Leadership & Management
Automotive
Engineering
Software
Recruiting & HR
Retail
Sales
Services
Science
Small Business & Entrepreneurship
Food
Environment
Economy & Finance
Data & Analytics
Investor Relations
Sports
Spiritual
News & Politics
Travel
Self Improvement
Real Estate
Entertainment & Humor
Health & Medicine
Devices & Hardware
Lifestyle
Change Language
Language
English
Español
Português
Français
Deutsche
Cancel
Save
Submit search
EN
Uploaded by
RoyCimatu
PPTX, PDF
38 views
PP6 - Sampling Distribution and Central Limit Theorem (1).pptx
A lecture slide about sampling distribution
Sales
◦
Read more
0
Save
Share
Embed
Embed presentation
Download
Download to read offline
1
/ 12
2
/ 12
3
/ 12
4
/ 12
5
/ 12
6
/ 12
7
/ 12
8
/ 12
9
/ 12
10
/ 12
11
/ 12
12
/ 12
More Related Content
PPTX
9. Sampling of the pinoy Distribution.pptx.pptx
by
carldanielsantos
PPTX
Business statistic ii
by
Lenin Chakma
PPT
chapter three Sampling_distributions_1.ppt
by
aschalew shiferaw
PPT
Chapter one on sampling distributions.ppt
by
FekaduAman
PPT
Sampling_Distribution DESCRIPTIVE STATISTICS 2.ppt
by
PreetKaur564844
PPT
Chapter8_central limit_theorem_presentation
by
neelamchaudhary60
PPTX
Sampling_Distribution_stat_of_Mean_New.pptx
by
RajJirel
PPTX
Sampling Distributions and Estimators
by
Long Beach City College
9. Sampling of the pinoy Distribution.pptx.pptx
by
carldanielsantos
Business statistic ii
by
Lenin Chakma
chapter three Sampling_distributions_1.ppt
by
aschalew shiferaw
Chapter one on sampling distributions.ppt
by
FekaduAman
Sampling_Distribution DESCRIPTIVE STATISTICS 2.ppt
by
PreetKaur564844
Chapter8_central limit_theorem_presentation
by
neelamchaudhary60
Sampling_Distribution_stat_of_Mean_New.pptx
by
RajJirel
Sampling Distributions and Estimators
by
Long Beach City College
Similar to PP6 - Sampling Distribution and Central Limit Theorem (1).pptx
PDF
Chapter 7 statistics for the behavioural sciences
by
JustinB27
PPT
The sampling distribution
by
Harve Abella
PPTX
Probability and Samples: The Distribution of Sample Means
by
jasondroesch
PDF
Probability & Samples
by
Kaori Kubo Germano, PhD
PPTX
7-THE-SAMPLING-DISTRIBUTION-OF-SAMPLE-MEANS-CLT.pptx
by
HASDINABKARIANEBRAHI
PPTX
Lecture 5 Sampling distribution of sample mean.pptx
by
shakirRahman10
PPT
Chapter8
by
Richard Ferreria
PPTX
Fundamentals of Sampling Distribution and Data Descriptions
by
Emonur Rahman Fahim
PDF
Business Statistics in Practice 8th Edition Bowerman Test Bank
by
hakibupaavo
PPTX
bbs14e_ppt_ch07.pptx
by
kajalthakkar16
PDF
Business Statistics in Practice 8th Edition Bowerman Test Bank
by
samyrqueri
PPT
Sfs4e ppt 08
by
Uconn Stamford
PDF
Identifying the sampling distribution module5
by
REYEMMANUELILUMBA
PPT
Mpu 1033 Kuliah 9
by
SITI AHMAD
DOC
Chapter 7 sampling distributions
by
meharahutsham
PPTX
Gravetter10e_PPT_Ch07_student.pptx
by
Naveedahmed476791
PDF
Business Statistics in Practice 8th Edition Bowerman Test Bank
by
vnuujbo7463
PPT
The Central Limit Theorem for engineering student's.ppt
by
aakashrathi20022016
DOC
Sqqs1013 ch6-a122
by
kim rae KI
PDF
Sampling & Sampling Distribtutions
by
Birinder Singh Gulati
Chapter 7 statistics for the behavioural sciences
by
JustinB27
The sampling distribution
by
Harve Abella
Probability and Samples: The Distribution of Sample Means
by
jasondroesch
Probability & Samples
by
Kaori Kubo Germano, PhD
7-THE-SAMPLING-DISTRIBUTION-OF-SAMPLE-MEANS-CLT.pptx
by
HASDINABKARIANEBRAHI
Lecture 5 Sampling distribution of sample mean.pptx
by
shakirRahman10
Chapter8
by
Richard Ferreria
Fundamentals of Sampling Distribution and Data Descriptions
by
Emonur Rahman Fahim
Business Statistics in Practice 8th Edition Bowerman Test Bank
by
hakibupaavo
bbs14e_ppt_ch07.pptx
by
kajalthakkar16
Business Statistics in Practice 8th Edition Bowerman Test Bank
by
samyrqueri
Sfs4e ppt 08
by
Uconn Stamford
Identifying the sampling distribution module5
by
REYEMMANUELILUMBA
Mpu 1033 Kuliah 9
by
SITI AHMAD
Chapter 7 sampling distributions
by
meharahutsham
Gravetter10e_PPT_Ch07_student.pptx
by
Naveedahmed476791
Business Statistics in Practice 8th Edition Bowerman Test Bank
by
vnuujbo7463
The Central Limit Theorem for engineering student's.ppt
by
aakashrathi20022016
Sqqs1013 ch6-a122
by
kim rae KI
Sampling & Sampling Distribtutions
by
Birinder Singh Gulati
Recently uploaded
PPTX
CEH-Day1.pptxssadasdsadsadasdsadasdsadasda
by
AbdulrhmanNahas1
PDF
Examine the Premier Sites for Safely Buying Gmail Accounts.pdf
by
Marketing
PDF
Mahabirgroup.com,Mahabir_projects,factory setup
by
Saurabh Maskara - We are hiring
PDF
218 Trusted Sites for Acquiring LinkedIn Accounts in the USA for 2026.pdf
by
Buy Old Gmail Accounts
DOCX
Best 39 Marketplaces to Purchase Bulk Old Gmail Accounts This Year.docx
by
Buy Old Gmail Accounts
DOCX
How to Effectively Buy Gmail Accounts_ A Step-by-Step Guide.docx
by
Marketing
PDF
Coleção MAR ABERTO (drop 1) .
by
mktjan
CEH-Day1.pptxssadasdsadsadasdsadasdsadasda
by
AbdulrhmanNahas1
Examine the Premier Sites for Safely Buying Gmail Accounts.pdf
by
Marketing
Mahabirgroup.com,Mahabir_projects,factory setup
by
Saurabh Maskara - We are hiring
218 Trusted Sites for Acquiring LinkedIn Accounts in the USA for 2026.pdf
by
Buy Old Gmail Accounts
Best 39 Marketplaces to Purchase Bulk Old Gmail Accounts This Year.docx
by
Buy Old Gmail Accounts
How to Effectively Buy Gmail Accounts_ A Step-by-Step Guide.docx
by
Marketing
Coleção MAR ABERTO (drop 1) .
by
mktjan
PP6 - Sampling Distribution and Central Limit Theorem (1).pptx
1.
ESM 2035: Engineering
Data Analysis (ACPM) Mario F. Triola, Elementary Statistics, Larson & Farber, Elementary Statistics: Picturing the World Copyright © 2010, 2007, 2004 Pearson Education, Inc. All Rights Reserved. Sampling Distributions and the Central Limit Theorem
2.
ESM 2035: Engineering
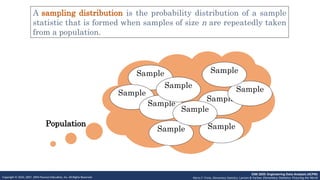
Data Analysis (ACPM) Mario F. Triola, Elementary Statistics, Larson & Farber, Elementary Statistics: Picturing the World Copyright © 2010, 2007, 2004 Pearson Education, Inc. All Rights Reserved. Population Sample A sampling distribution is the probability distribution of a sample statistic that is formed when samples of size n are repeatedly taken from a population. Sample Sample Sample Sample Sample Sample Sample Sample Sample
3.
ESM 2035: Engineering
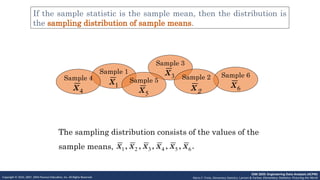
Data Analysis (ACPM) Mario F. Triola, Elementary Statistics, Larson & Farber, Elementary Statistics: Picturing the World Copyright © 2010, 2007, 2004 Pearson Education, Inc. All Rights Reserved. If the sample statistic is the sample mean, then the distribution is the sampling distribution of sample means. Sample 1 1 x Sample 4 4 x Sample 3 3 x Sample 6 6 x The sampling distribution consists of the values of the sample means, 1 2 3 4 5 6 , , , , , . x x x x x x Sample 2 2 x Sample 5 5 x
4.
ESM 2035: Engineering
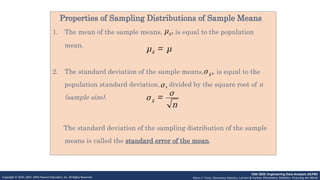
Data Analysis (ACPM) Mario F. Triola, Elementary Statistics, Larson & Farber, Elementary Statistics: Picturing the World Copyright © 2010, 2007, 2004 Pearson Education, Inc. All Rights Reserved. Properties of Sampling Distributions of Sample Means 1. The mean of the sample means, is equal to the population mean. 2. The standard deviation of the sample means, is equal to the population standard deviation, divided by the square root of n (sample size). The standard deviation of the sampling distribution of the sample means is called the standard error of the mean. , x μ x μ = μ , x σ , σ x σ σ = n
5.
ESM 2035: Engineering
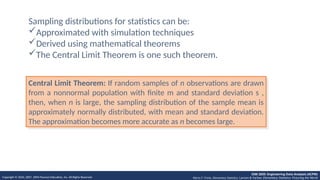
Data Analysis (ACPM) Mario F. Triola, Elementary Statistics, Larson & Farber, Elementary Statistics: Picturing the World Copyright © 2010, 2007, 2004 Pearson Education, Inc. All Rights Reserved. Sampling distributions for statistics can be: Approximated with simulation techniques Derived using mathematical theorems The Central Limit Theorem is one such theorem. Central Limit Theorem: If random samples of n observations are drawn from a nonnormal population with finite m and standard deviation s , then, when n is large, the sampling distribution of the sample mean is approximately normally distributed, with mean and standard deviation. The approximation becomes more accurate as n becomes large.
6.
ESM 2035: Engineering
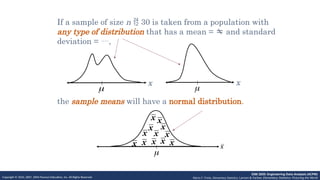
Data Analysis (ACPM) Mario F. Triola, Elementary Statistics, Larson & Farber, Elementary Statistics: Picturing the World Copyright © 2010, 2007, 2004 Pearson Education, Inc. All Rights Reserved. the sample means will have a normal distribution. If a sample of size n 30 is taken from a population with any type of distribution that has a mean = and standard deviation = , x x x x x x x x x x x x x x x
7.
ESM 2035: Engineering
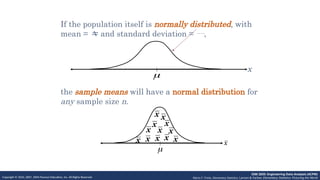
Data Analysis (ACPM) Mario F. Triola, Elementary Statistics, Larson & Farber, Elementary Statistics: Picturing the World Copyright © 2010, 2007, 2004 Pearson Education, Inc. All Rights Reserved. If the population itself is normally distributed, with mean = and standard deviation = , the sample means will have a normal distribution for any sample size n. x x x x x x x x x x x x x x
8.
ESM 2035: Engineering
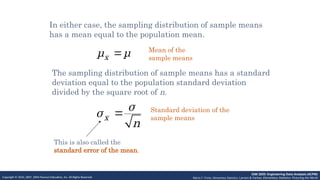
Data Analysis (ACPM) Mario F. Triola, Elementary Statistics, Larson & Farber, Elementary Statistics: Picturing the World Copyright © 2010, 2007, 2004 Pearson Education, Inc. All Rights Reserved. In either case, the sampling distribution of sample means has a mean equal to the population mean. x μ μ x σ σ n Mean of the sample means Standard deviation of the sample means The sampling distribution of sample means has a standard deviation equal to the population standard deviation divided by the square root of n. This is also called the standard error of the mean.
9.
ESM 2035: Engineering
Data Analysis (ACPM) Mario F. Triola, Elementary Statistics, Larson & Farber, Elementary Statistics: Picturing the World Copyright © 2010, 2007, 2004 Pearson Education, Inc. All Rights Reserved. Example: The heights of fully grown magnolia bushes have a mean height of 8 feet and a standard deviation of 0.7 feet. 38 bushes are randomly selected from the population, and the mean of each sample is determined. Find the mean and standard error of the mean of the sampling distribution. x μ μ Mean Standard deviation (standard error) x σ σ n = 8 0.7 = 38 = 0.11
10.
ESM 2035: Engineering
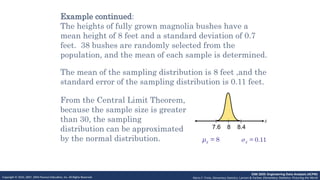
Data Analysis (ACPM) Mario F. Triola, Elementary Statistics, Larson & Farber, Elementary Statistics: Picturing the World Copyright © 2010, 2007, 2004 Pearson Education, Inc. All Rights Reserved. Example continued: The heights of fully grown magnolia bushes have a mean height of 8 feet and a standard deviation of 0.7 feet. 38 bushes are randomly selected from the population, and the mean of each sample is determined. From the Central Limit Theorem, because the sample size is greater than 30, the sampling distribution can be approximated by the normal distribution. The mean of the sampling distribution is 8 feet ,and the standard error of the sampling distribution is 0.11 feet. x 8 8.4 7.6 = 8 x μ = 0.11 x σ
11.
ESM 2035: Engineering
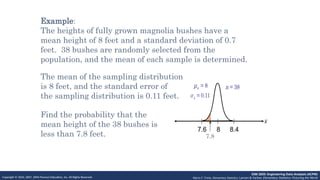
Data Analysis (ACPM) Mario F. Triola, Elementary Statistics, Larson & Farber, Elementary Statistics: Picturing the World Copyright © 2010, 2007, 2004 Pearson Education, Inc. All Rights Reserved. Example: The heights of fully grown magnolia bushes have a mean height of 8 feet and a standard deviation of 0.7 feet. 38 bushes are randomly selected from the population, and the mean of each sample is determined. Find the probability that the mean height of the 38 bushes is less than 7.8 feet. The mean of the sampling distribution is 8 feet, and the standard error of the sampling distribution is 0.11 feet. 7.8 x 8.4 7.6 8 = 8 x μ = 0.11 x σ = 38 n
12.
ESM 2035: Engineering
Data Analysis (ACPM) Mario F. Triola, Elementary Statistics, Larson & Farber, Elementary Statistics: Picturing the World Copyright © 2010, 2007, 2004 Pearson Education, Inc. All Rights Reserved. Example: An education finance corporation claims that the average credit card debts carried by undergraduates are normally distributed, with a mean of $3173 and a standard deviation of $1120. a. What is the probability that a randomly selected undergraduate, who is a credit card holder, has a credit card balance less than $2700? b. You randomly select 25 undergraduates who are credit card holders. What is the probability that their mean credit card balance is less than $2700?
Editor's Notes
#16
0.0344
#17
0.3372 0.0174
Download