Downloaded 563 times


![Color Difference
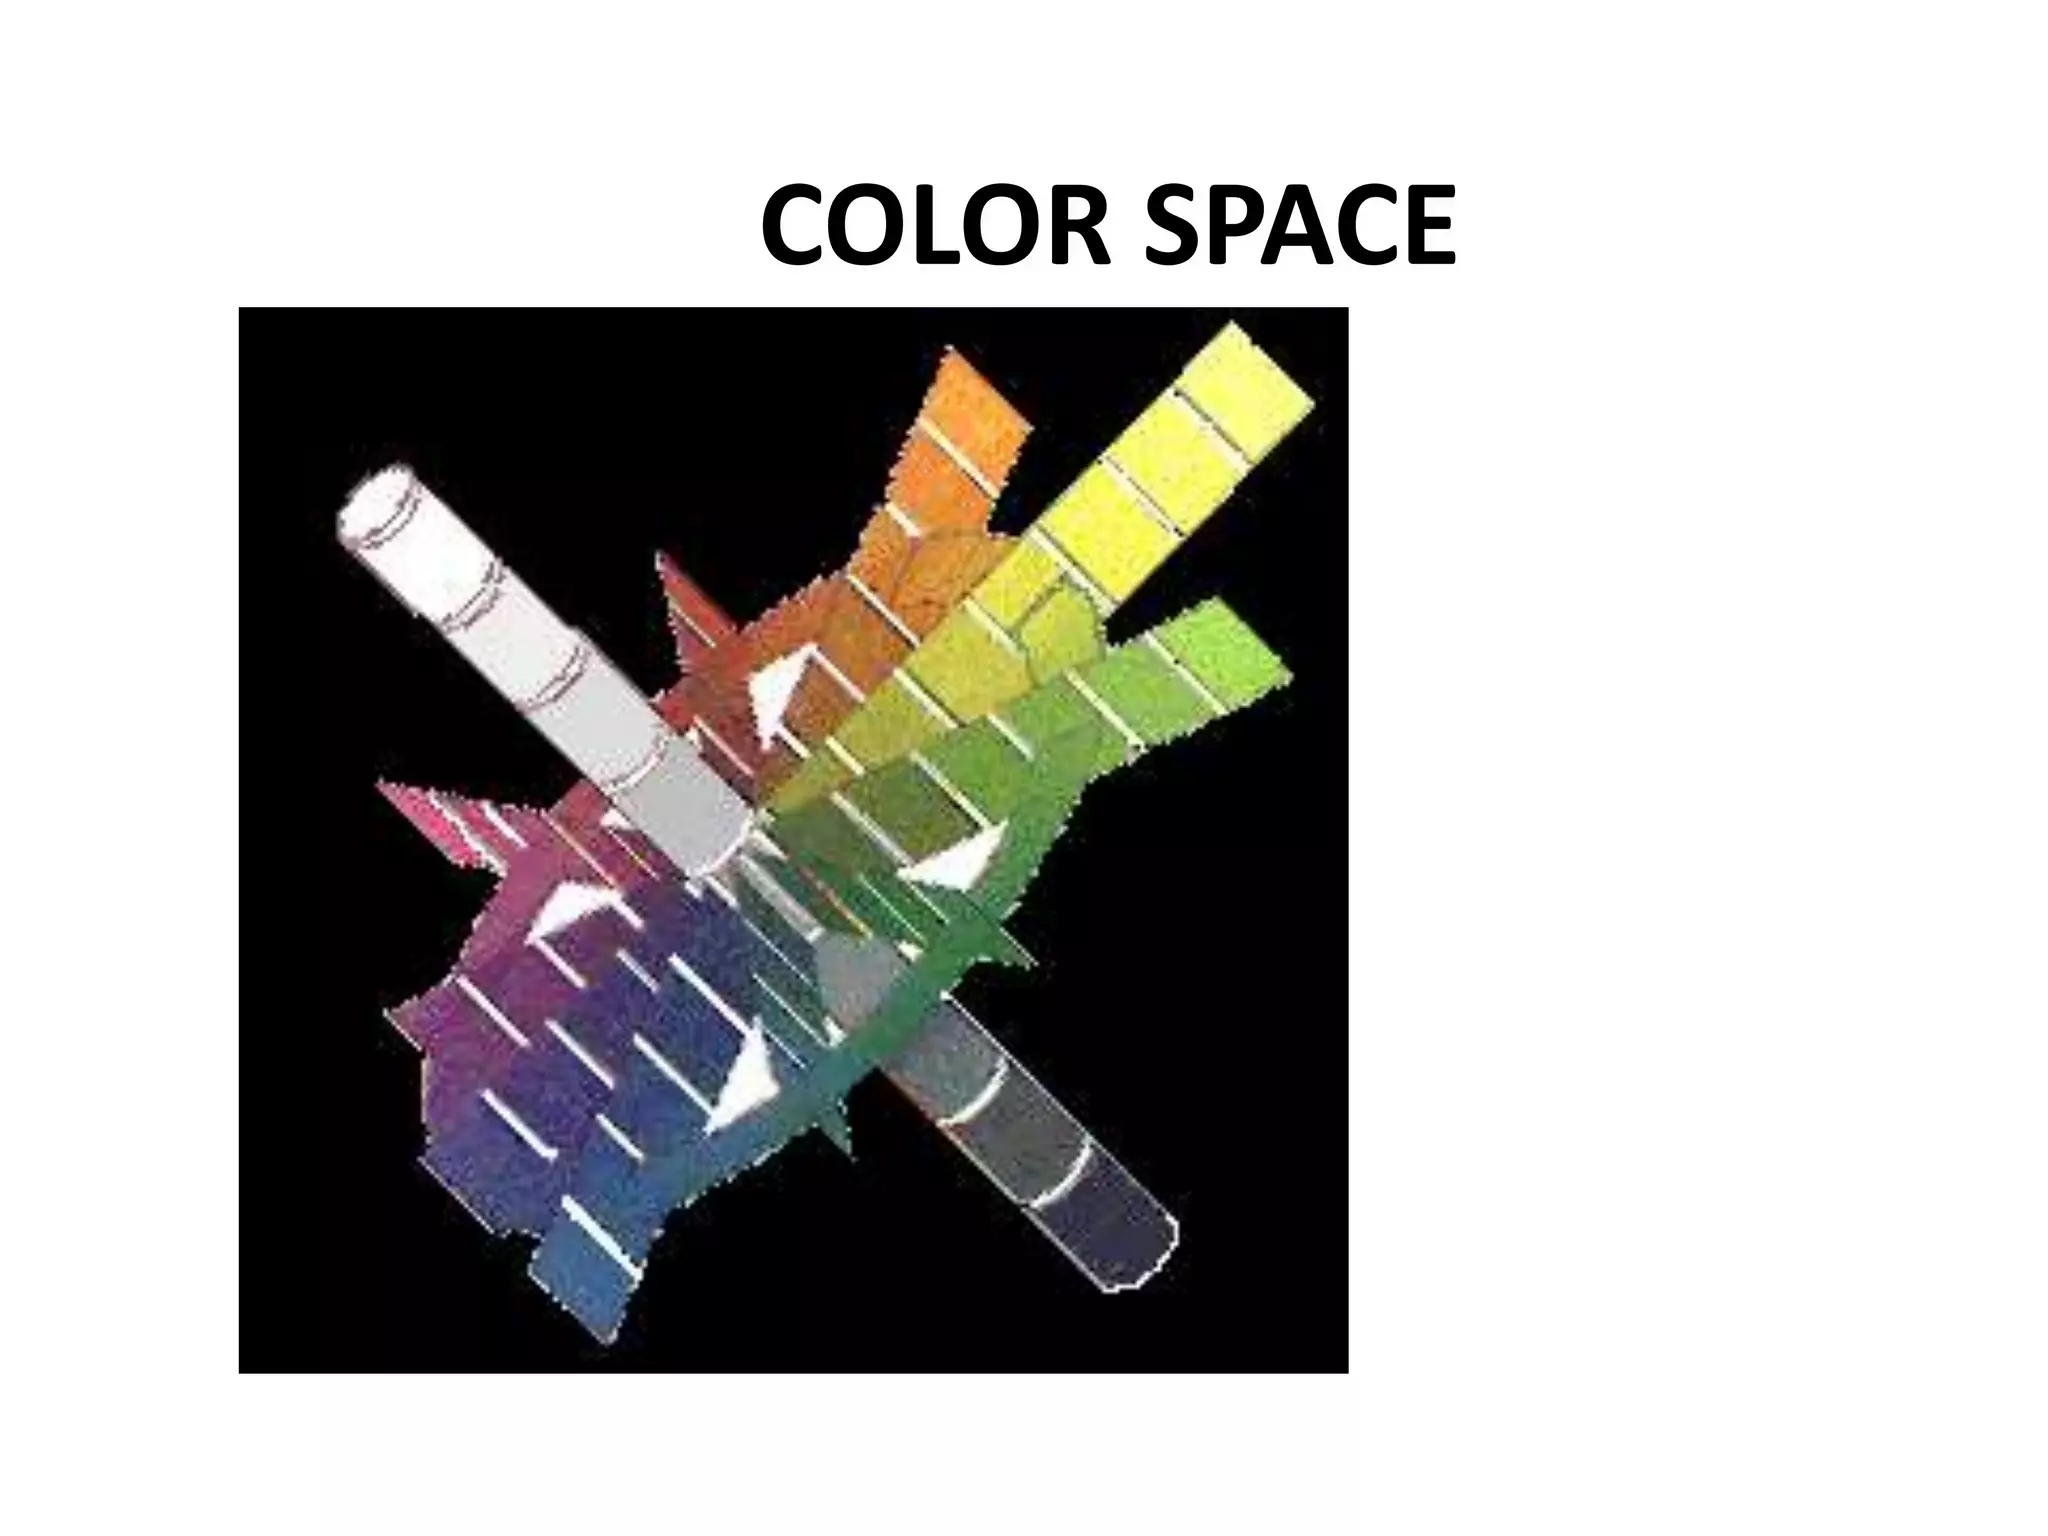
If we draw the line from
intersection of “a” and ”b”
axis to the point represent
the sample, longer the line
is higher the chroma in color.
Chroma difference is referred by
DC*, if DC* is positive a batch has
a higher chroma (stronger); if
negative DC* a batch is weaker
than Std.
As Hue difference is an angular difference, it is not in
CIELAB unit and therefore the preferred component, so
DH* can be calculate by DH*=[(DE)2
-(DL*)2
-(DC*)2
]1/2](https://image.slidesharecdn.com/textilecoloration-140802092025-phpapp02/75/Textile-coloration-43-2048.jpg)
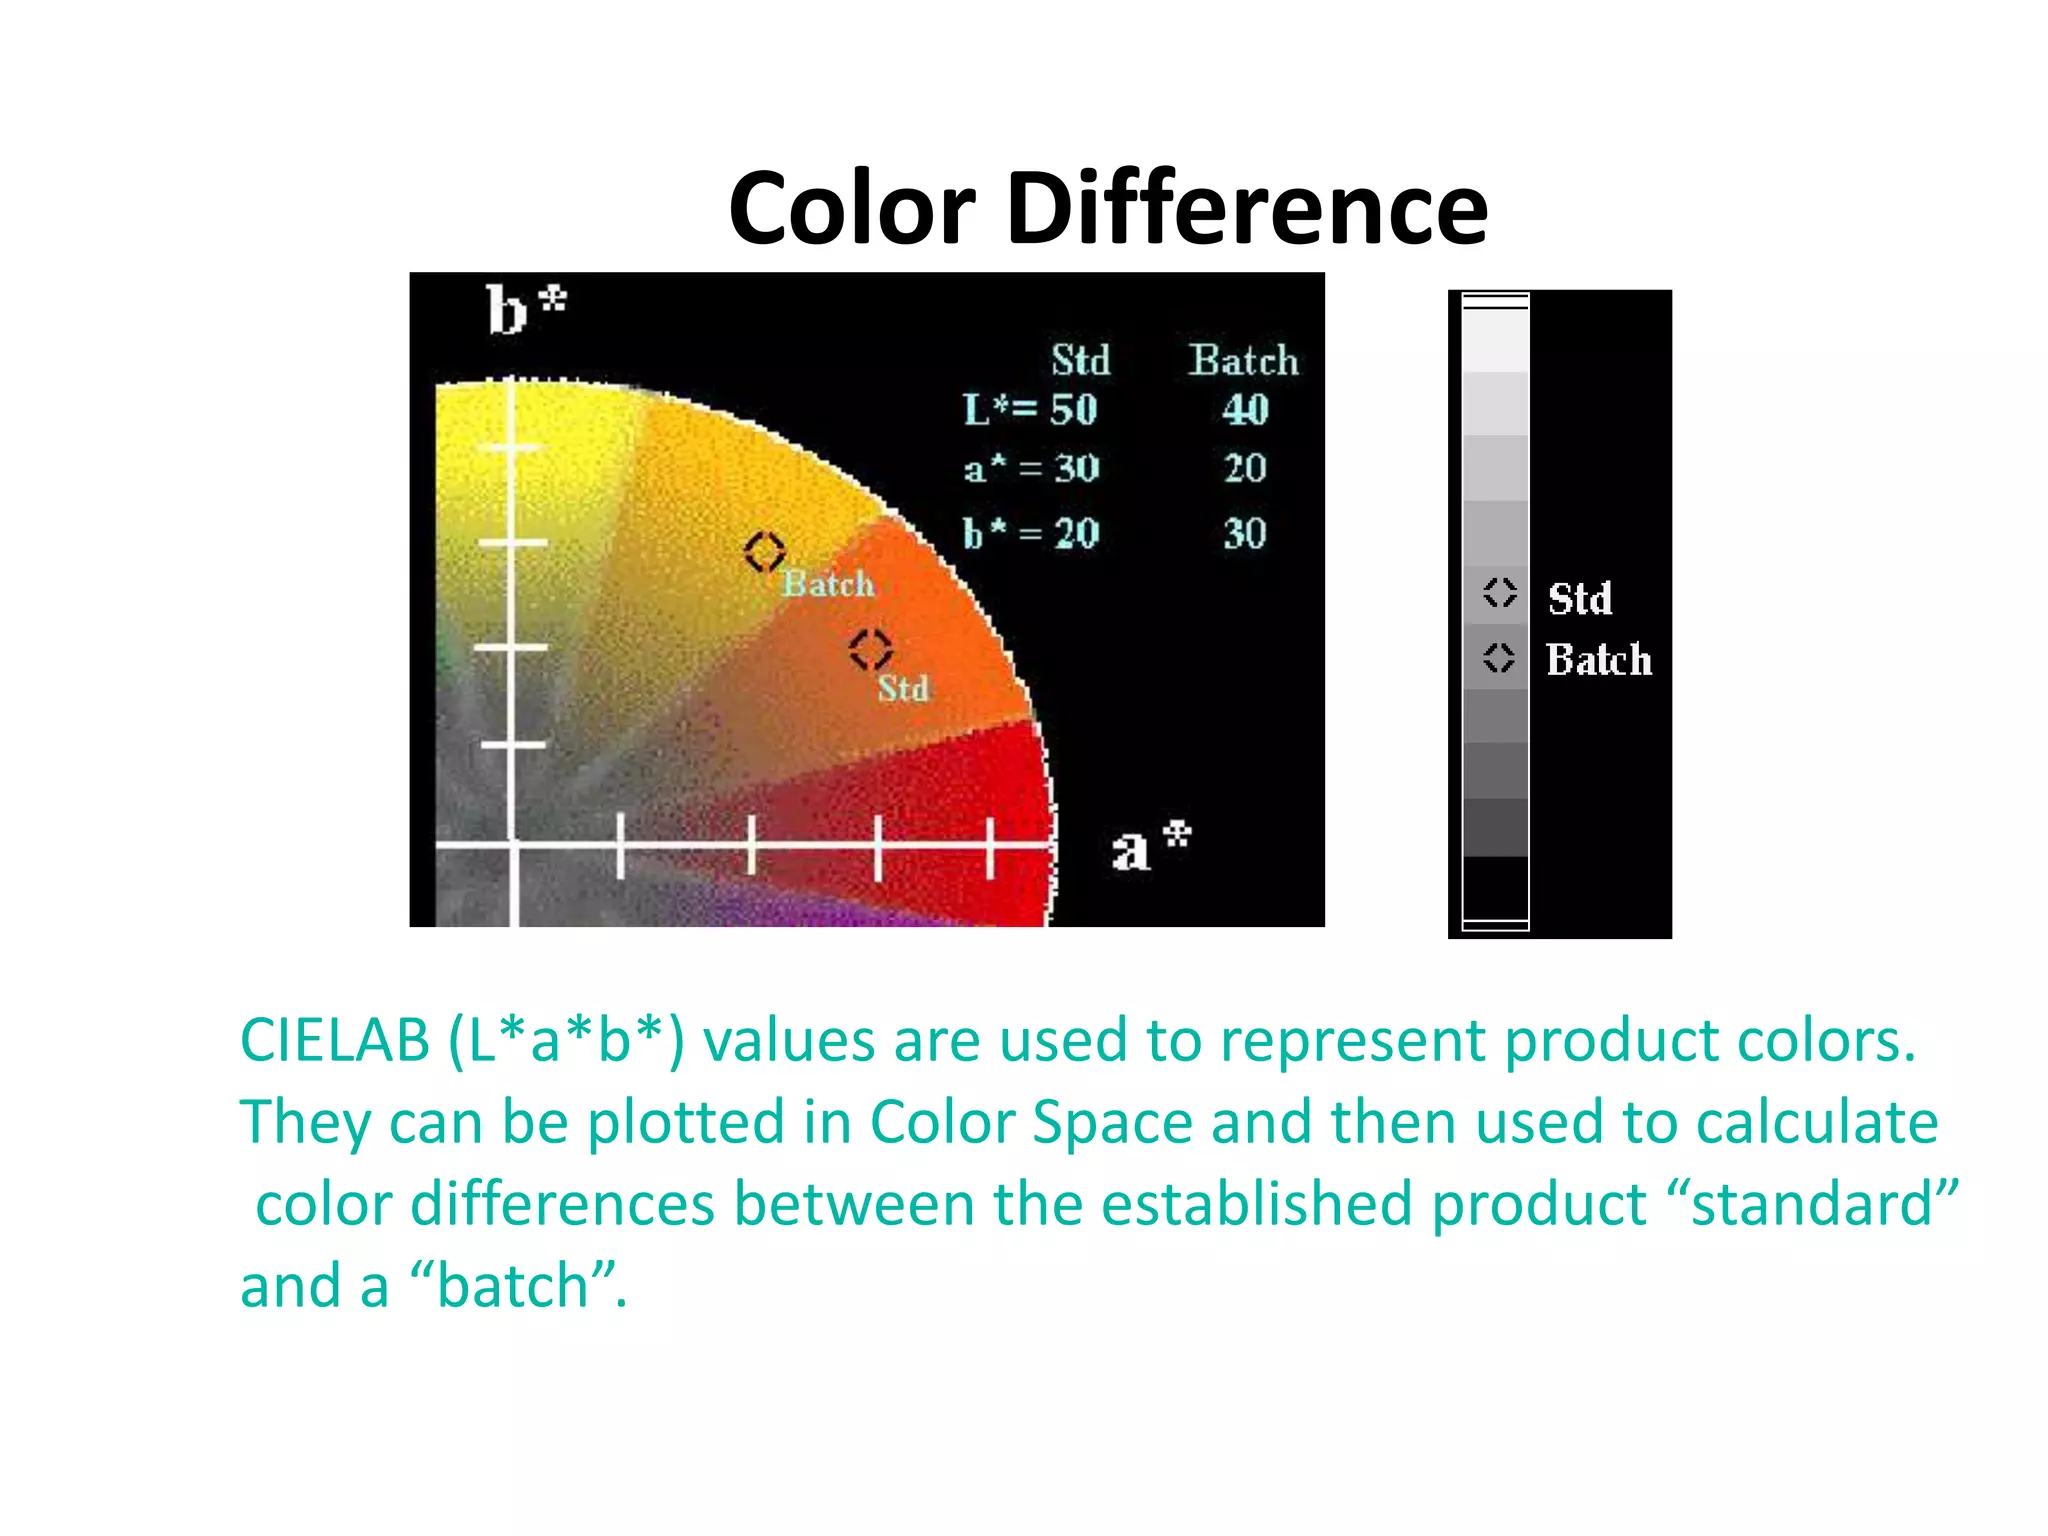
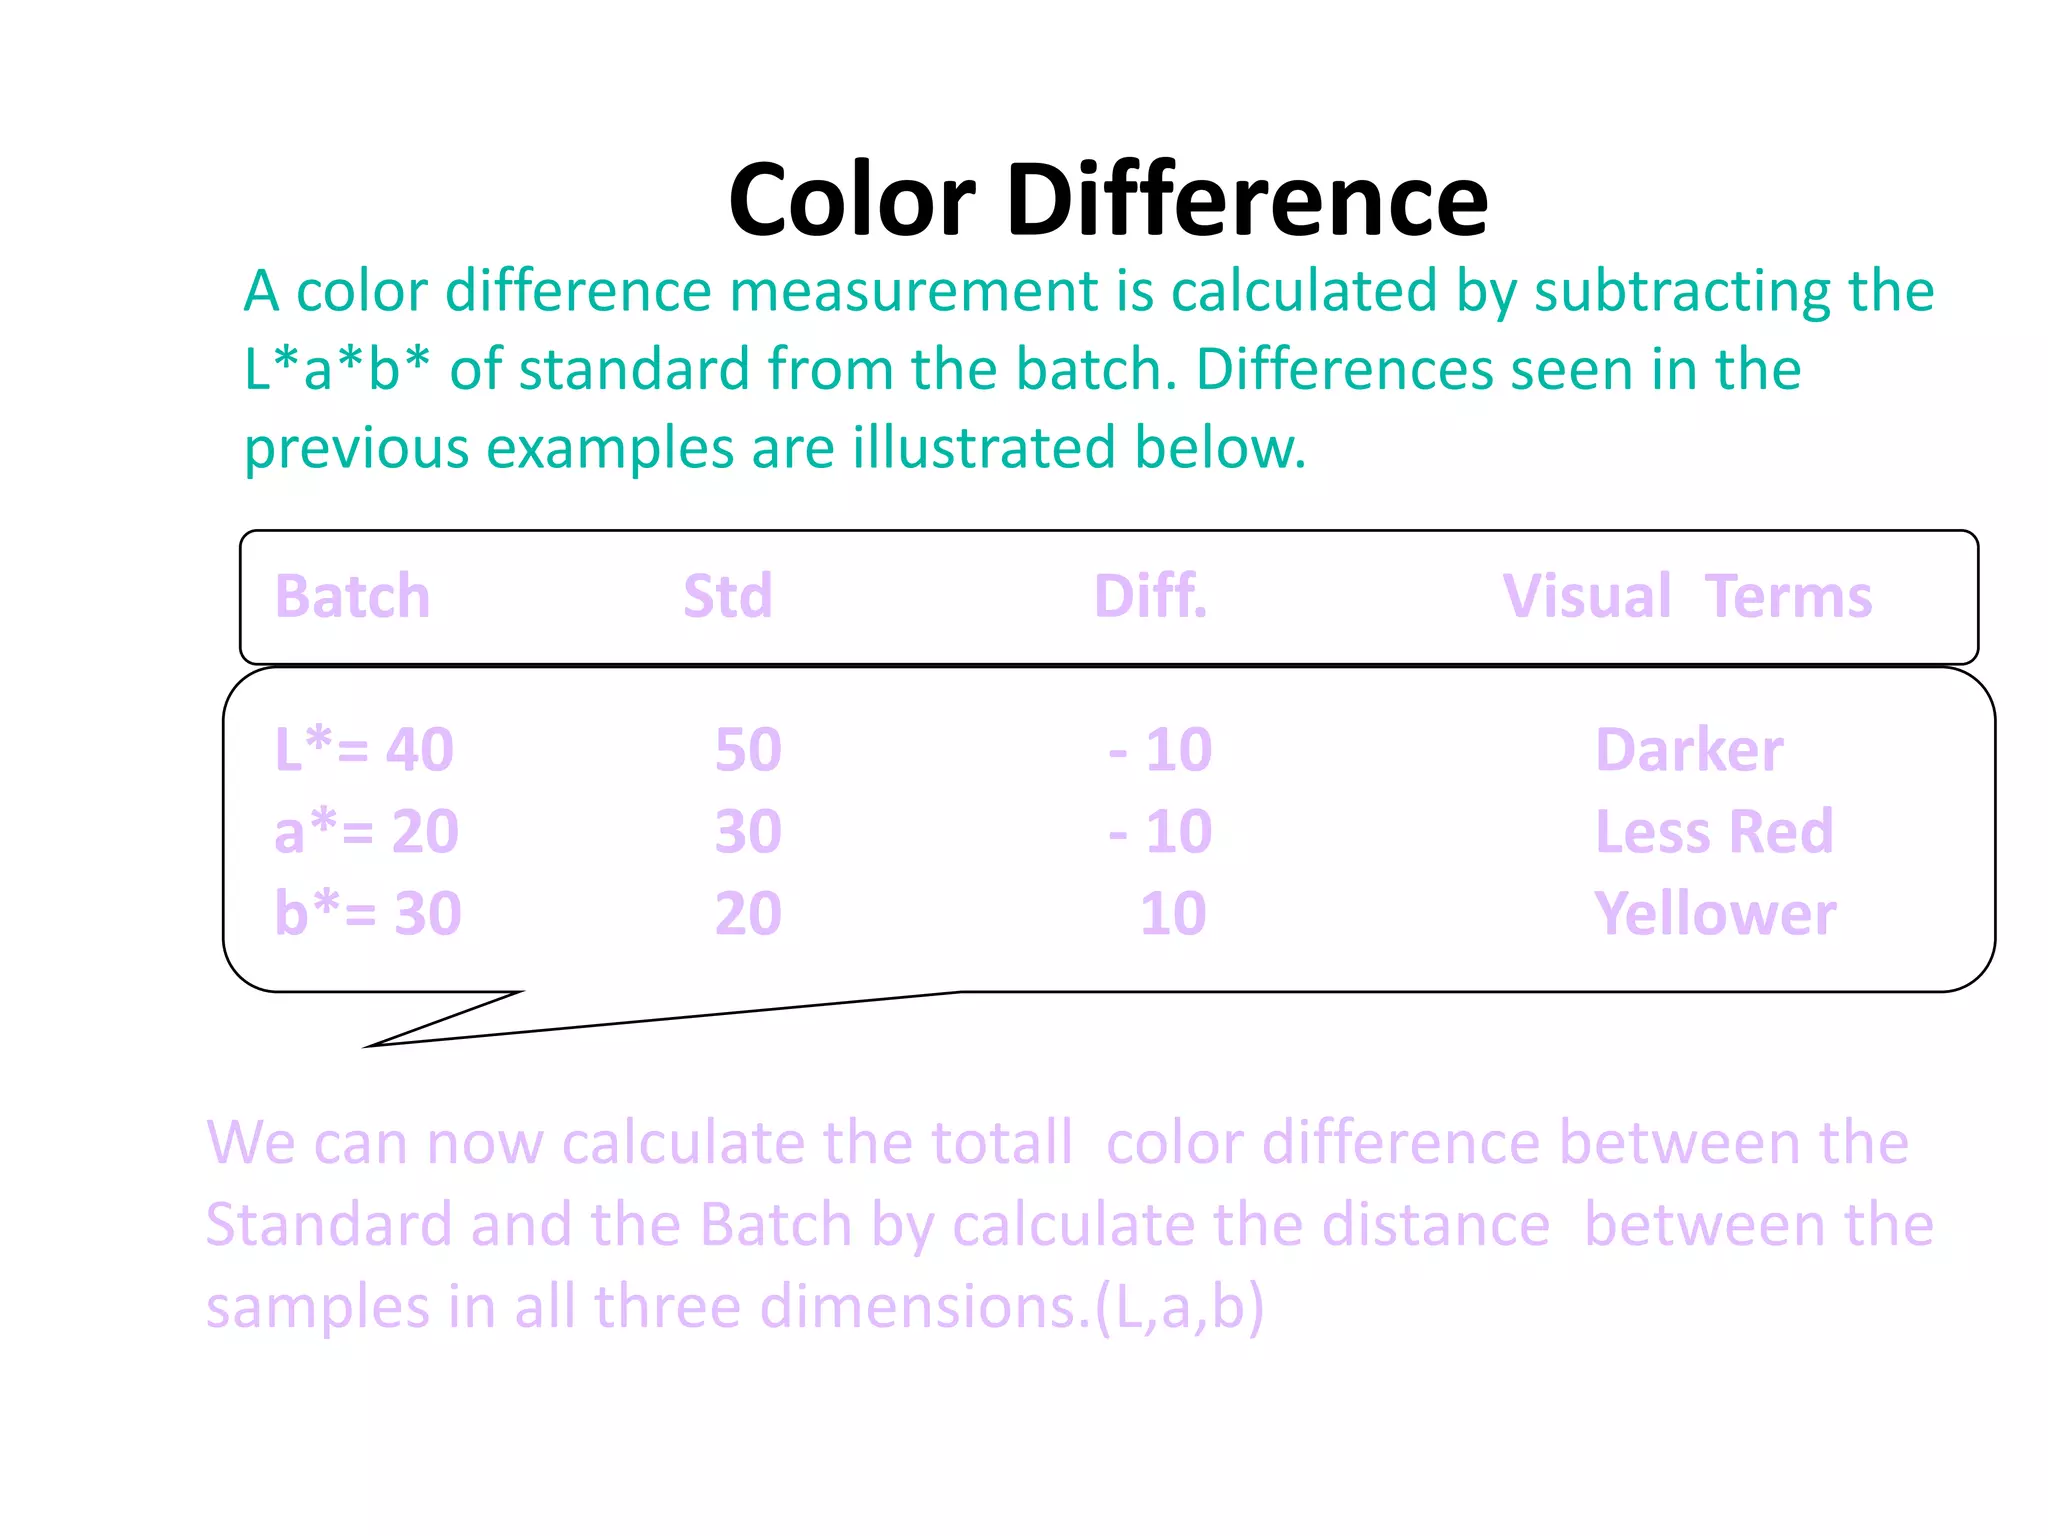
![Total Color Difference
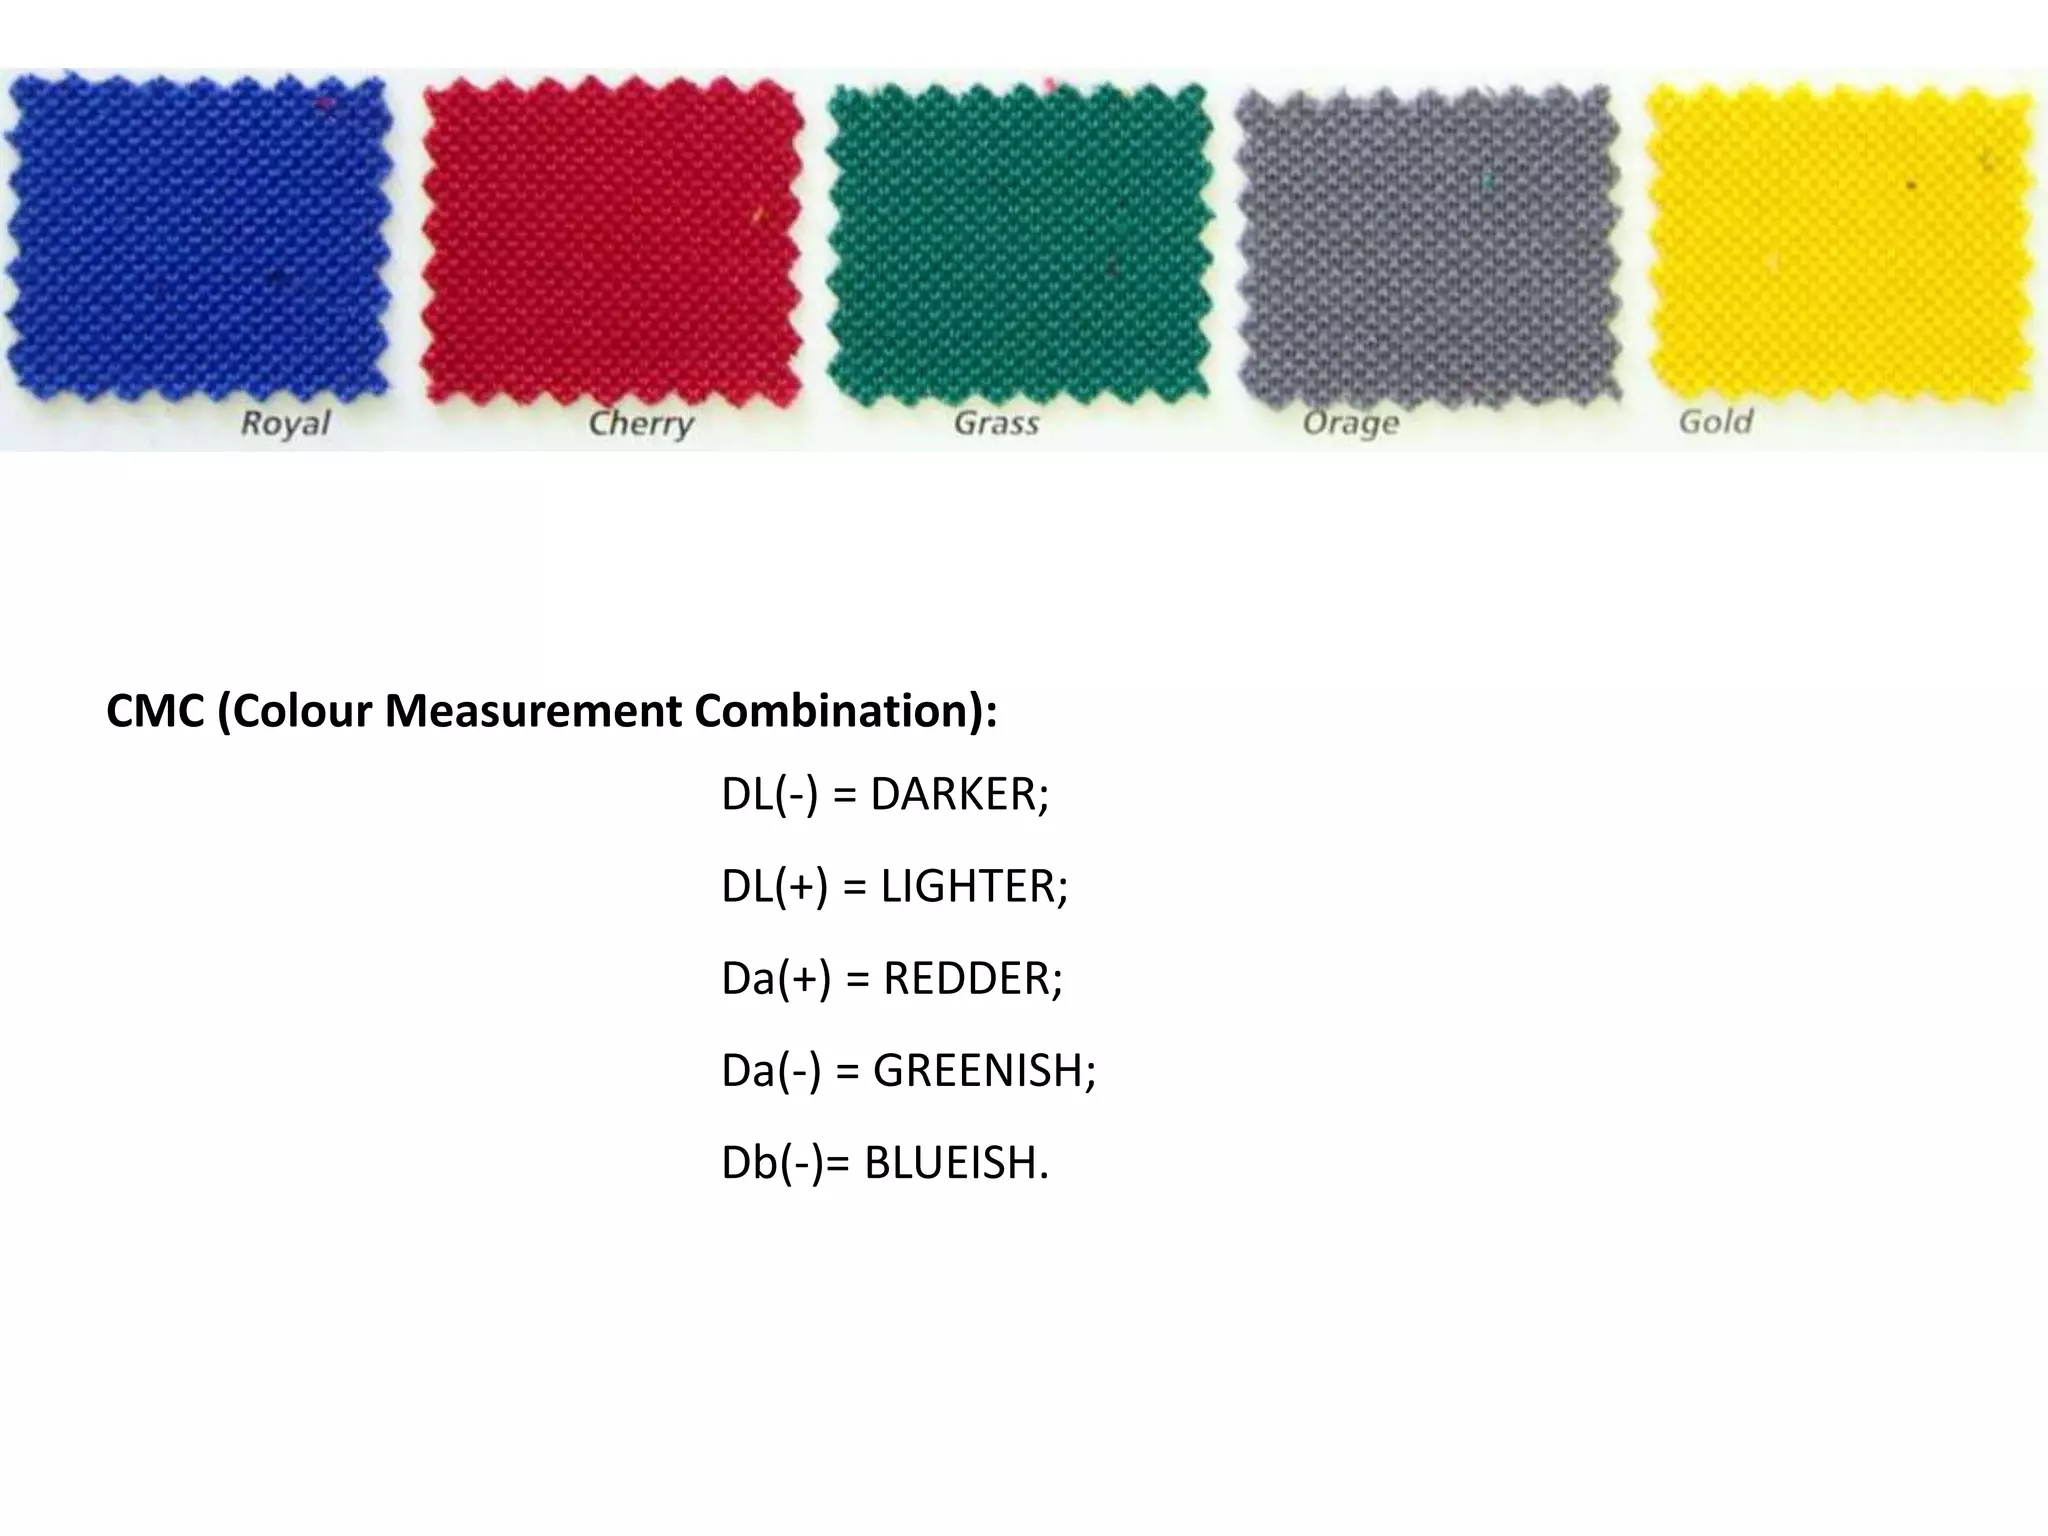
A color difference equation using DL*, Da* and Db* to
calculate the Total Color Difference between Std and the
Batch. This Total Color Difference is called delta E and it
represented by symbol DE*. DE* can be calculated using
this equation;
DE* = [(DL*)2 + (Da*)2 + (Db*)2 ]1/2
With reservation it can be said that color difference DE* >1](https://image.slidesharecdn.com/textilecoloration-140802092025-phpapp02/75/Textile-coloration-44-2048.jpg)
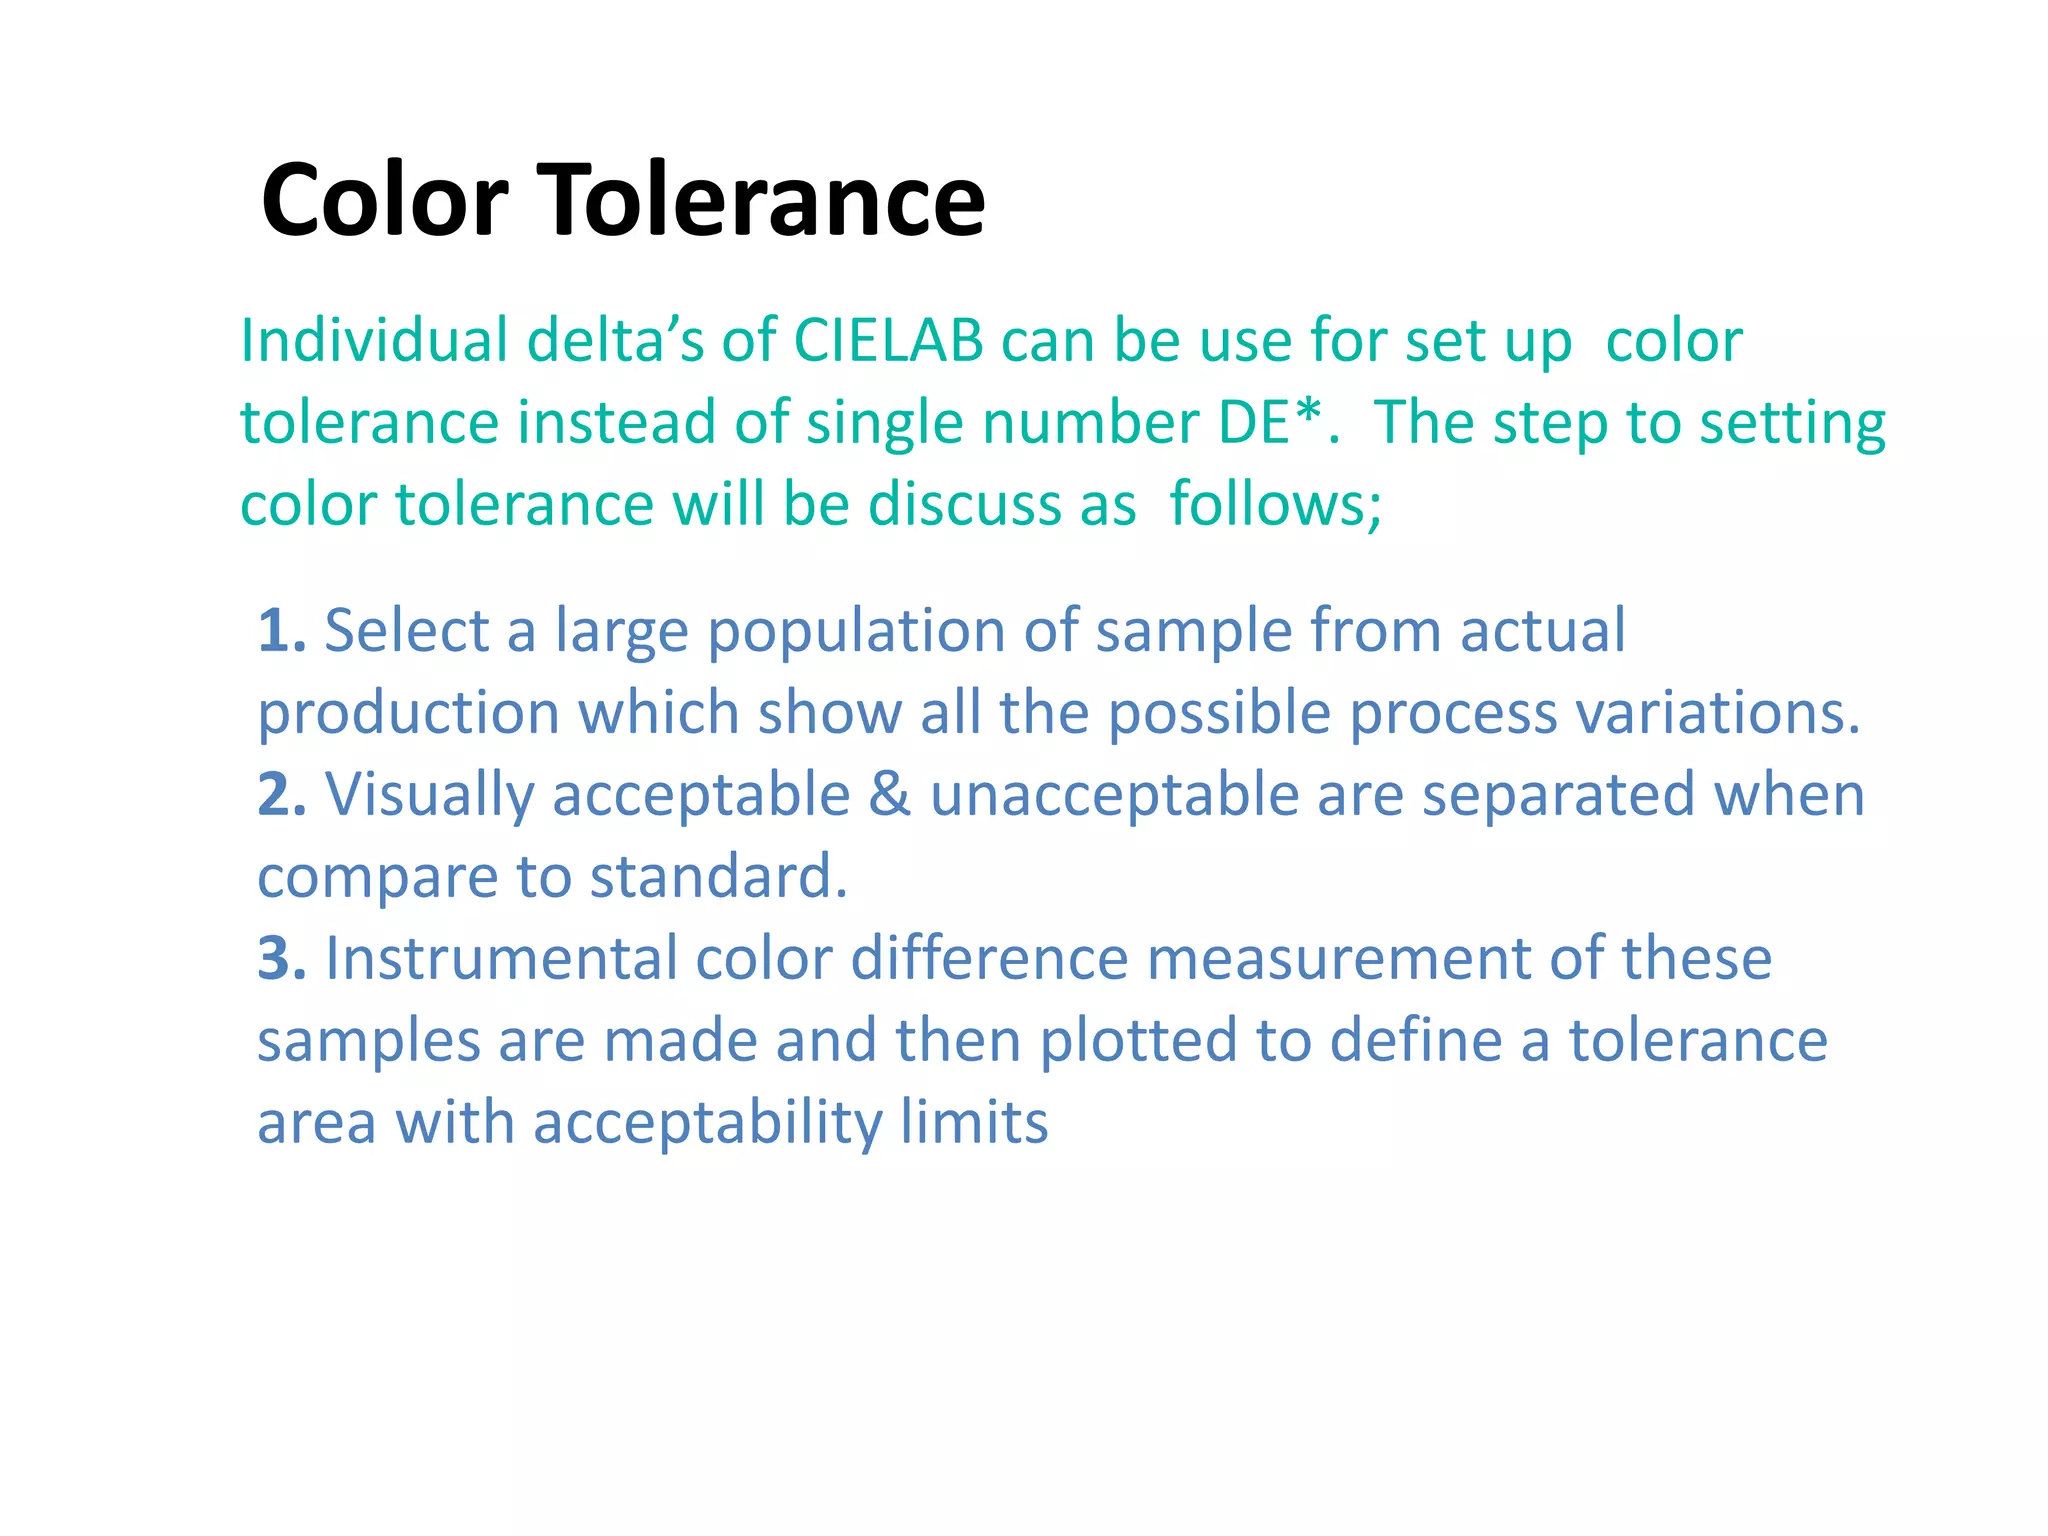
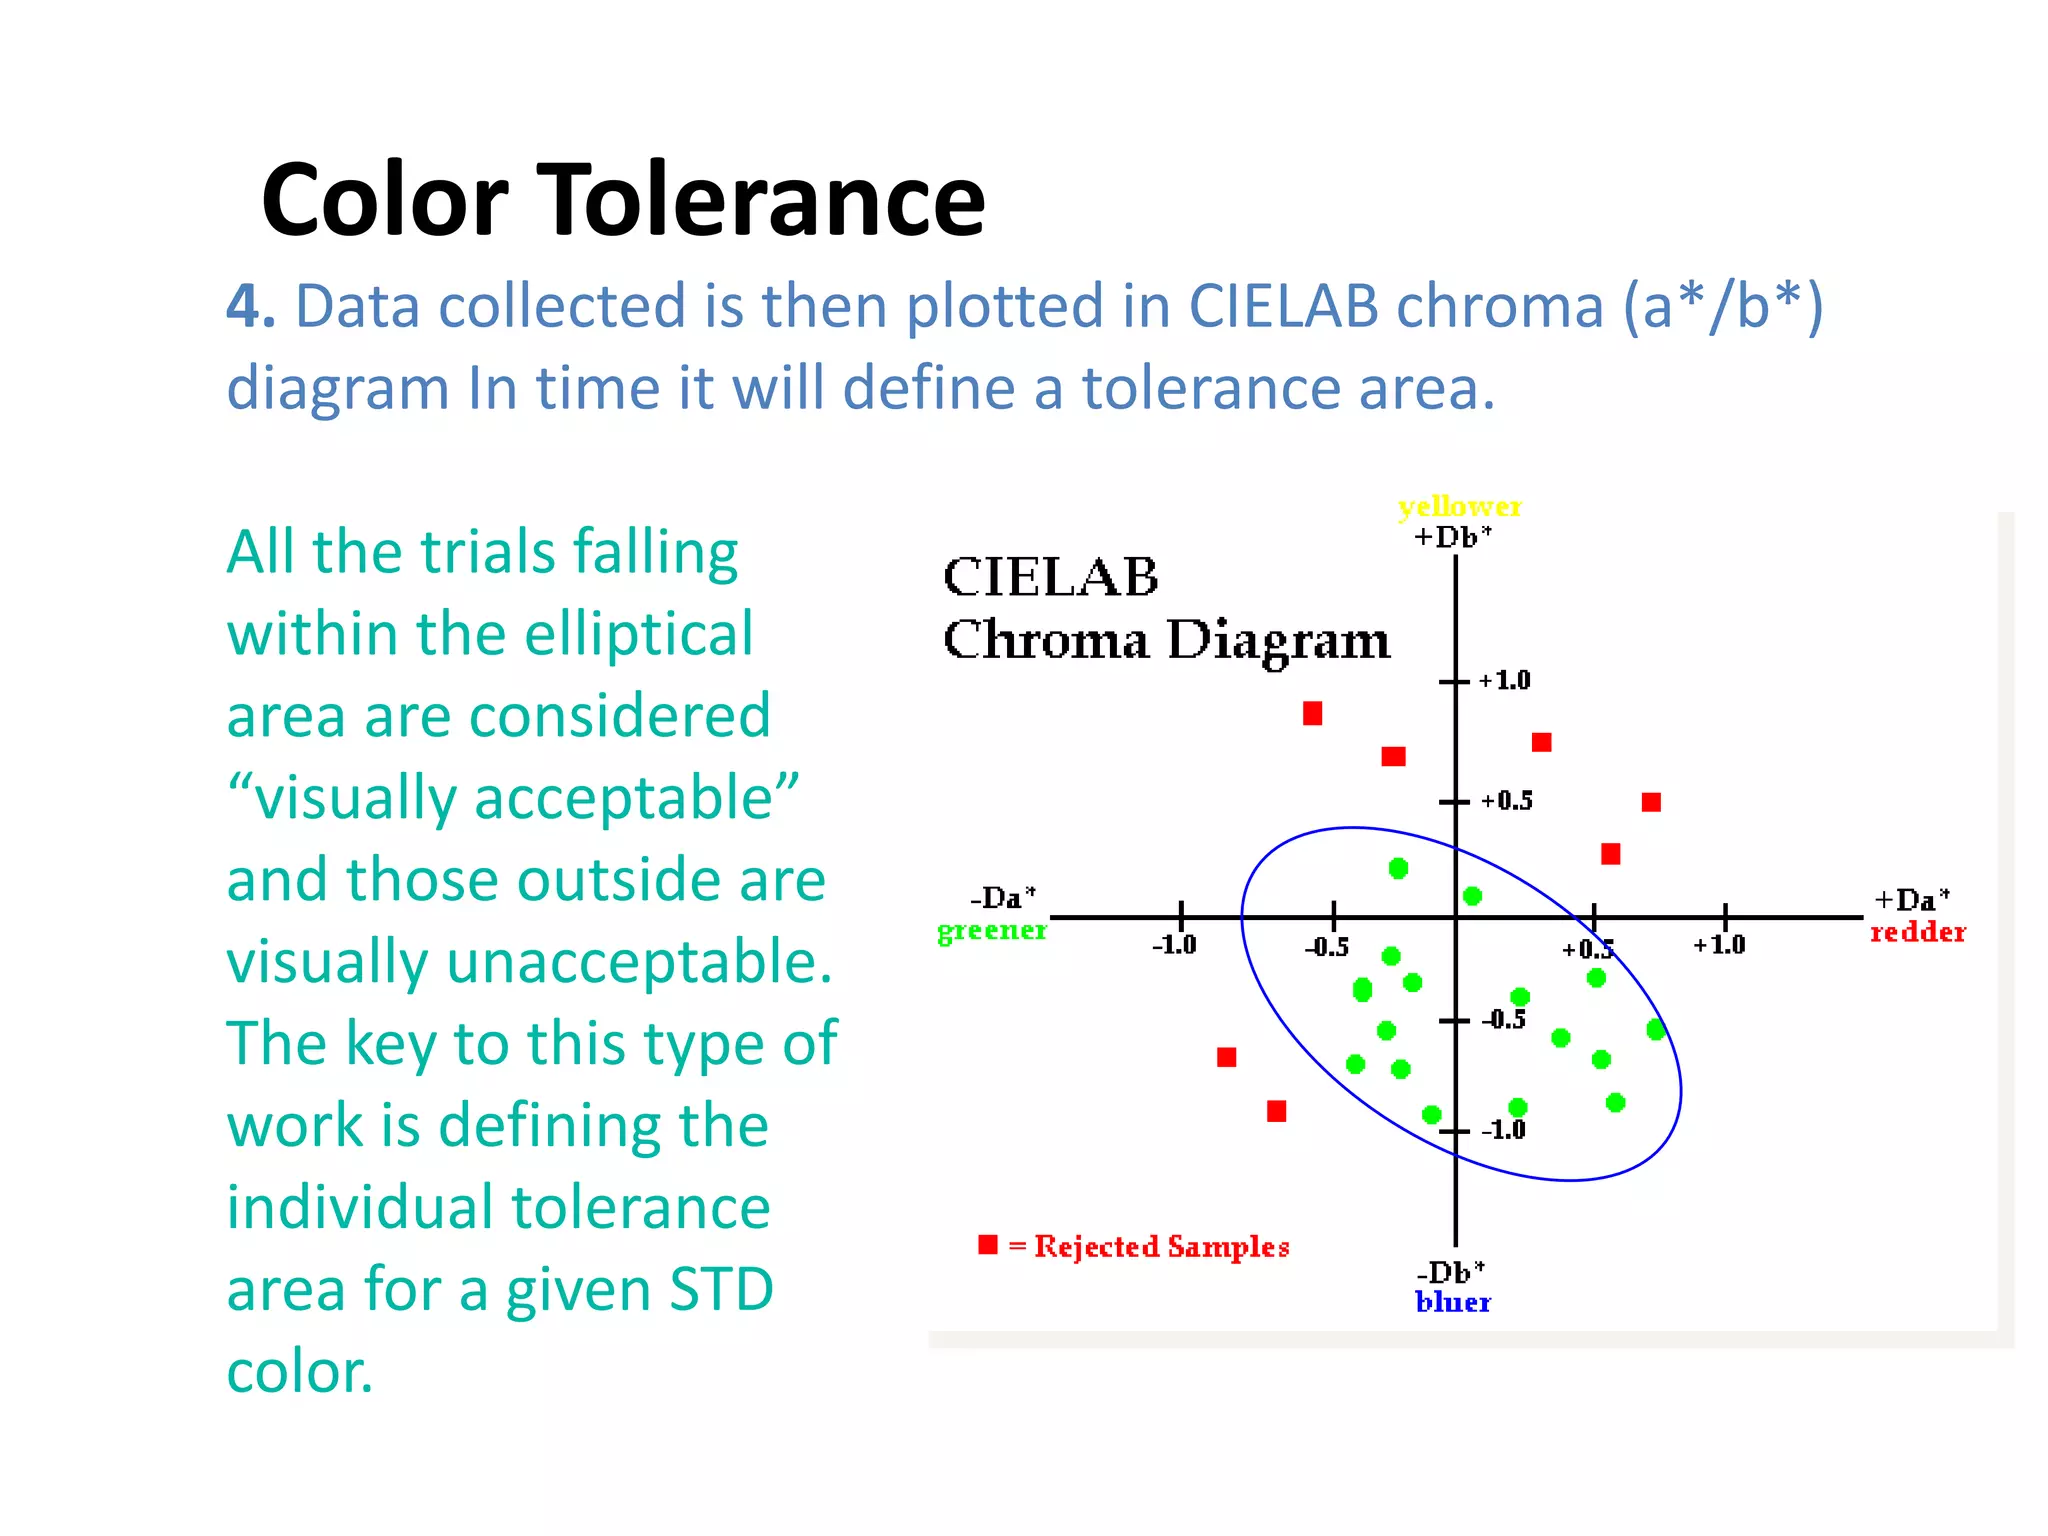
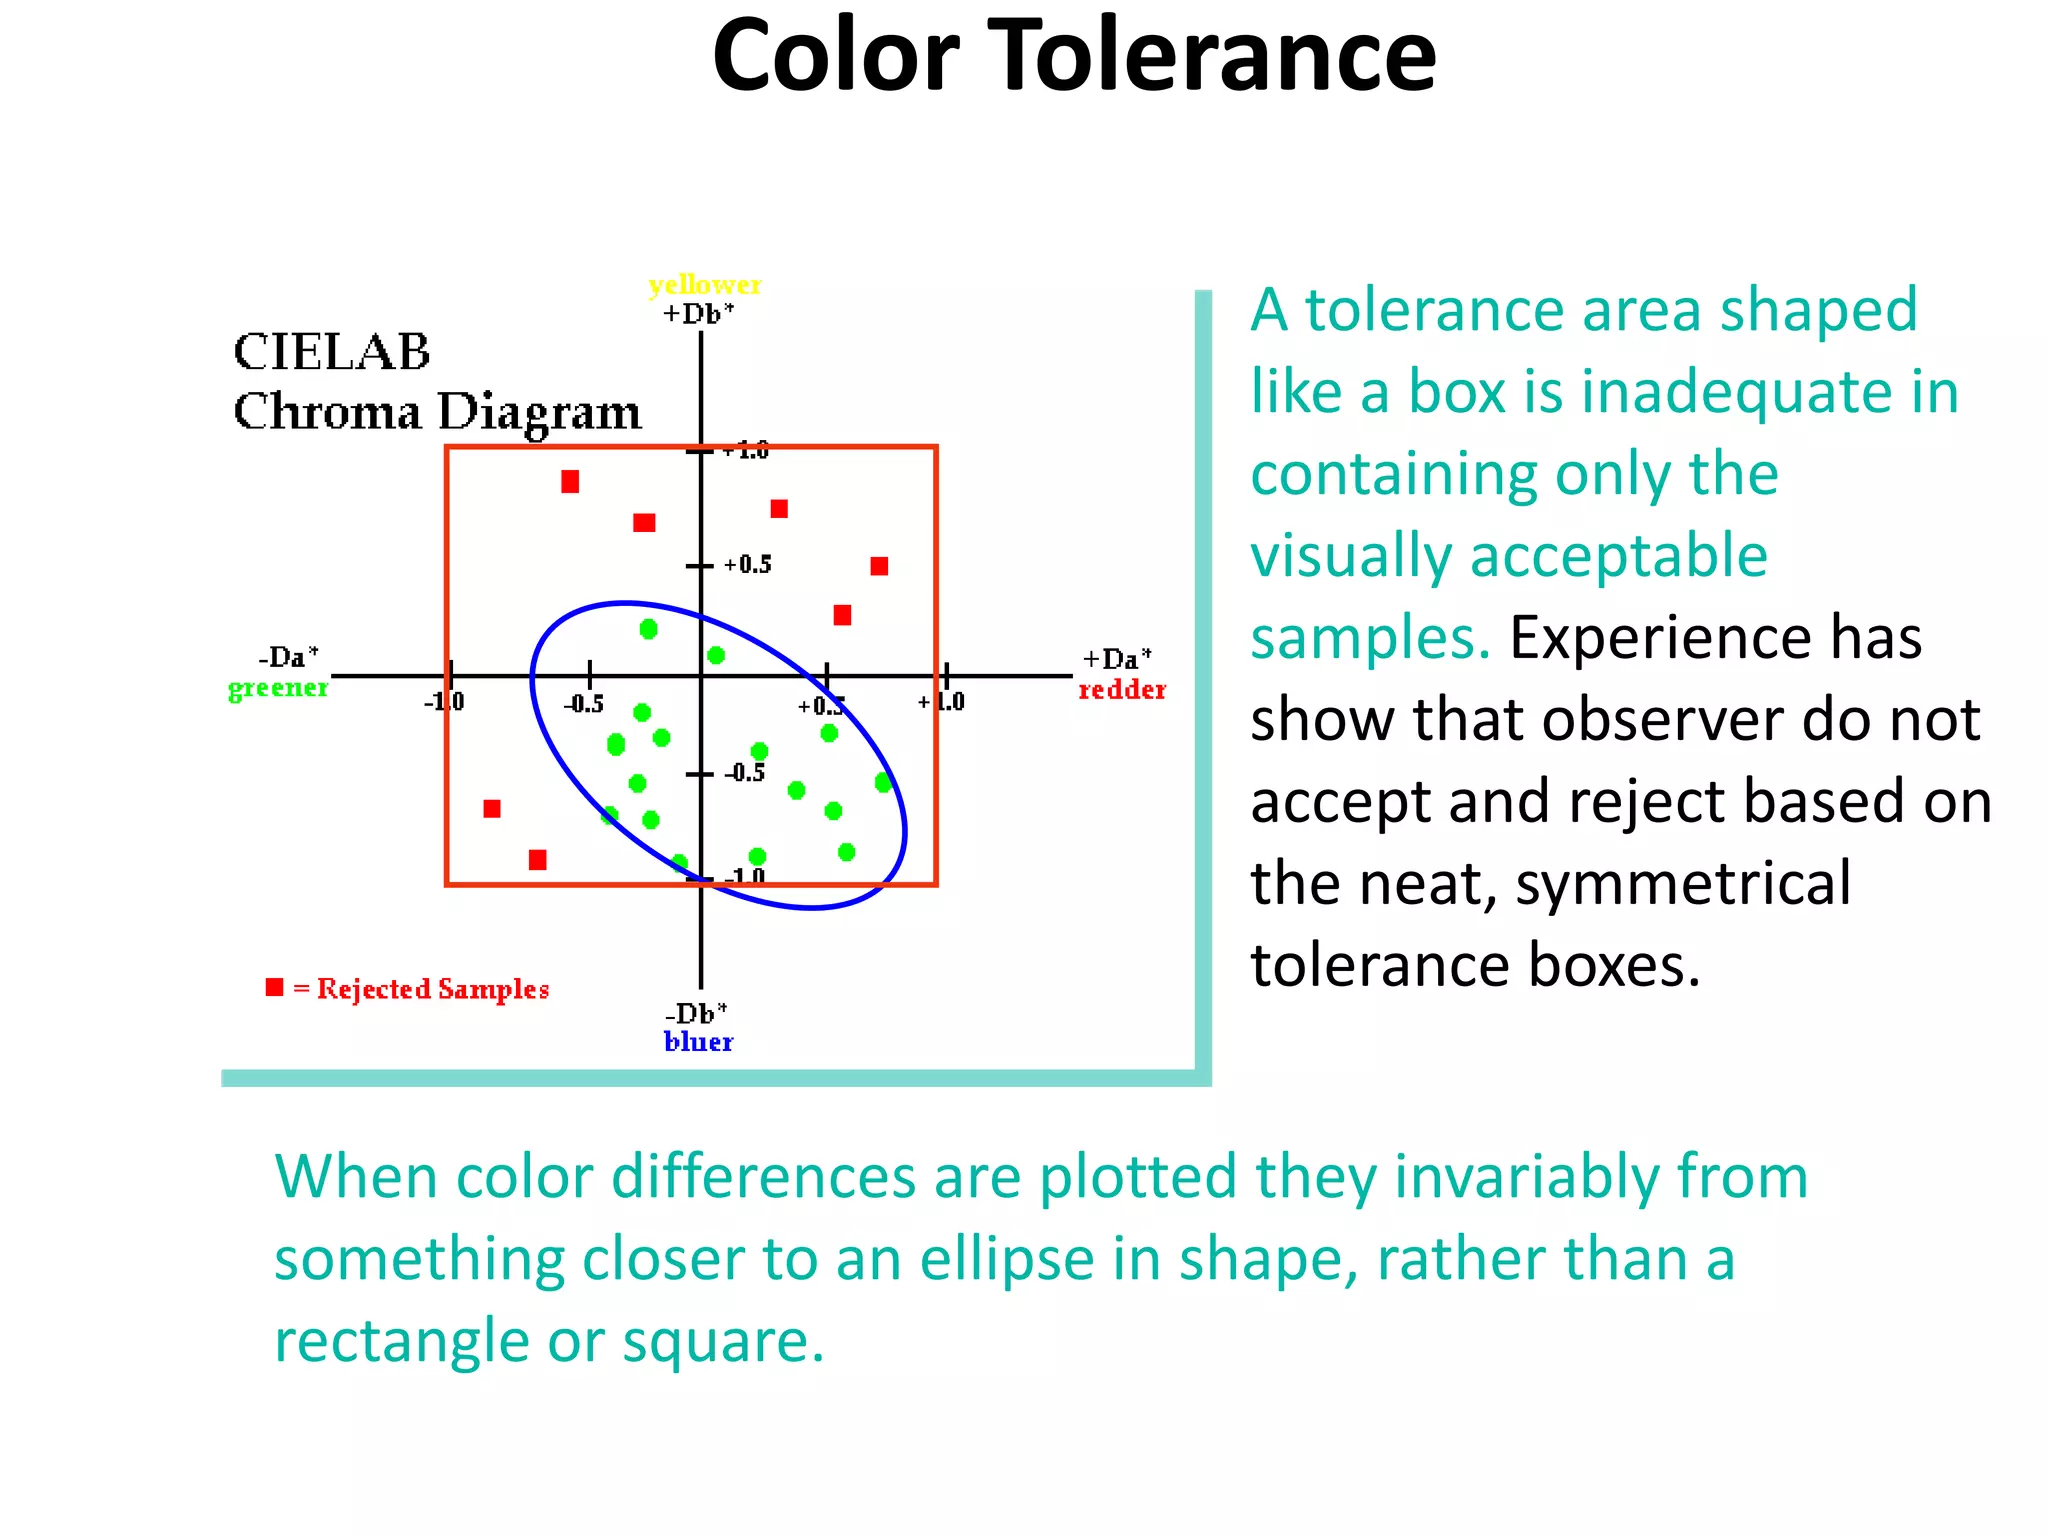

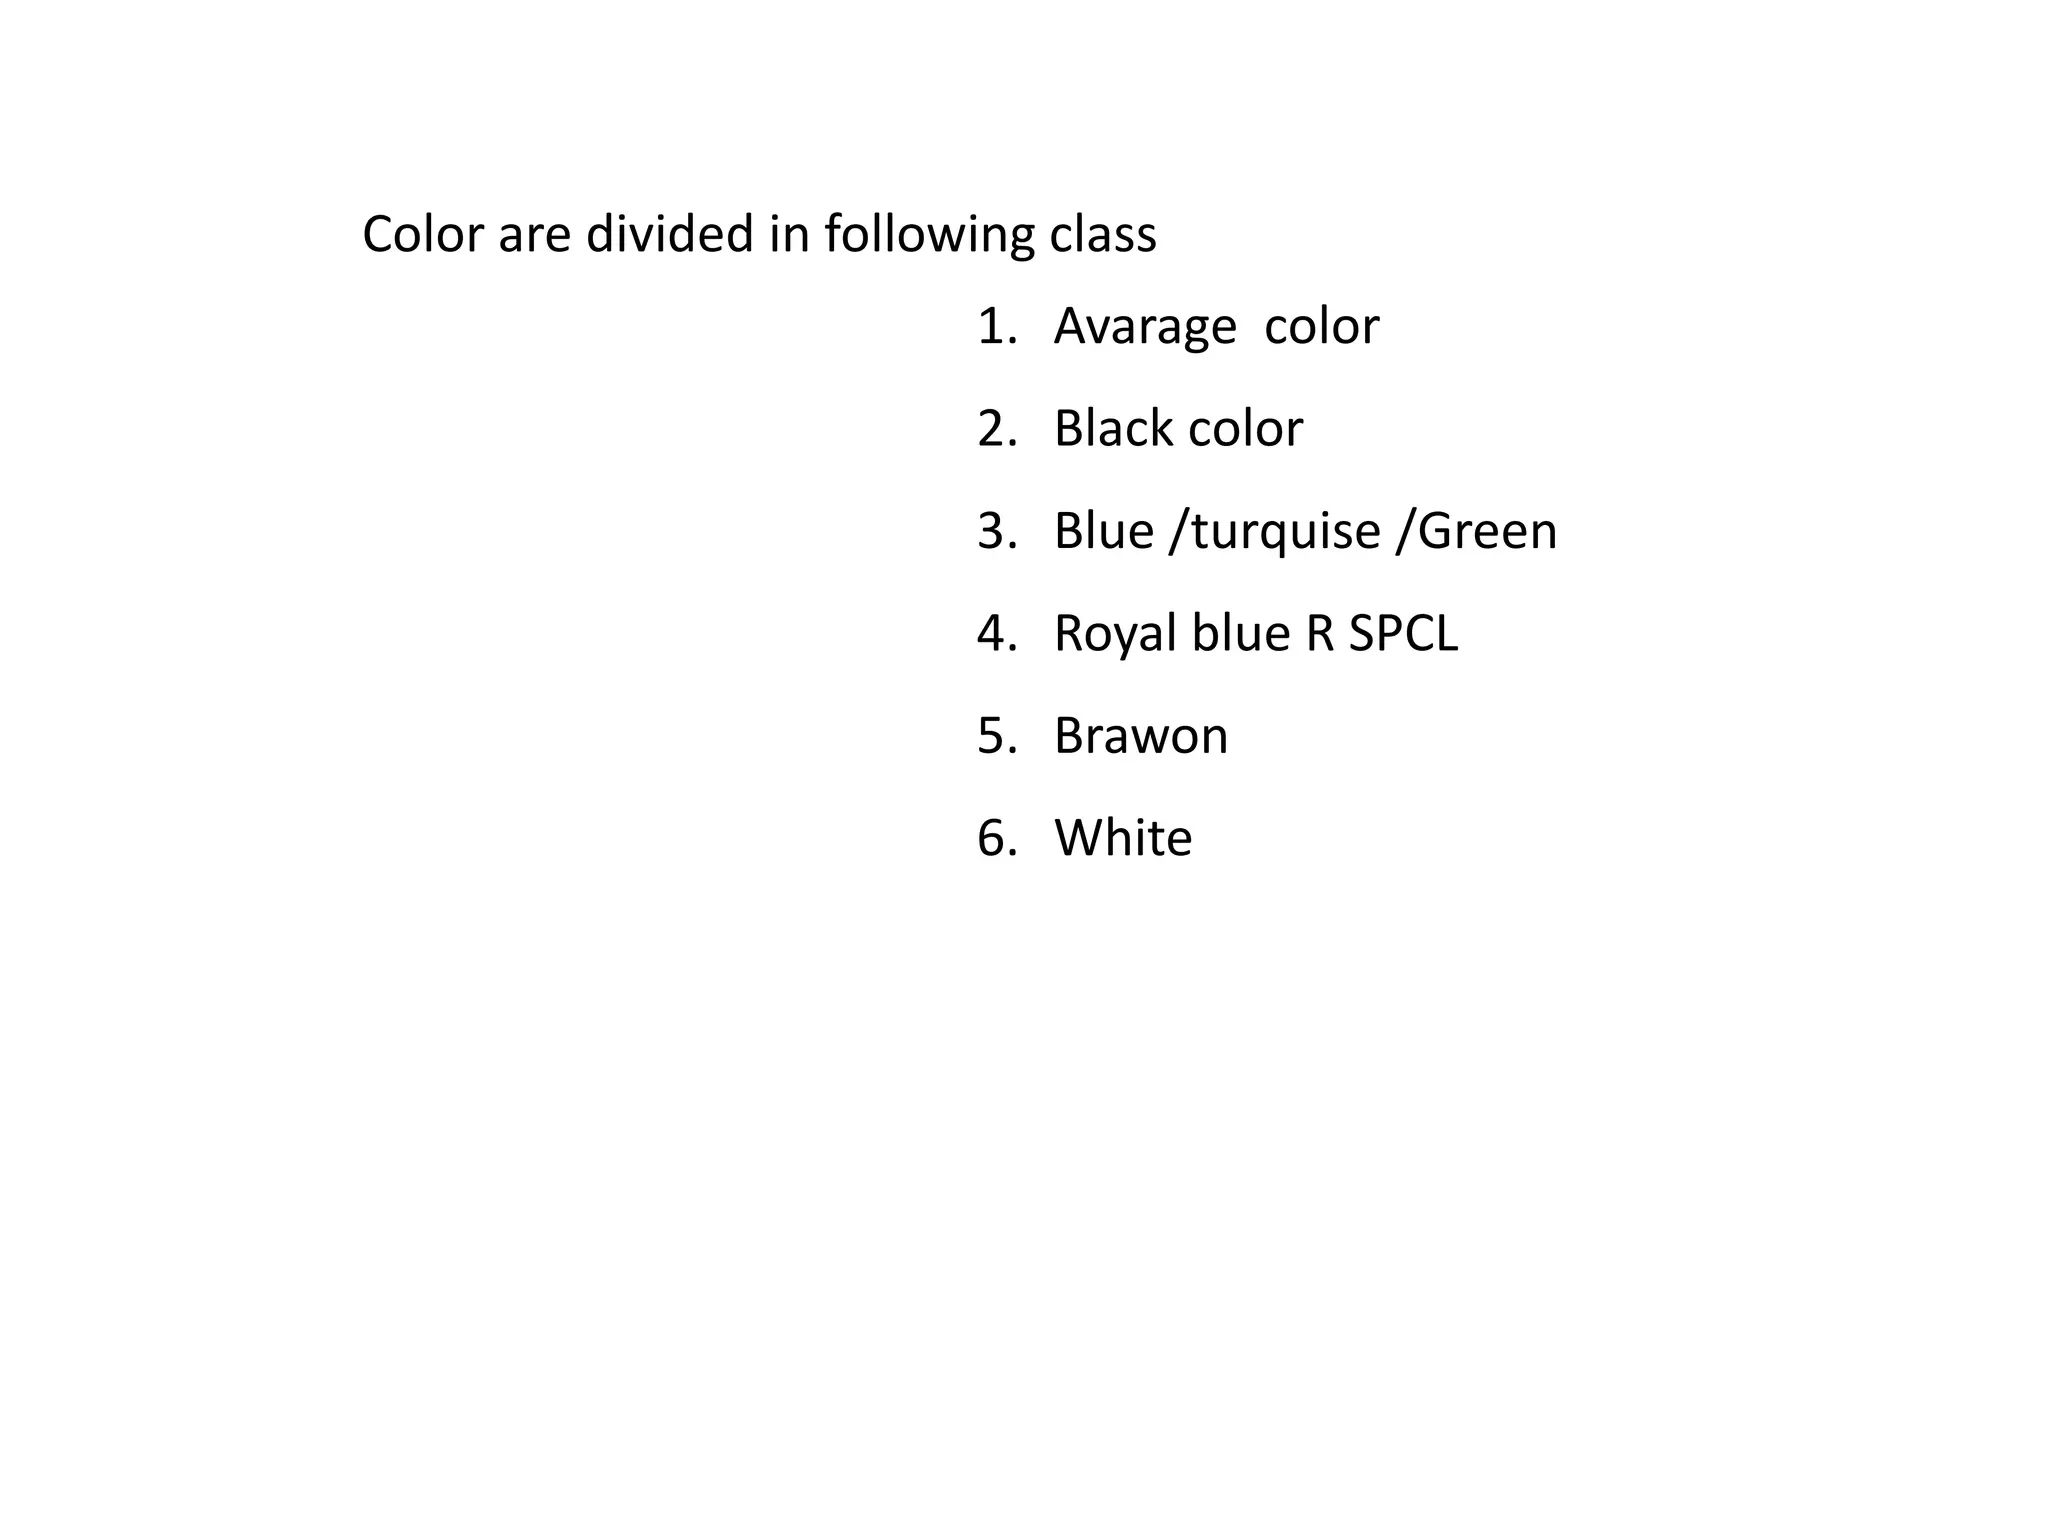
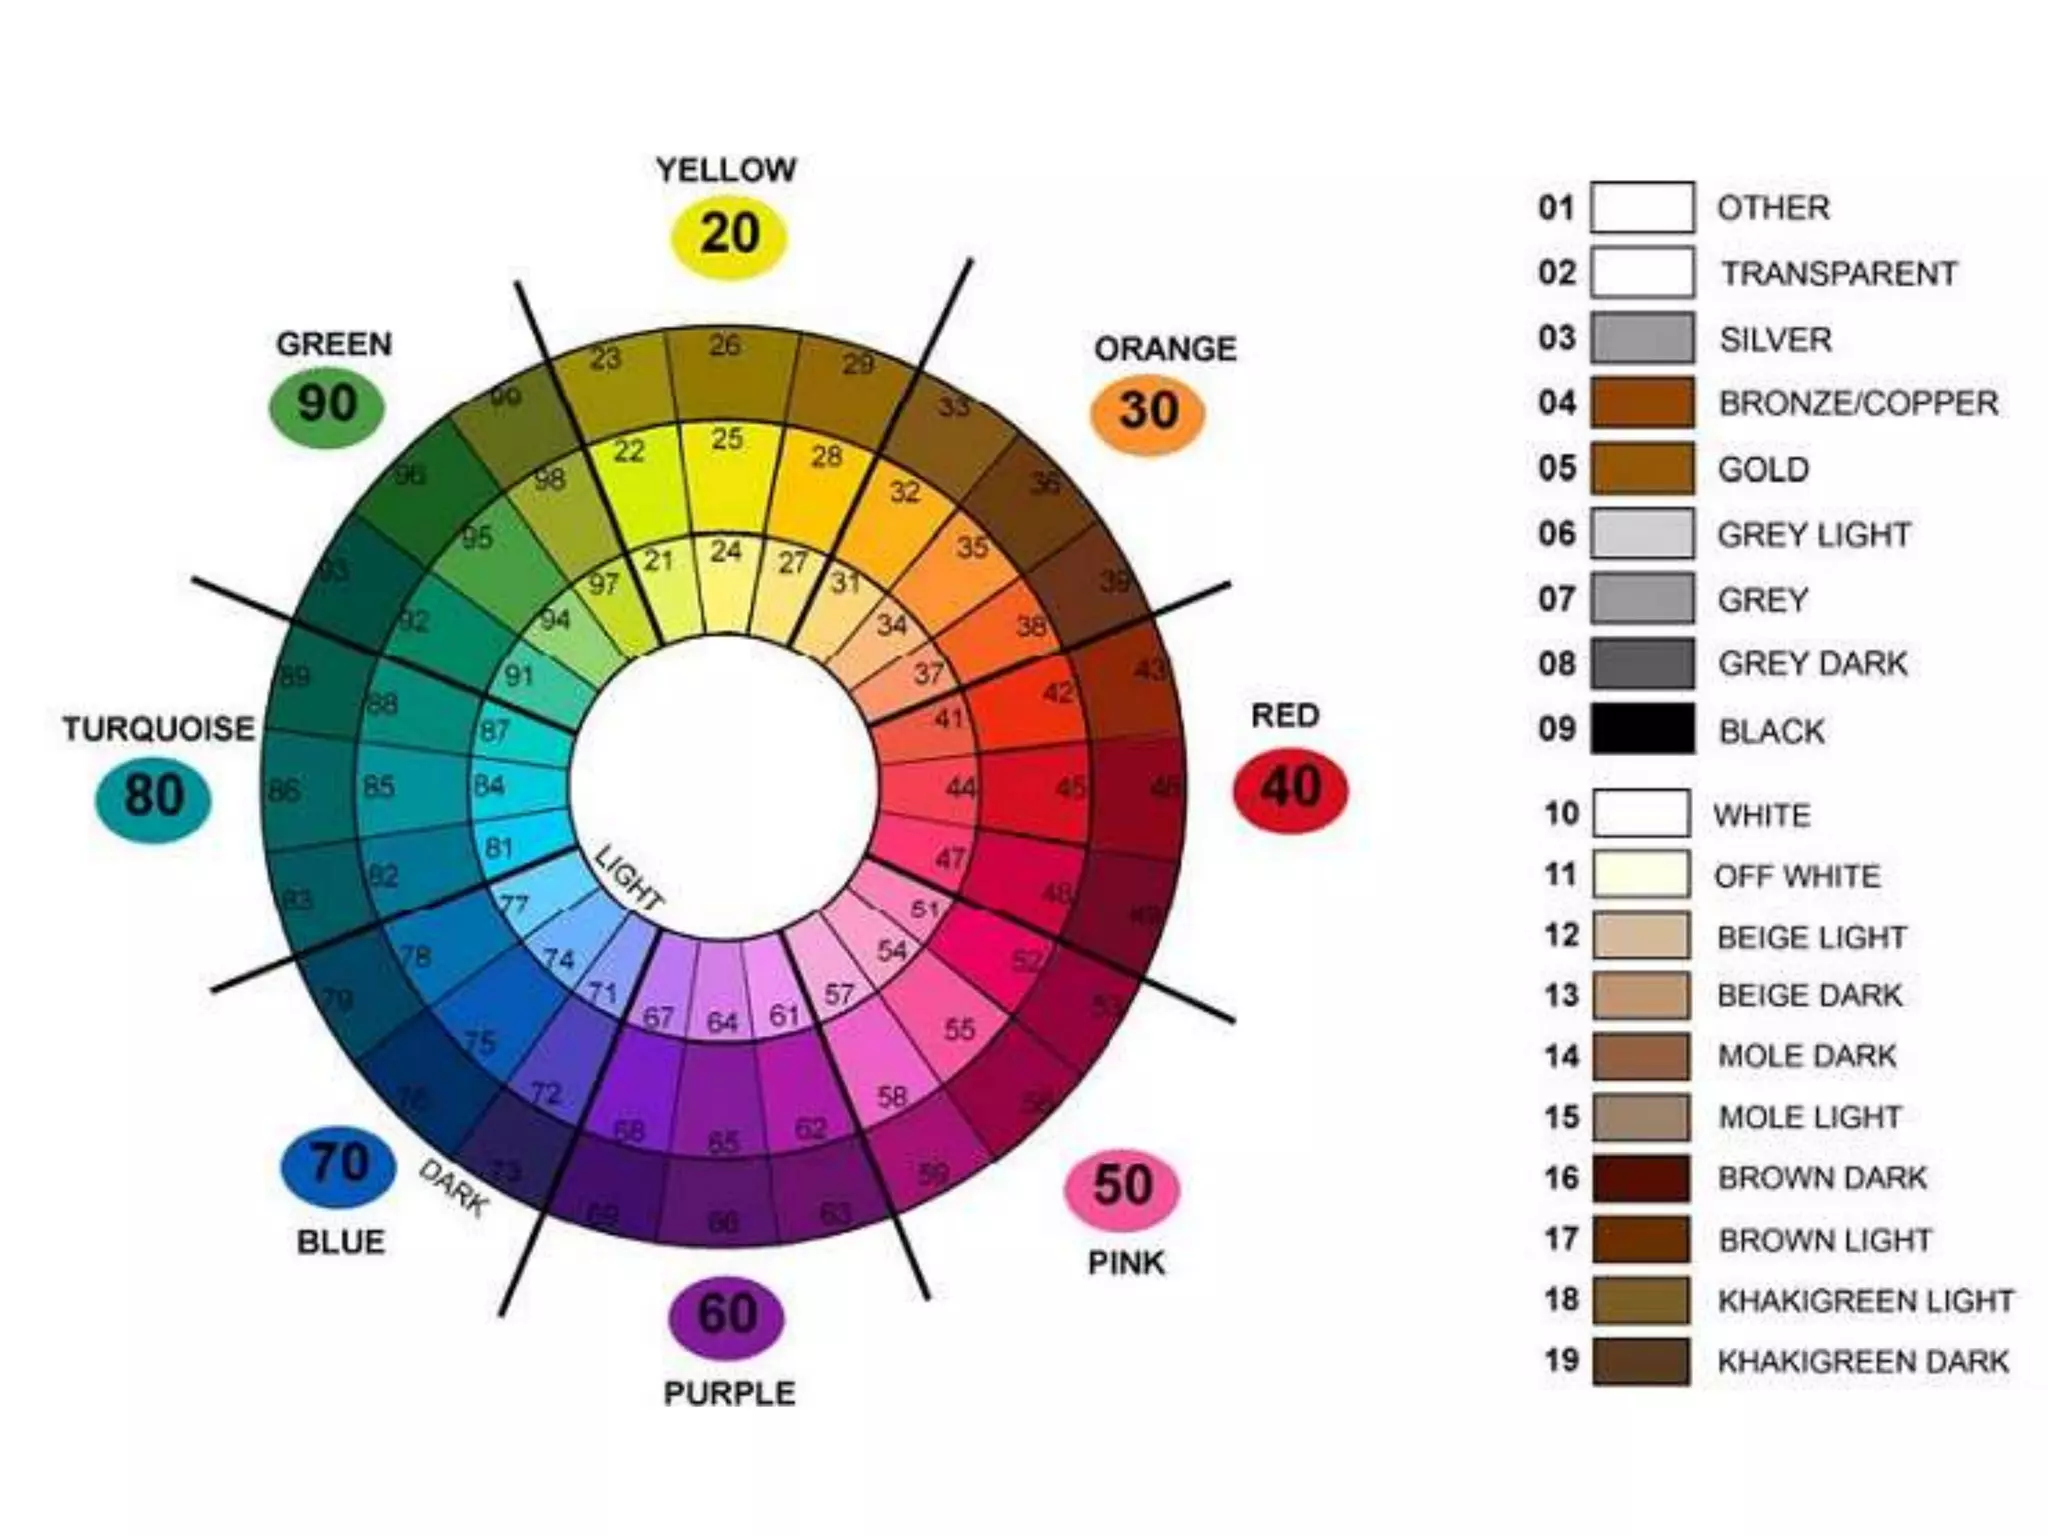
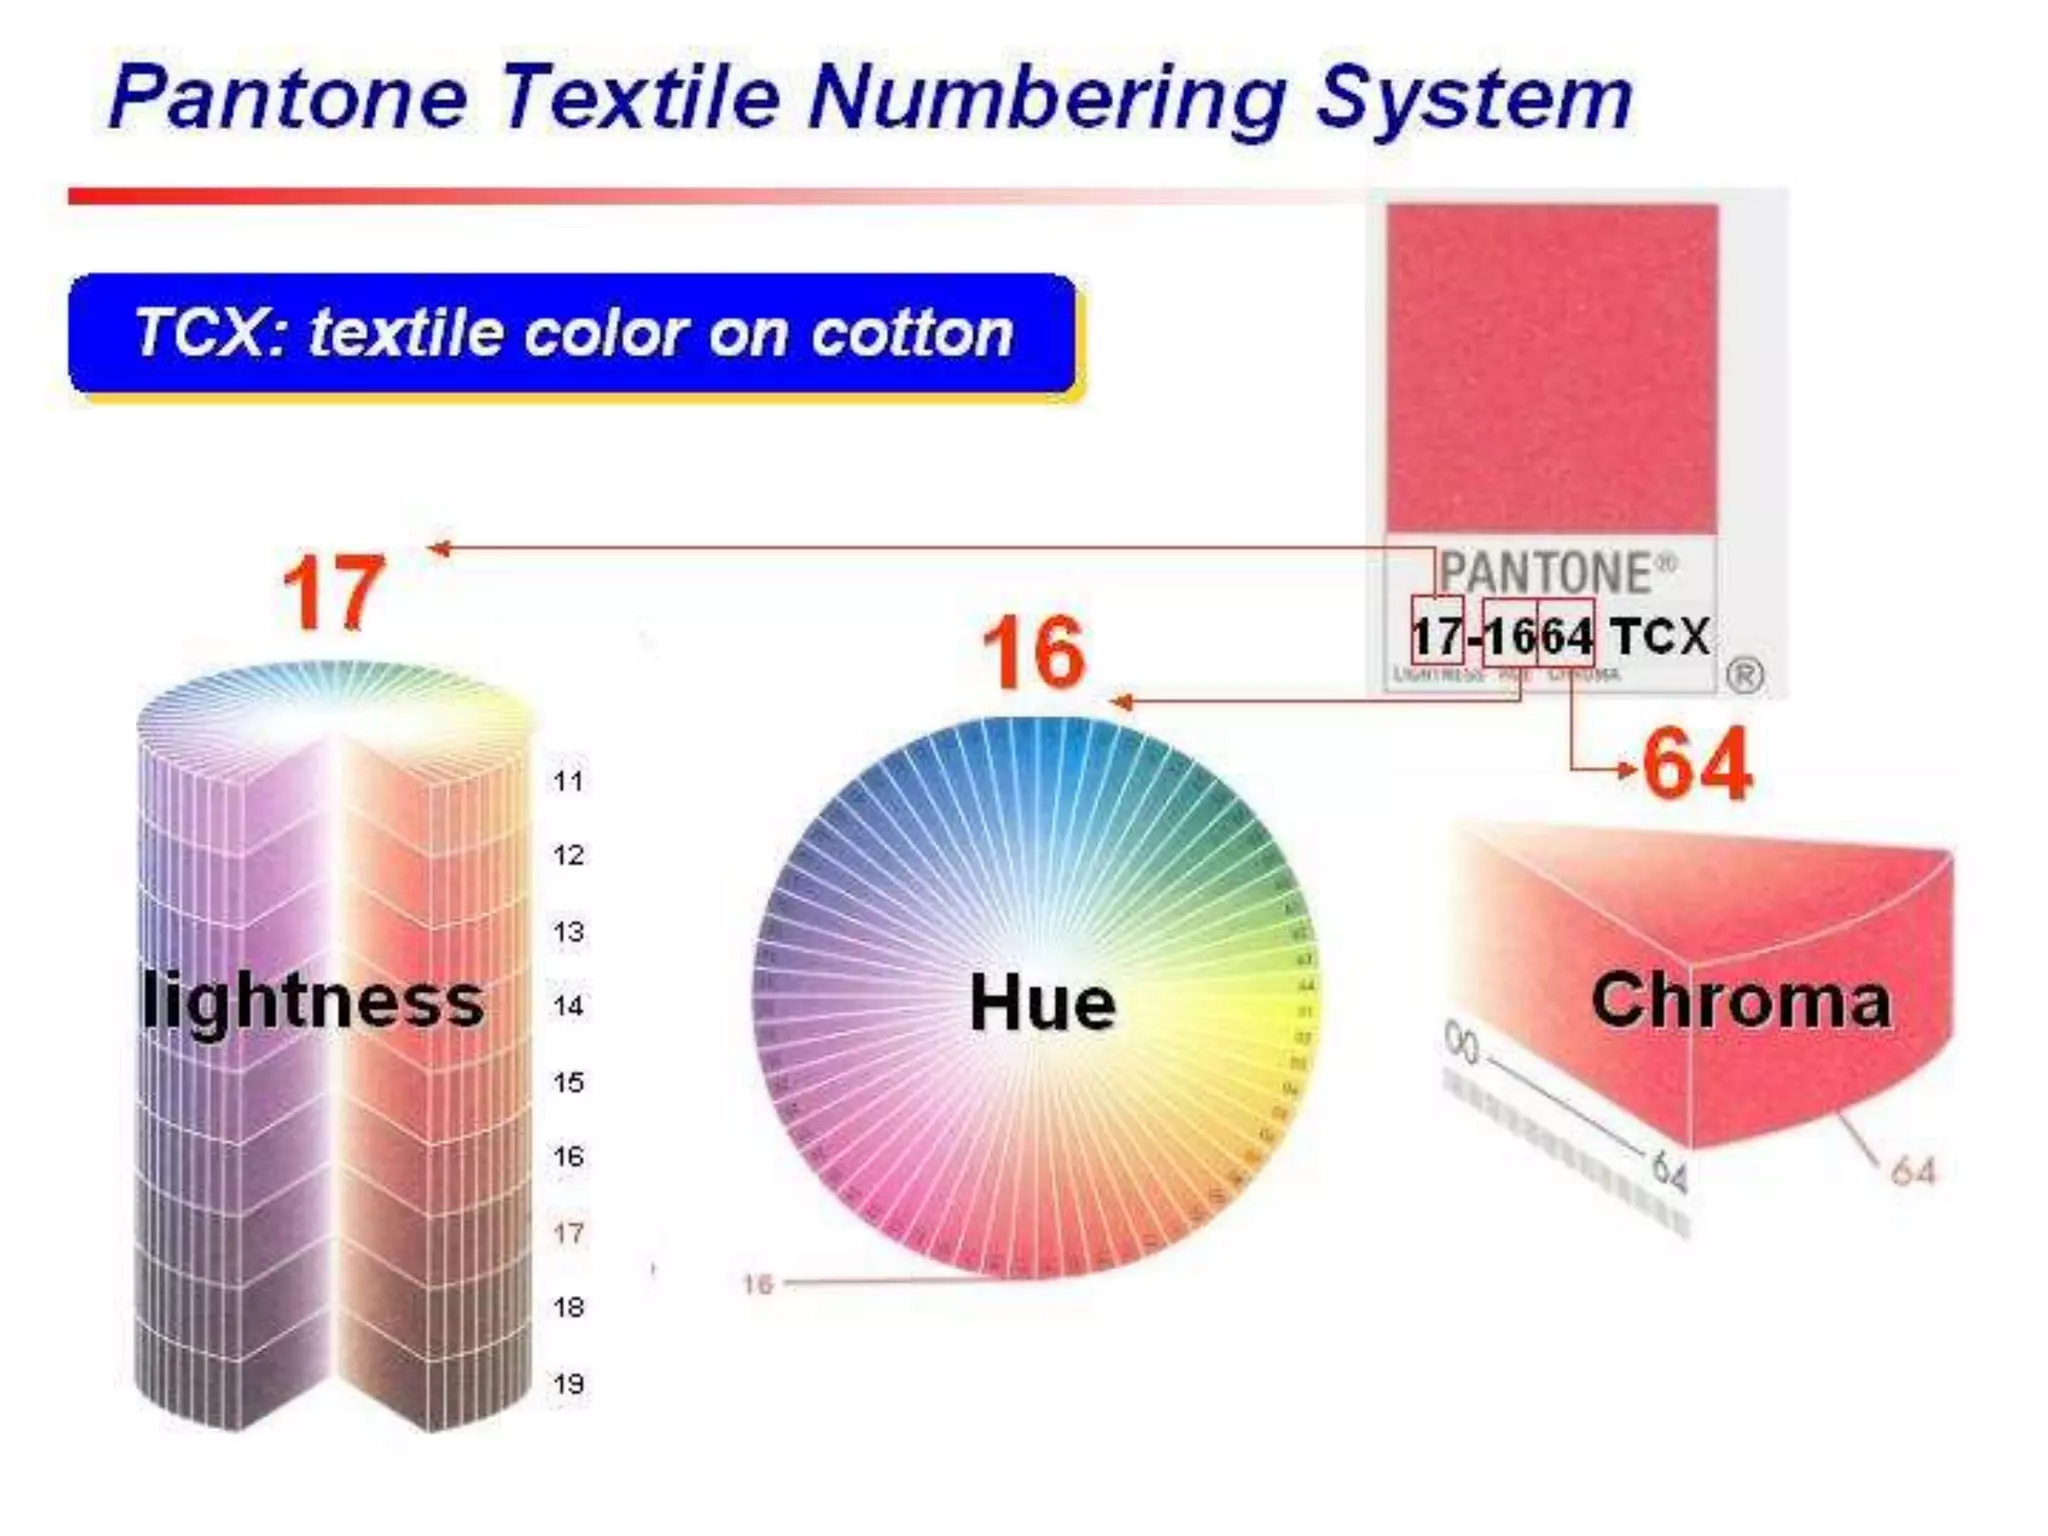
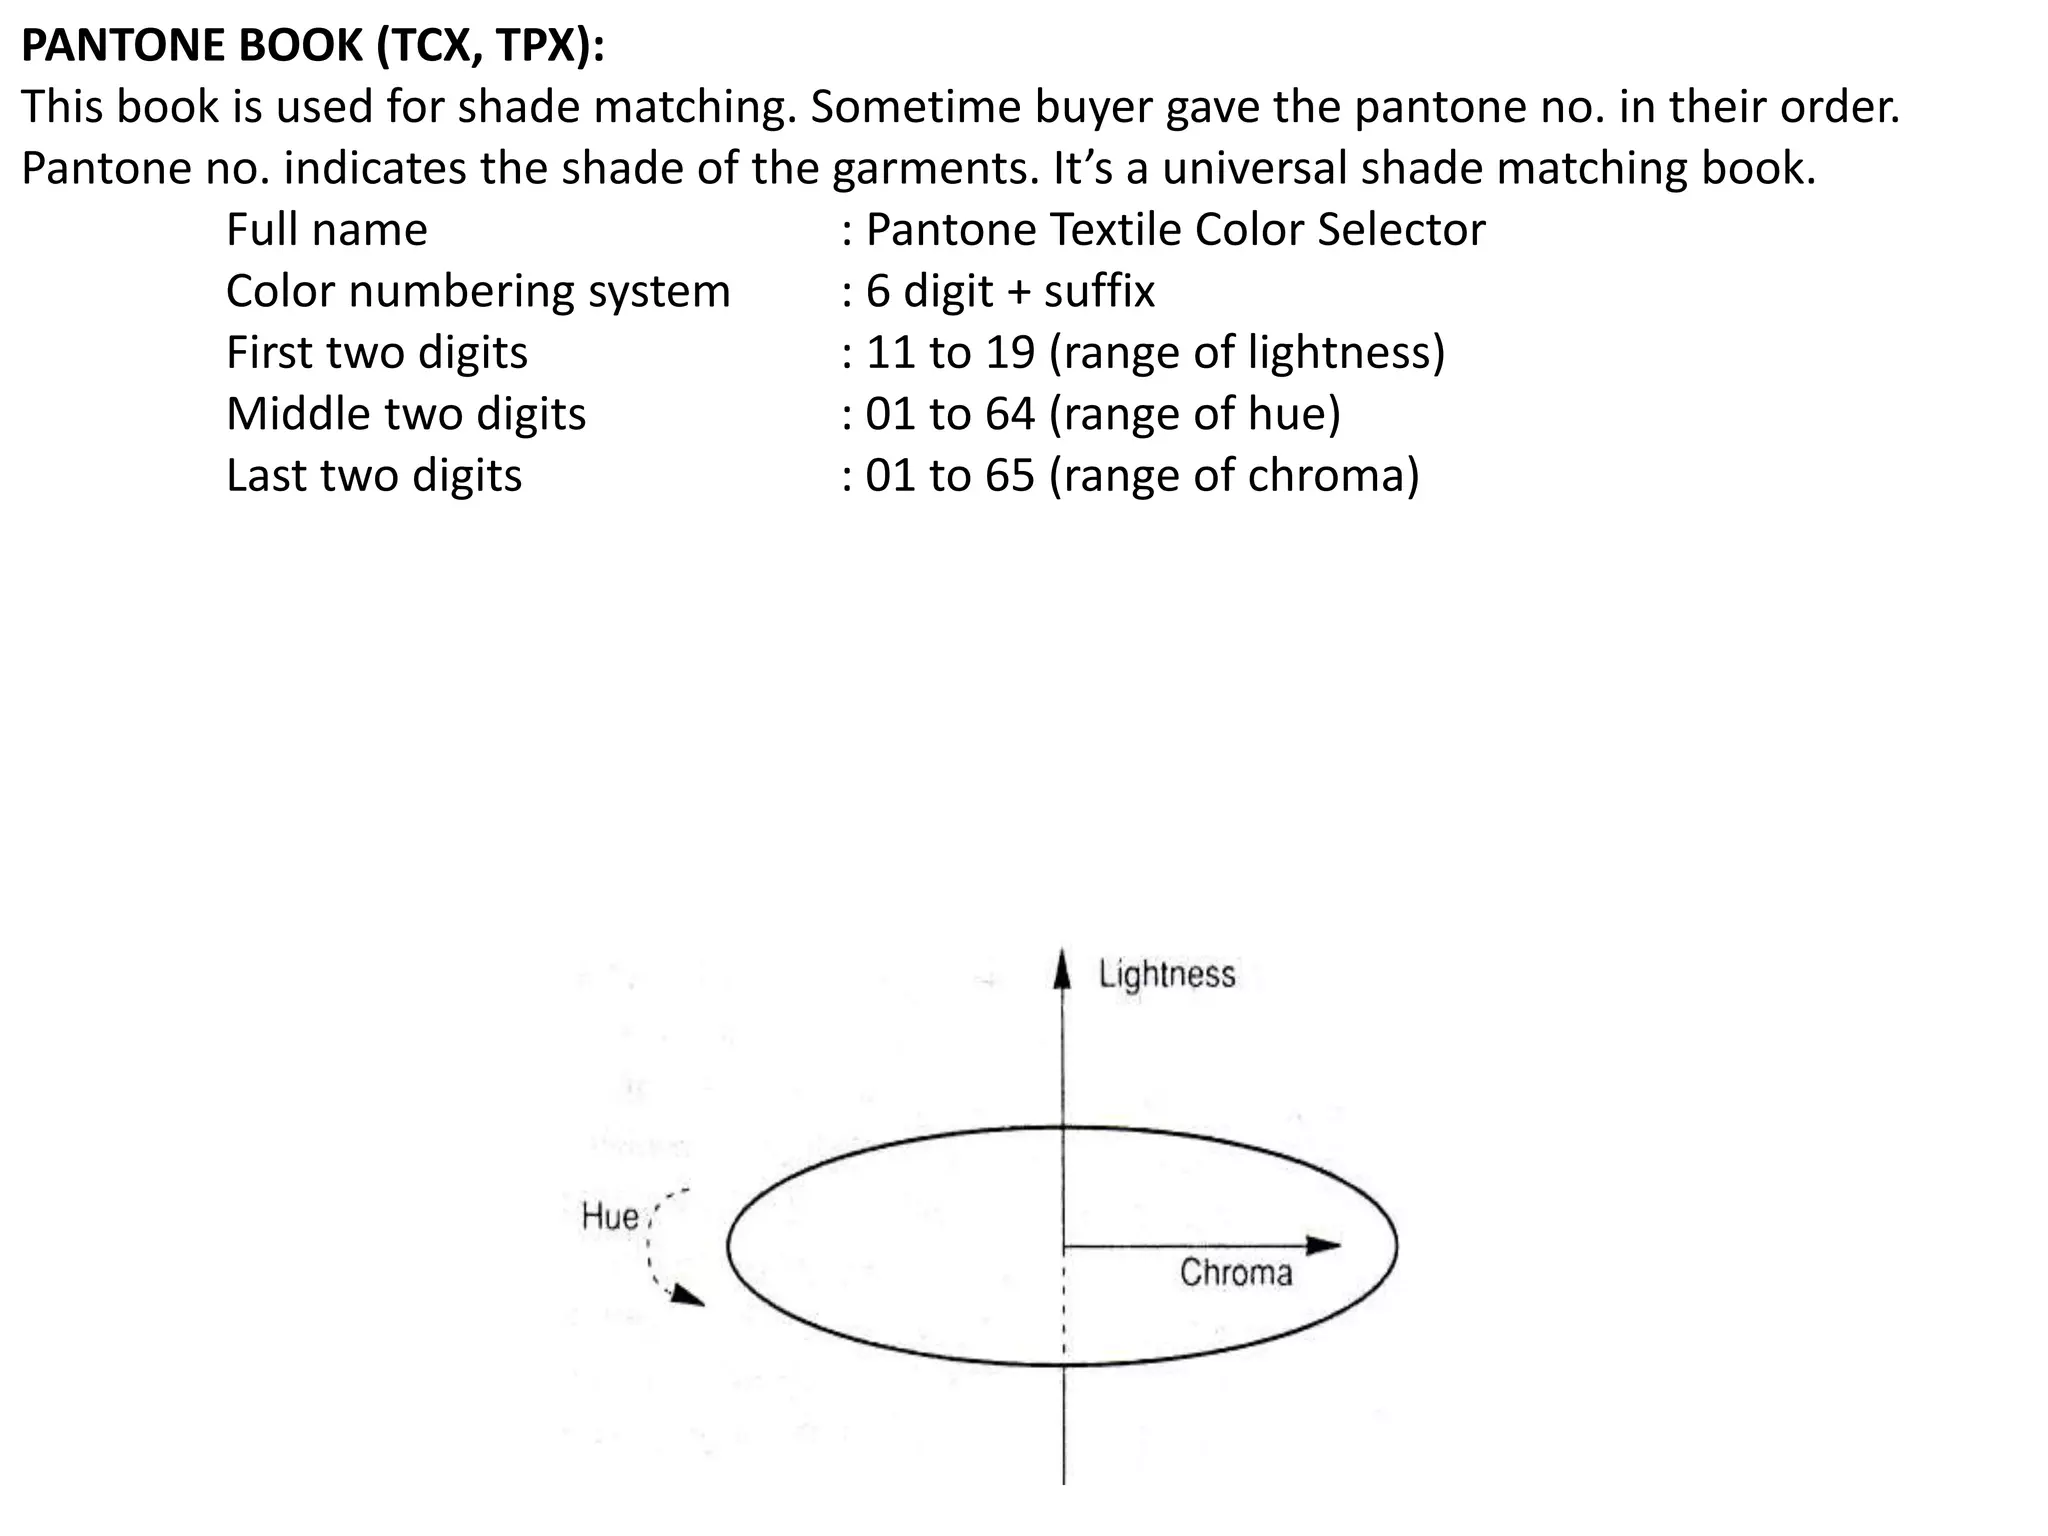
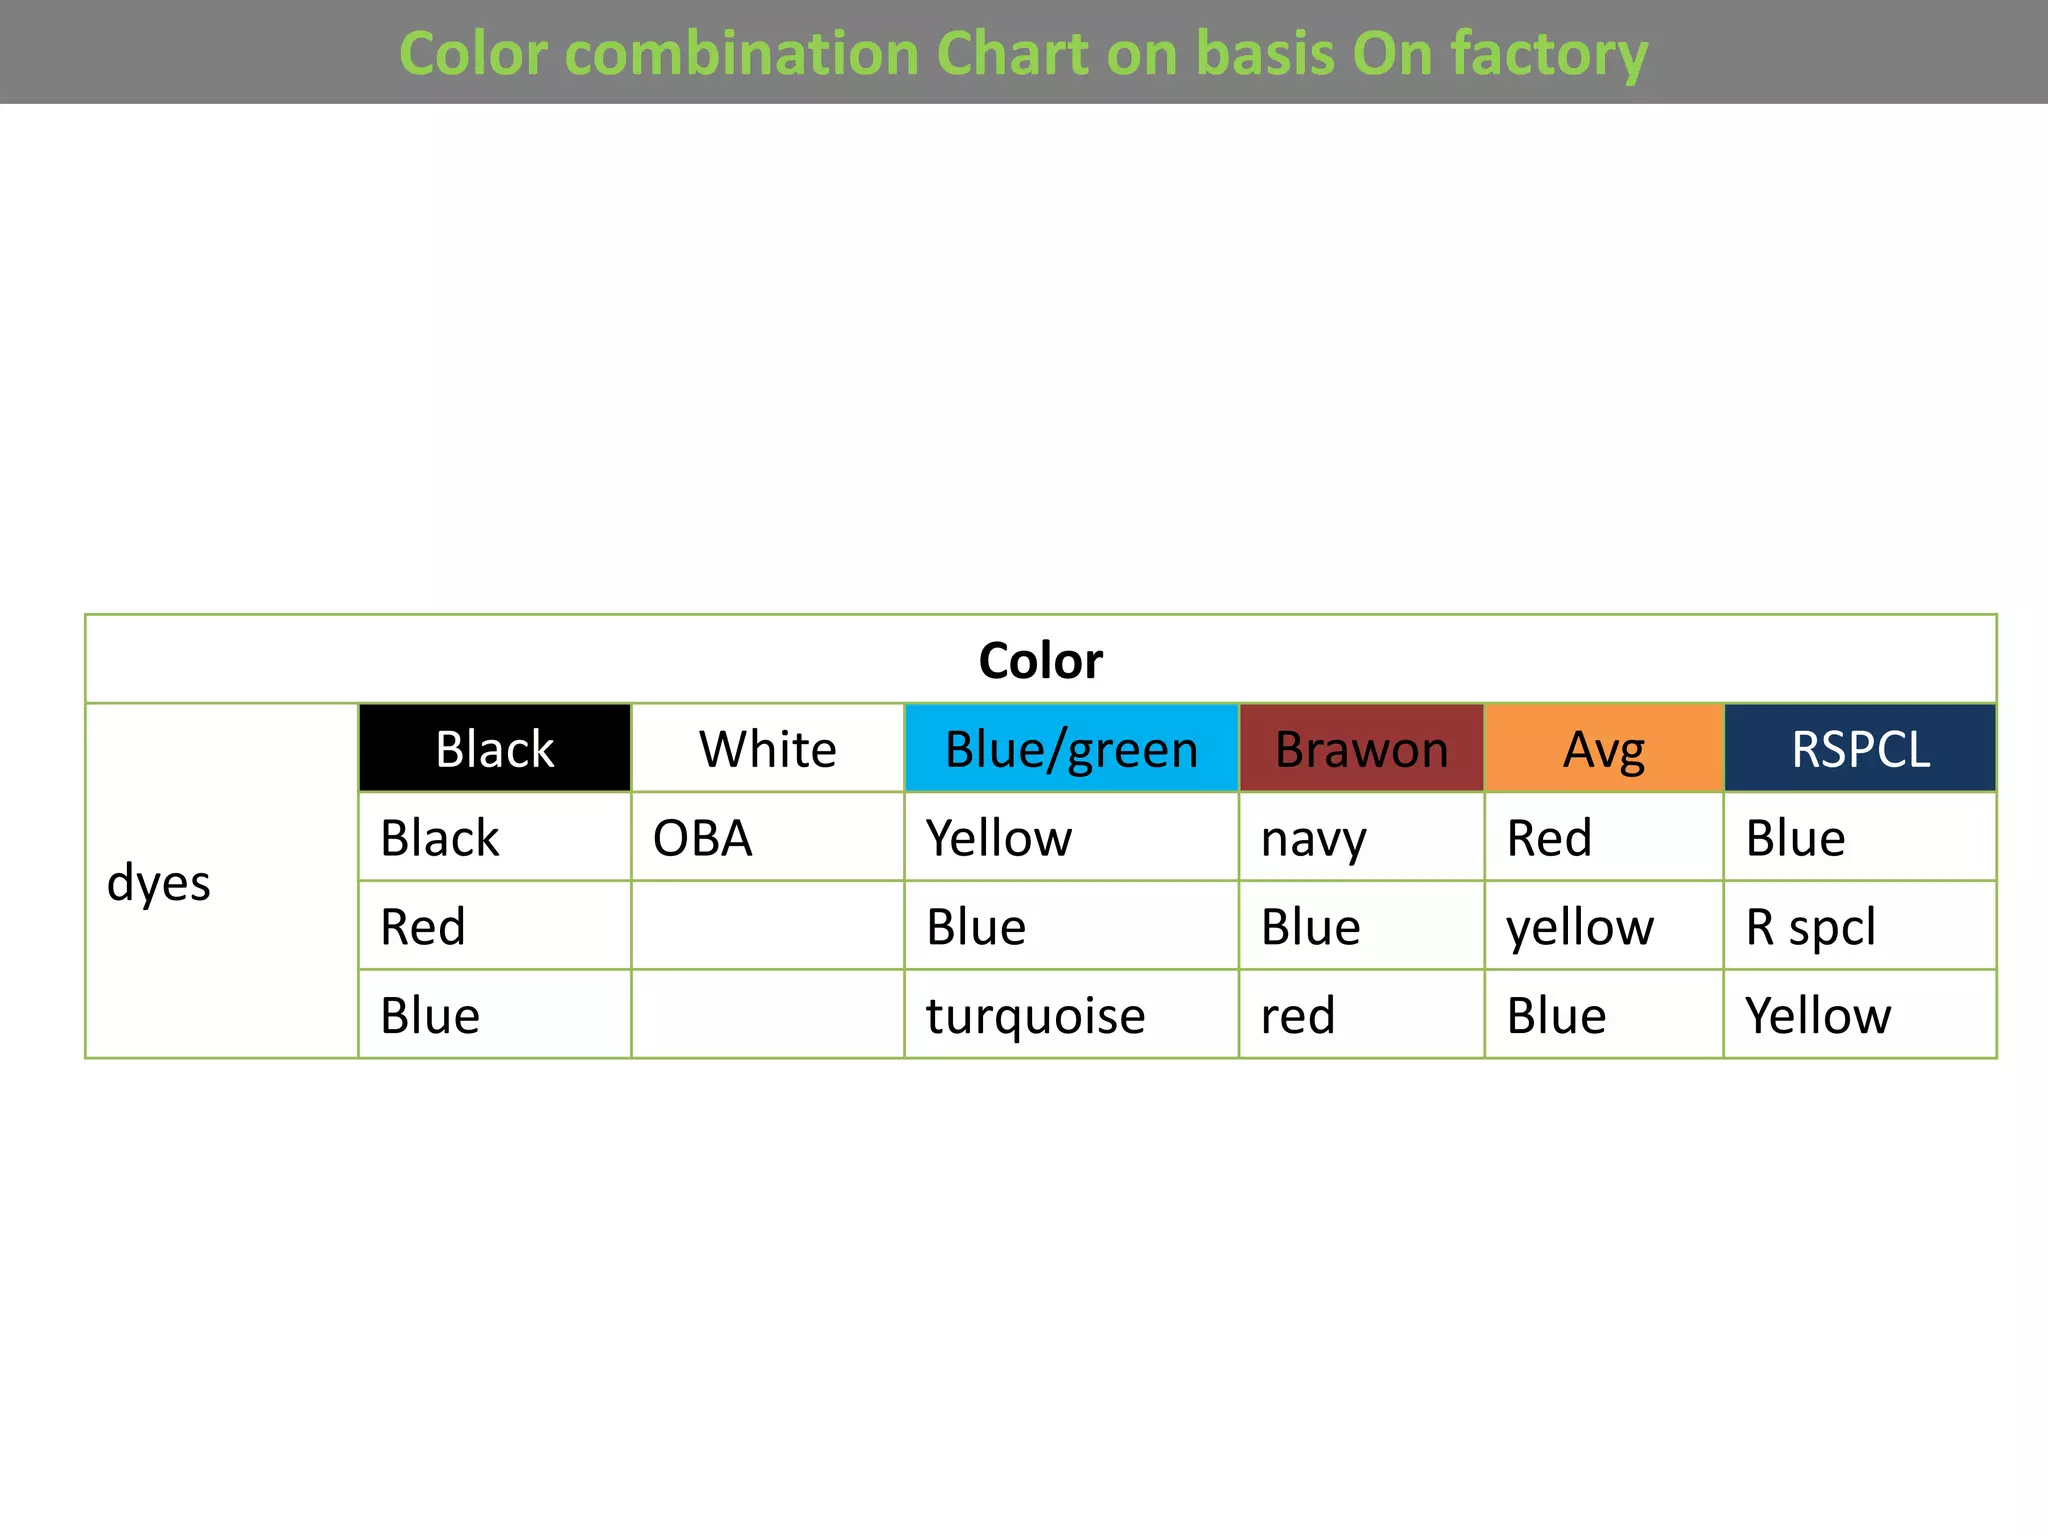
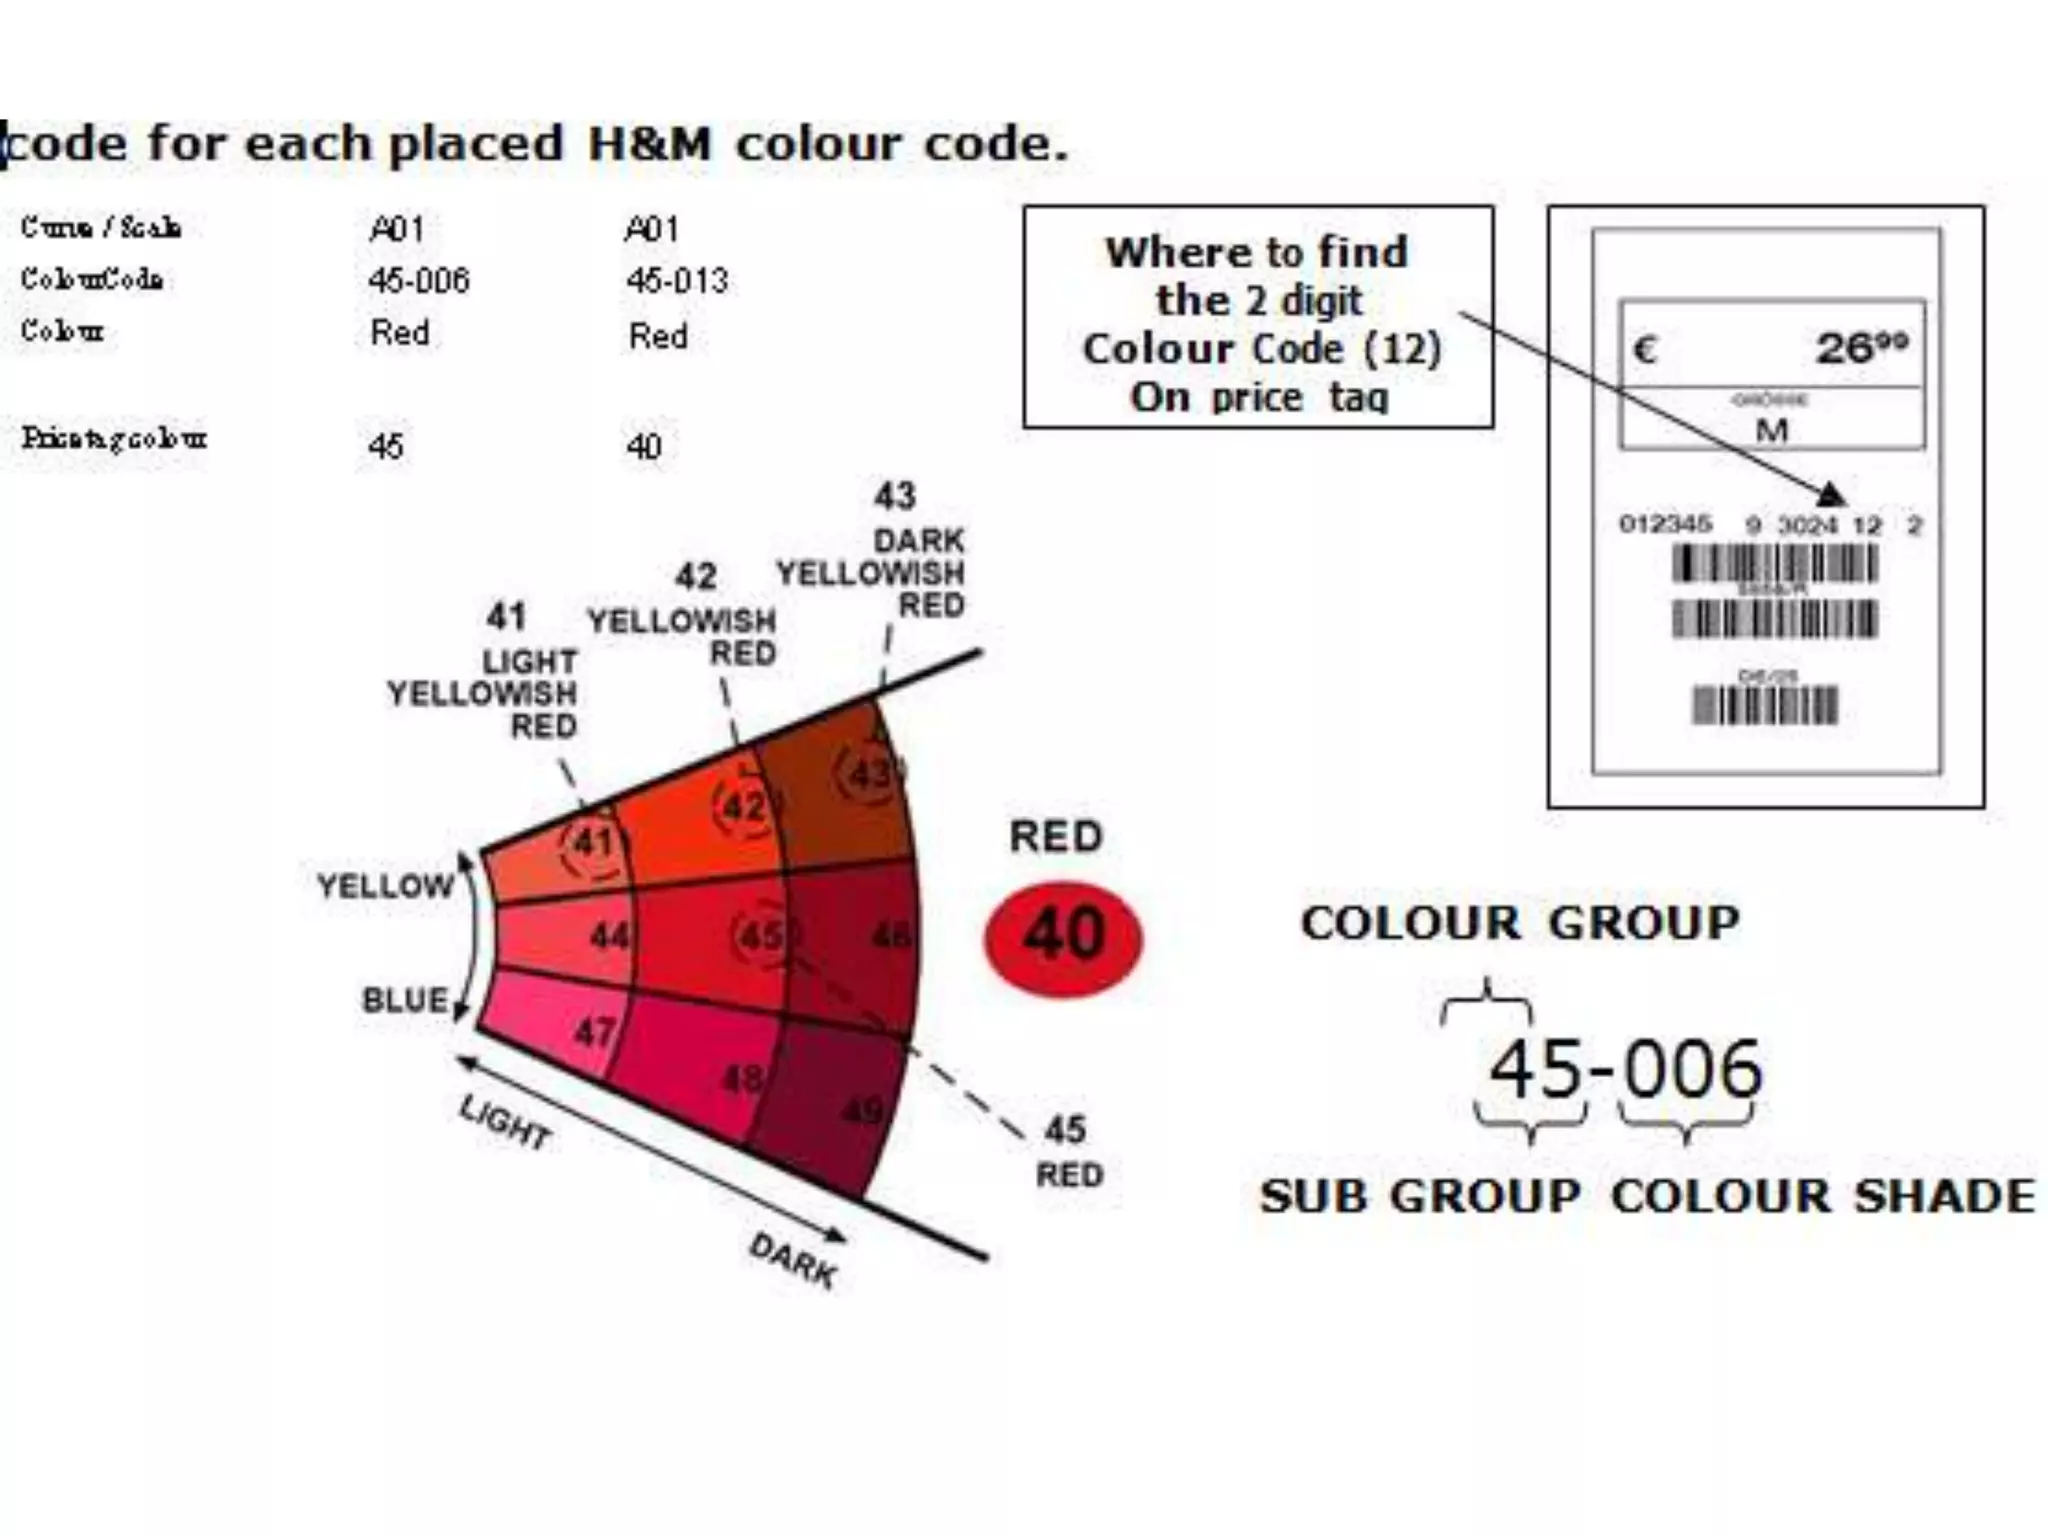
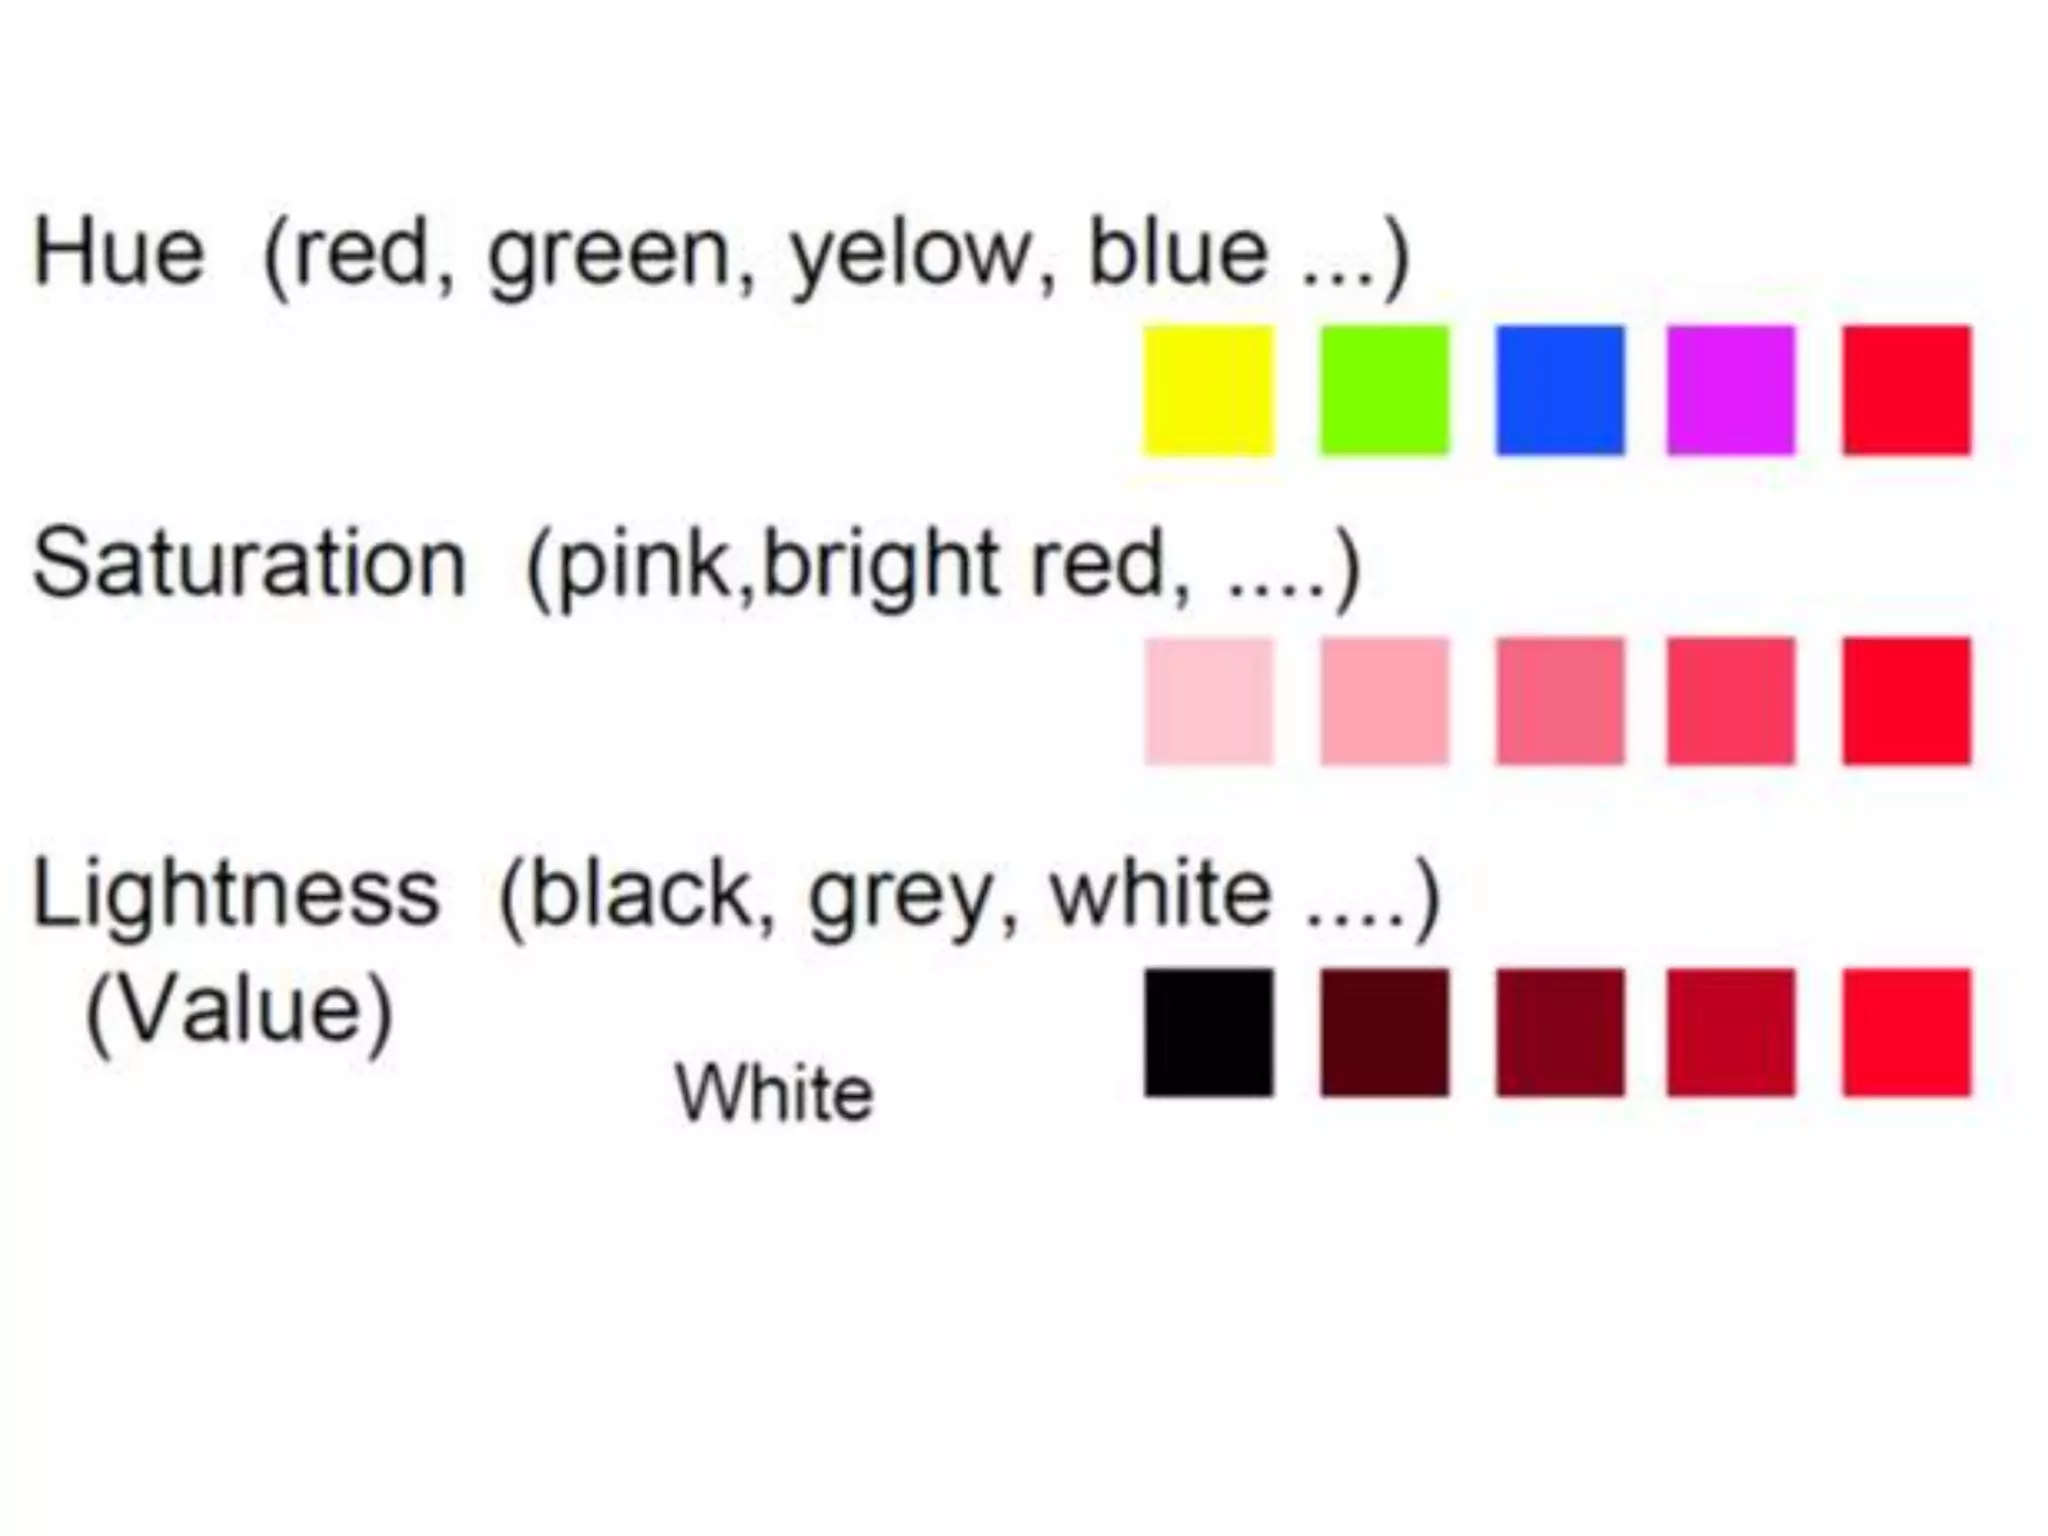
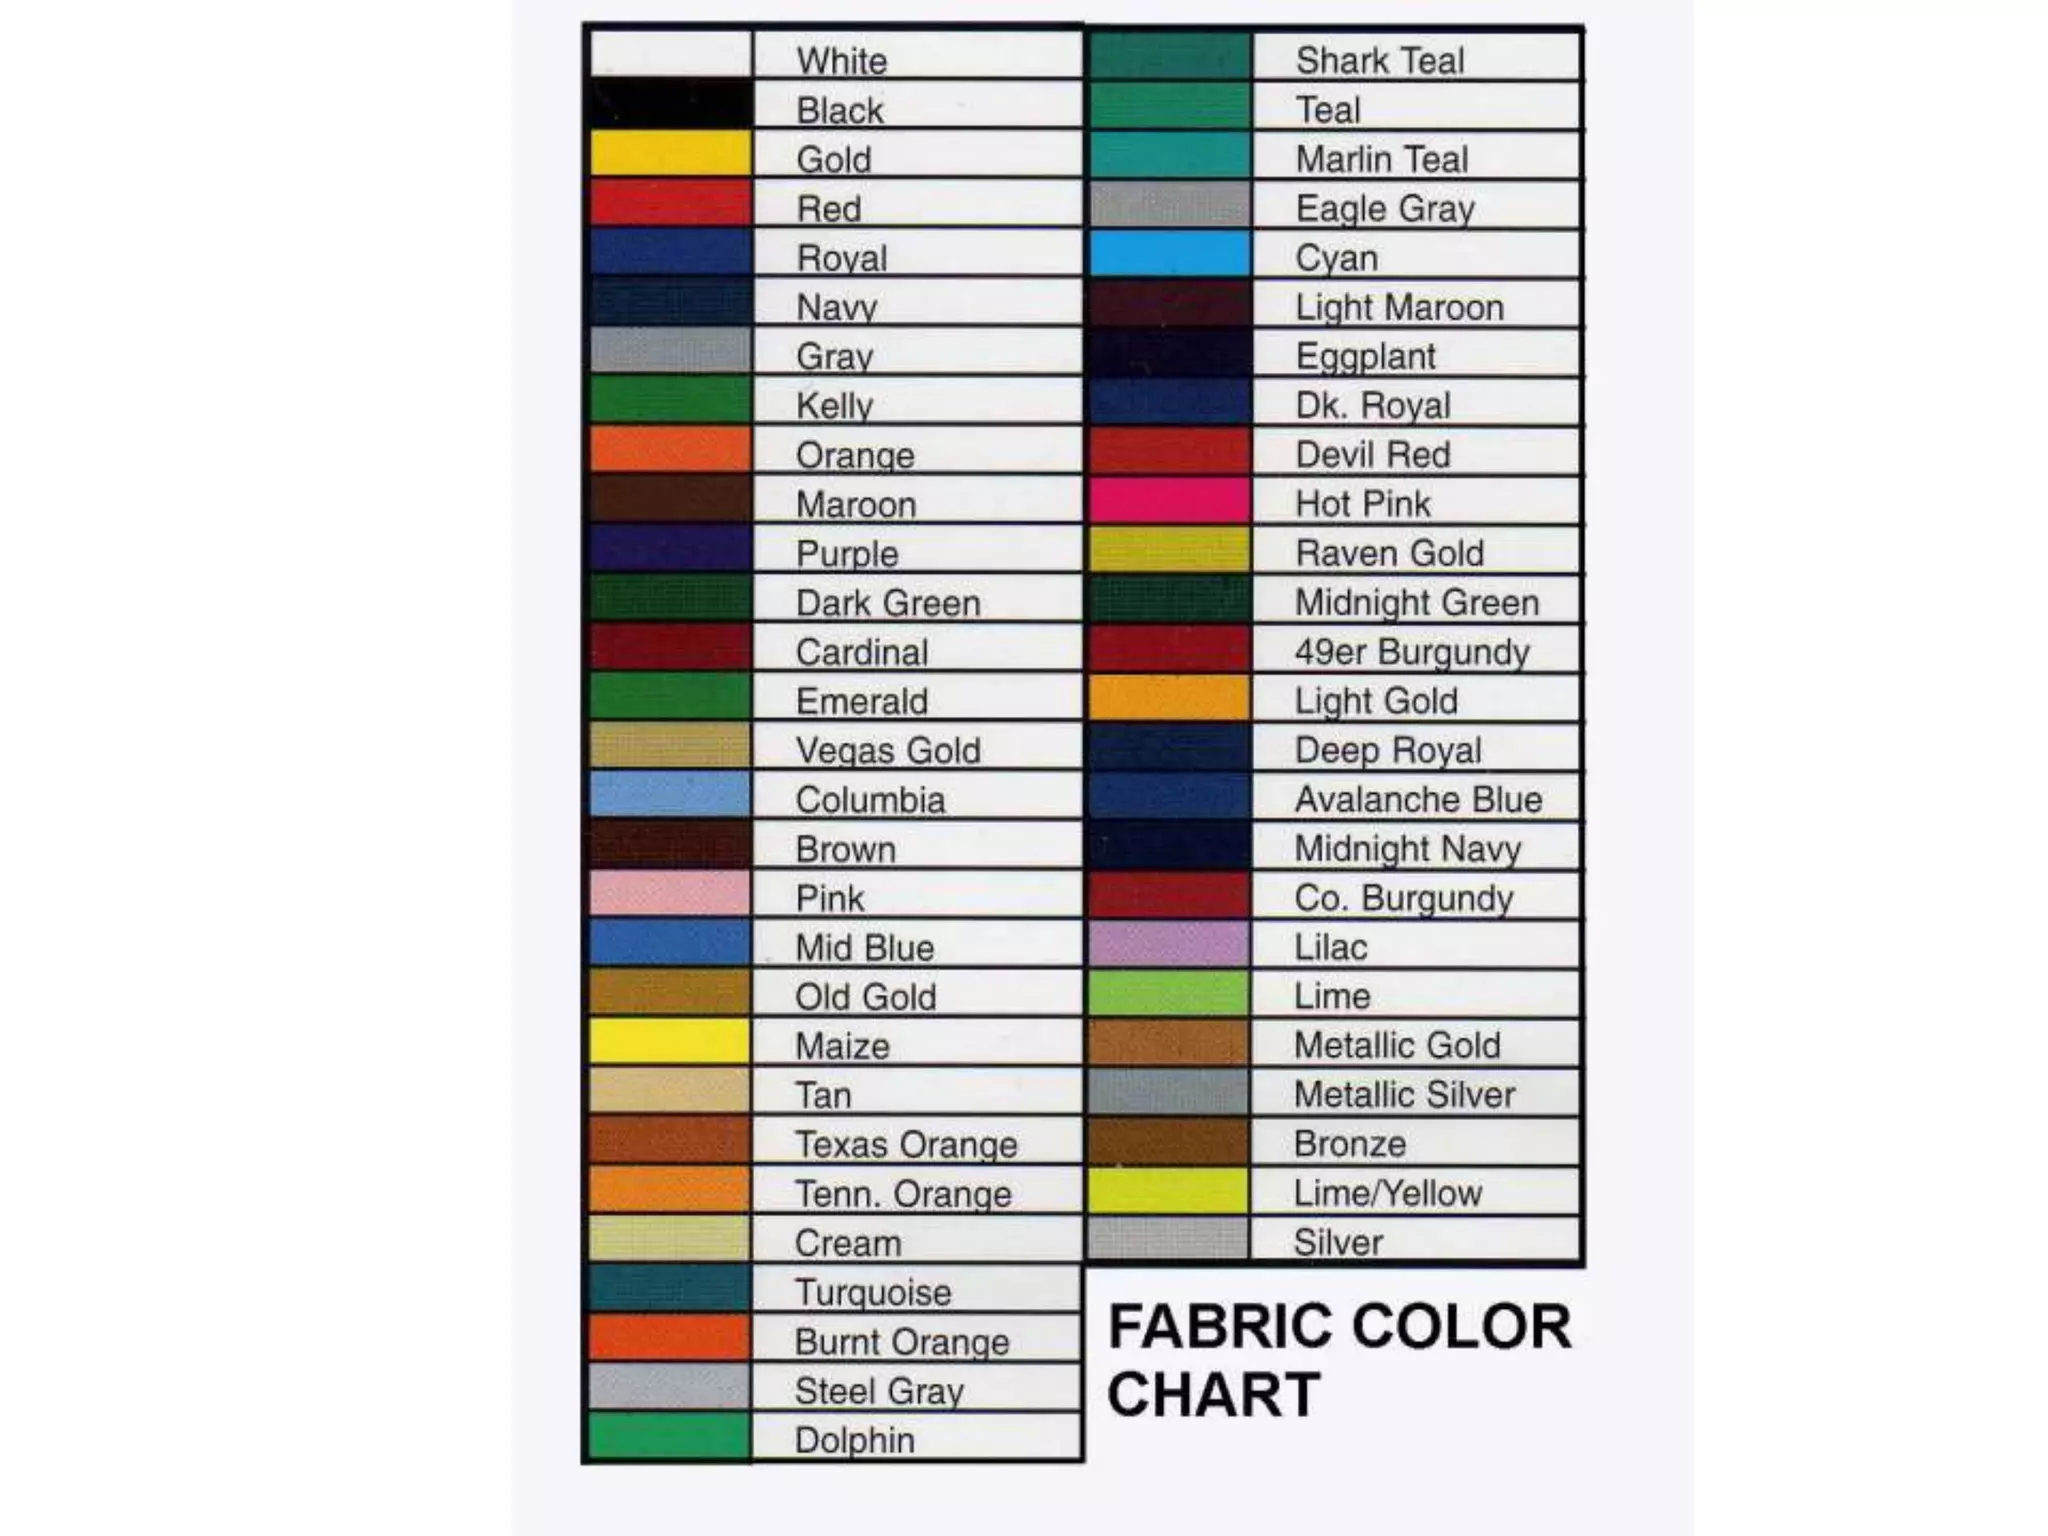
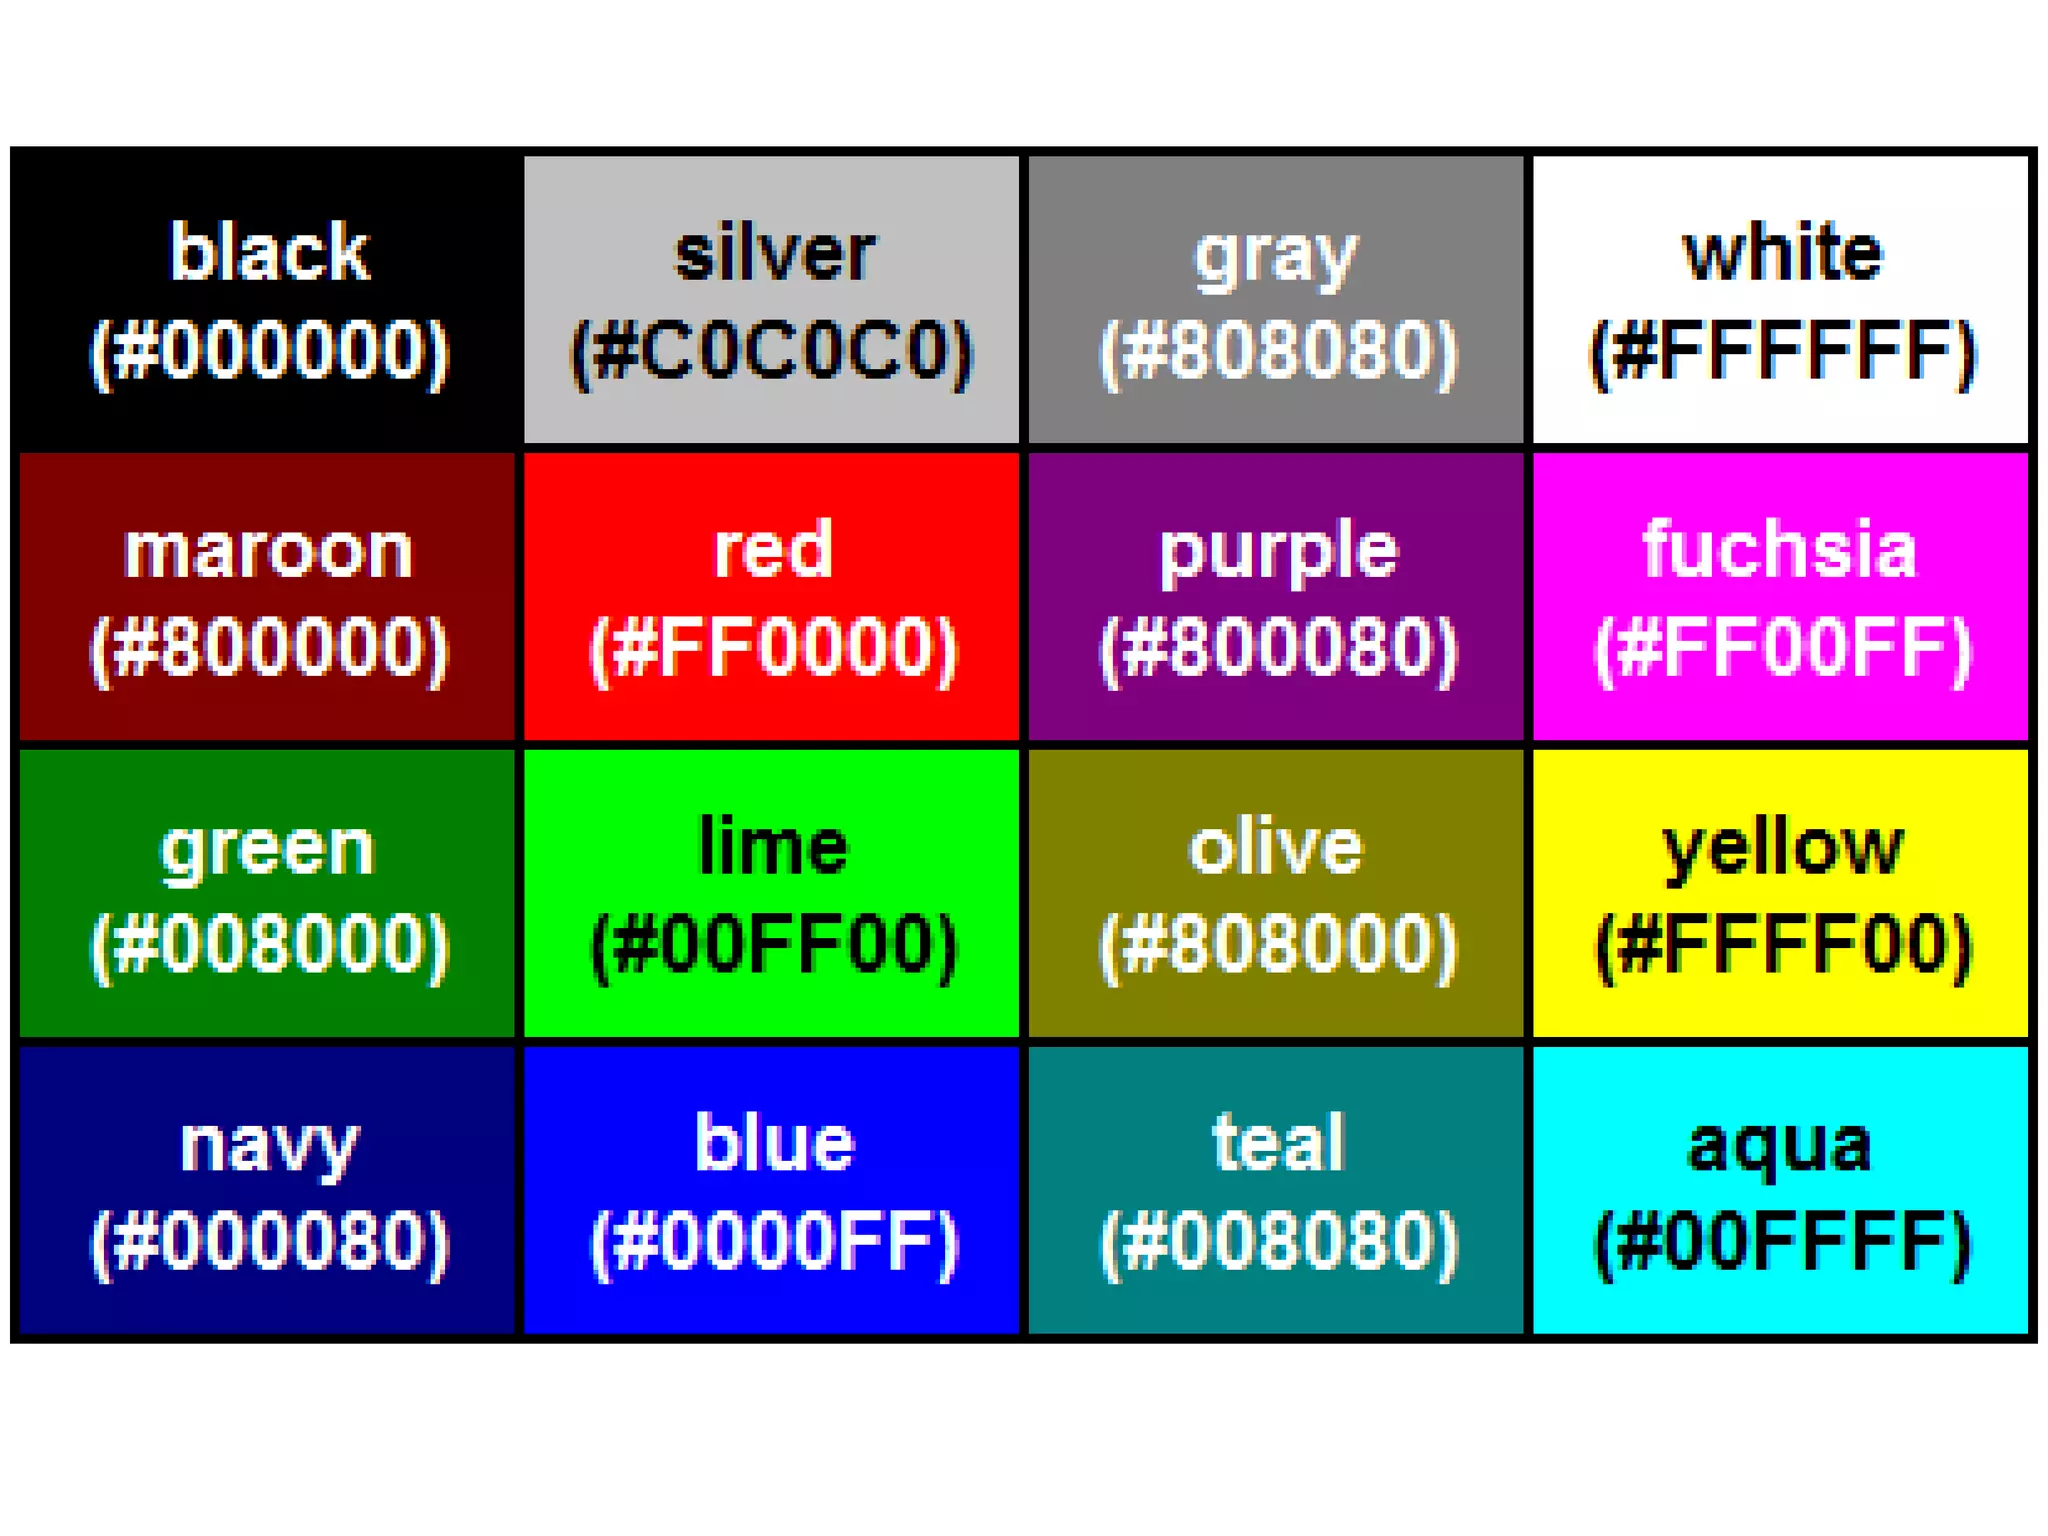
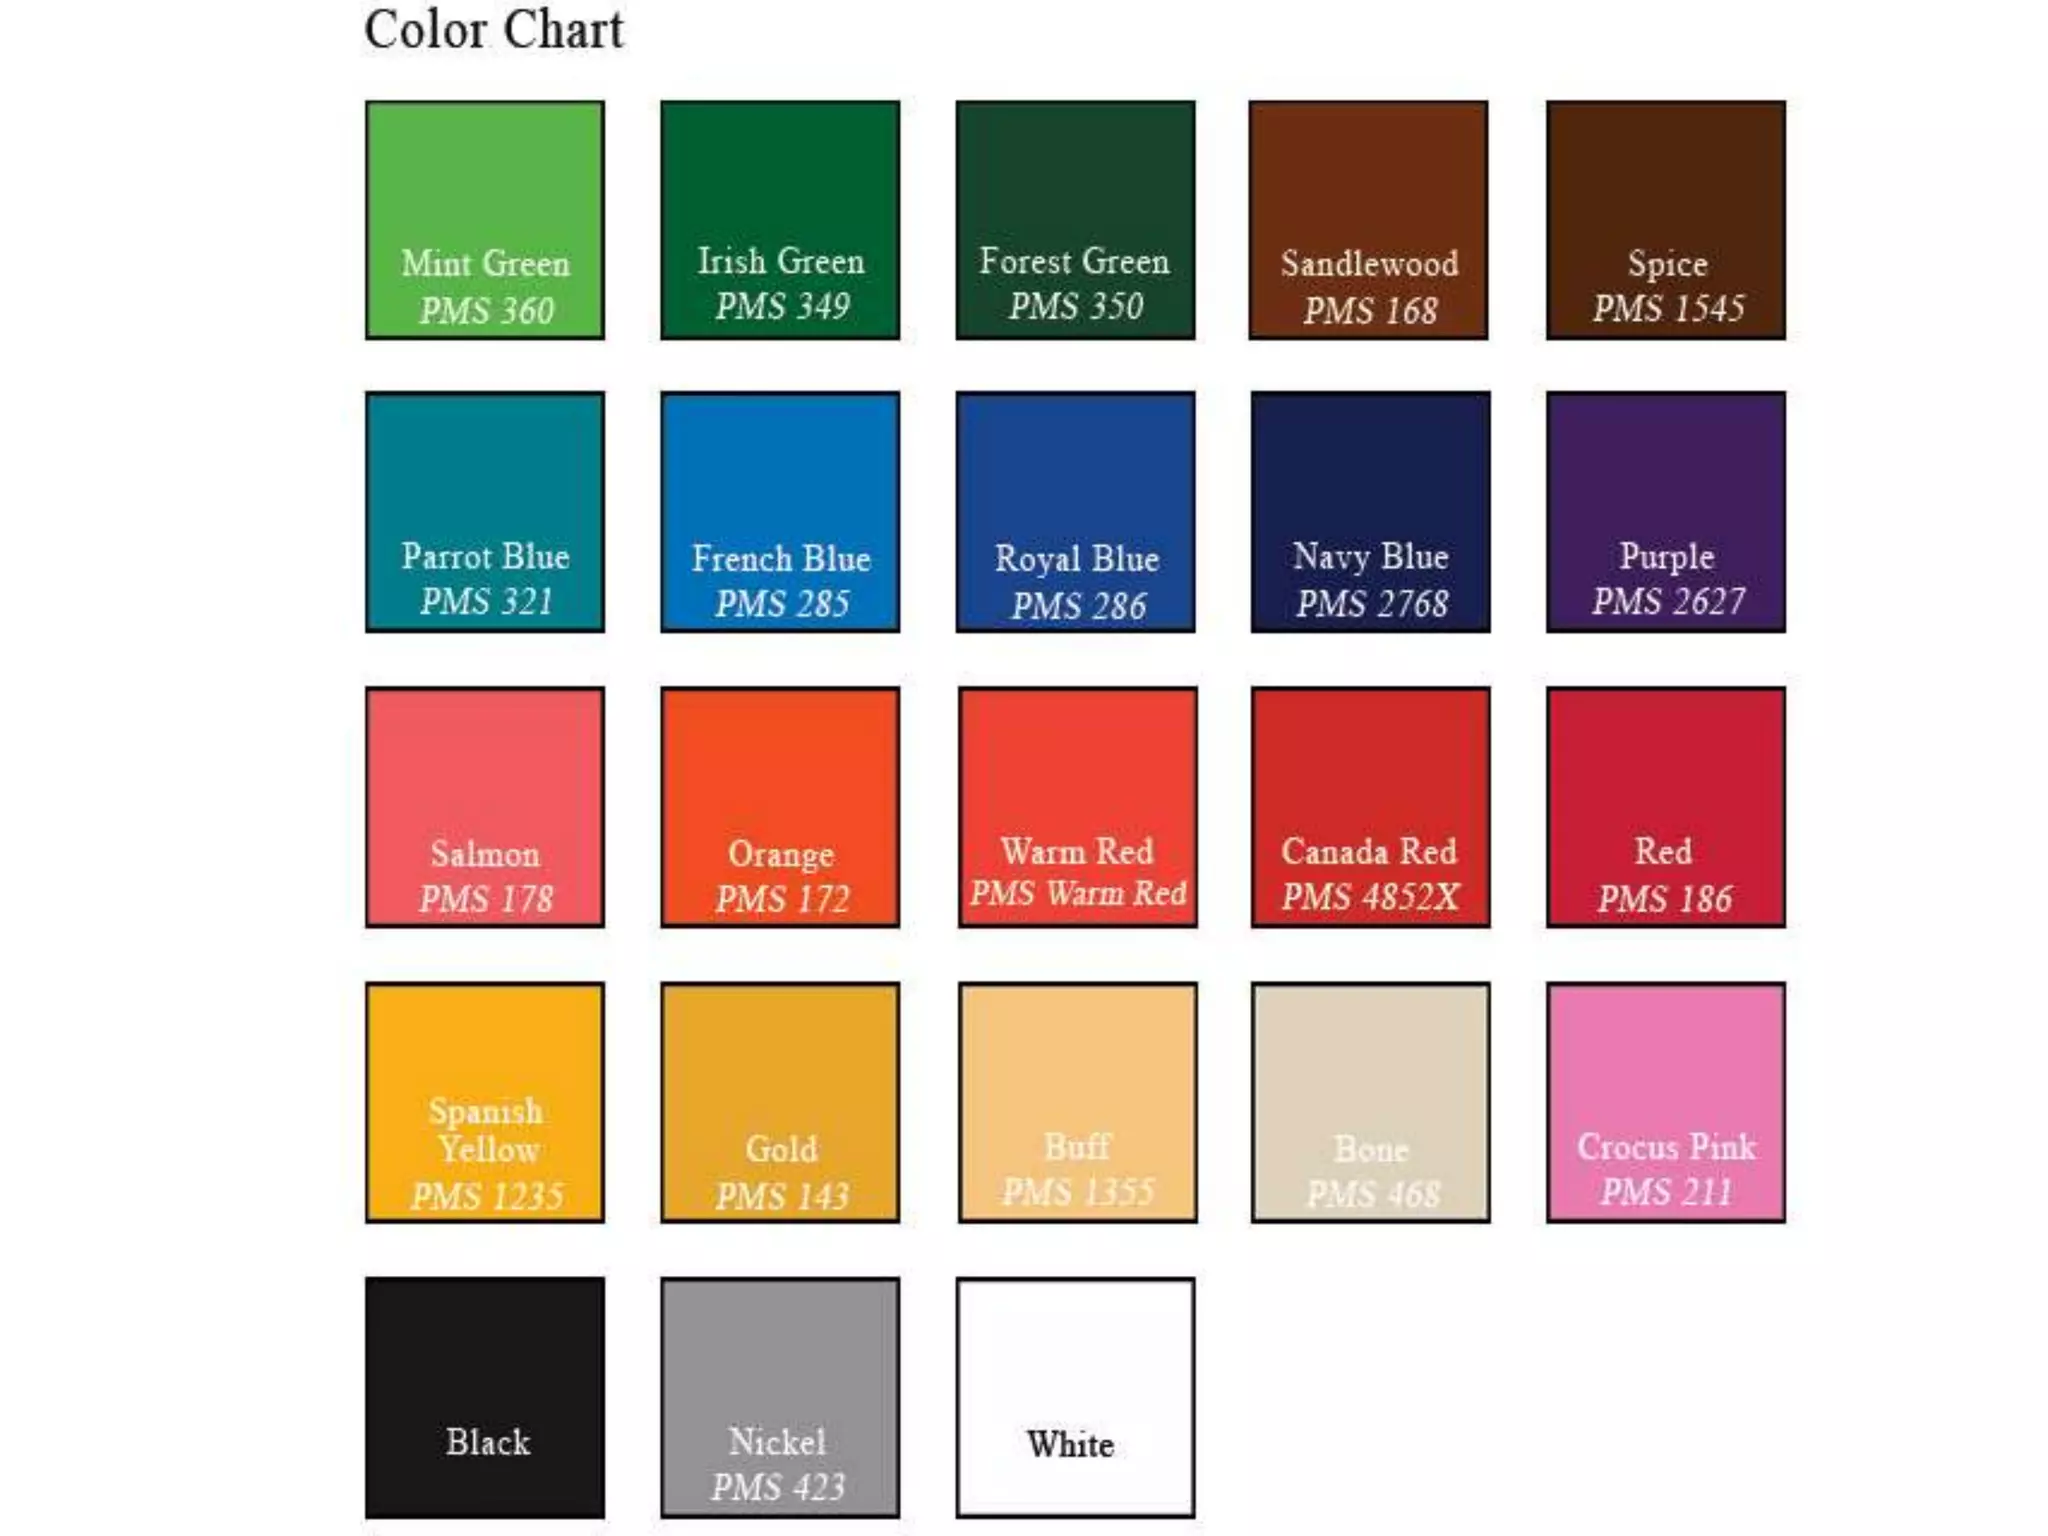
The document provides an overview of textile coloration measurement, outlining color classes and the Pantone color matching system. It explains the concept of color space using the CIELAB model, detailing metrics for hue, lightness, and chroma, and describes methods to calculate color differences between standards and batches. Additionally, it emphasizes the importance of establishing color tolerance areas for quality control in production, suggesting that these areas are more accurately represented by ellipses rather than rectangles.