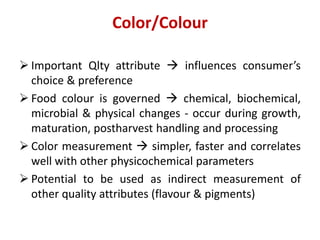
Color Measurement
Vijay Rakesh Reddy S
Scientist
Division of PHT&AE
Color/Colour
 Important Qlty attribute  influences consumer’s
choice & preference
 Food colour is governed  chemical, biochemical,
microbial & physical changes - occur during growth,
maturation, postharvest handling and processing
 Color measurement  simpler, faster and correlates
well with other physicochemical parameters
 Potential to be used as indirect measurement of
other quality attributes (flavour & pigments)
Traditional methods
Modern methods
Color systems/ Color Spaces
RGB-most popular- color video monitors
Hunter L a b,
Commission Internationale de l’Eclairage’s
(CIE) L*a*b*,
CIE XYZ,
CIE L*u*v*,
CIE Yxy, and
CIE LCH.
Factors affecting color measurement
• Angle of illumination: The optimal position of
the light source and the detector relative to
the sample surface is 0° and 45°
• Type of material: Opaque material do not
transmit light. It is directly reflected from the
surface as white light / absorbed
• Particle size: Decreasing particle size increases
light scattering, causing the sample to appear
lighter in color.
The amounts of red,
green and blue
needed to form any
particular colour are
called the tristimulus
values and are
denoted X, Y and Z,
respectively
Chromacity
co-ordinates
x (red), y (green) and
z (blue).
CIE XYZ Color space (1931)
L* is an approximate
measurement of
luminosity, which is the
property according to
which each colour can be
considered as equivalent to
a member of the greyscale,
between black and white
Lightness value (L*):
Color range from Dark
to Light in which Black
being the Darkest,
Grey in the middle and
White being the
lightest.
a* takes positive values
for reddish colours and
negative values for the
greenish ones, whereas
b* takes positive values
for yellowish colours
and negative values for
the bluish ones
CIE LAB Color space (1948)
Hue (h°): Color has basic
difference appearance such as
red differ from blue, green or
yellow. These distinctions are
called Hue
Chroma (C): the quantitative
attribute of colourfulness, is
used to determine the degree of
difference of a hue in
comparison to a grey colour with
the same lightness.
The higher the chroma values,
the higher is the colour intensity
of samples perceived by
humans.
Derived General Objective Colour Indices
Total Colour Difference
 Colour changes can be measured as the modulus of
the distance vector between the initial colour values
and the actual colour coordinates.
 It indicates the magnitude of colour difference
between stored and control samples.
 Total colour difference (ΔE) is calculated as
ΔE>3 Very distinct,
1.5< ΔE < 3  distinct
1.5< ΔE  Small difference
Whiteness Index (WI)
 Whiteness indices (WI) are widely measured to yield
numbers correlating closely with consumers’
preferences for white colours.
 It mathematically combines lightness and yellow–
blue into a single term.
 The WI represents the overall whiteness of food
products that may indicate the extent of
discoloration during the drying process.
 WI indicates the degree of whiteness
Yellowness Index (YI)
 Yellowness is associated with scorching, soiling, and
general product degradation by light, chemical
exposure and processing.
 Yellowness indices are used chiefly to quantify these
types of degradation with a single value.
 They can be used when measuring clear, near-
colourless liquids or solids in transmission and near-
white, opaque solids in reflectance
Browning Index (BI)
 The browning index (BI) is used to characterise the
overall changes in browning colour
 It is defined as brown colour purity and is one of the
most common indicators of browning in food
products containing sugar.
 Enzymatic browning has been quantified using
browning indicators through a biochemical index
(PPO activity)
 Browning Index Based on CIE L*a*b* Coordinates

Color Measurement.pdf

  • 1.
    Color Measurement Vijay RakeshReddy S Scientist Division of PHT&AE
  • 2.
    Color/Colour  Important Qltyattribute  influences consumer’s choice & preference  Food colour is governed  chemical, biochemical, microbial & physical changes - occur during growth, maturation, postharvest handling and processing  Color measurement  simpler, faster and correlates well with other physicochemical parameters  Potential to be used as indirect measurement of other quality attributes (flavour & pigments)
  • 3.
  • 4.
  • 5.
    Color systems/ ColorSpaces RGB-most popular- color video monitors Hunter L a b, Commission Internationale de l’Eclairage’s (CIE) L*a*b*, CIE XYZ, CIE L*u*v*, CIE Yxy, and CIE LCH.
  • 6.
    Factors affecting colormeasurement • Angle of illumination: The optimal position of the light source and the detector relative to the sample surface is 0° and 45° • Type of material: Opaque material do not transmit light. It is directly reflected from the surface as white light / absorbed • Particle size: Decreasing particle size increases light scattering, causing the sample to appear lighter in color.
  • 7.
    The amounts ofred, green and blue needed to form any particular colour are called the tristimulus values and are denoted X, Y and Z, respectively Chromacity co-ordinates x (red), y (green) and z (blue). CIE XYZ Color space (1931)
  • 9.
    L* is anapproximate measurement of luminosity, which is the property according to which each colour can be considered as equivalent to a member of the greyscale, between black and white Lightness value (L*): Color range from Dark to Light in which Black being the Darkest, Grey in the middle and White being the lightest.
  • 10.
    a* takes positivevalues for reddish colours and negative values for the greenish ones, whereas b* takes positive values for yellowish colours and negative values for the bluish ones
  • 11.
    CIE LAB Colorspace (1948) Hue (h°): Color has basic difference appearance such as red differ from blue, green or yellow. These distinctions are called Hue Chroma (C): the quantitative attribute of colourfulness, is used to determine the degree of difference of a hue in comparison to a grey colour with the same lightness. The higher the chroma values, the higher is the colour intensity of samples perceived by humans.
  • 12.
    Derived General ObjectiveColour Indices Total Colour Difference  Colour changes can be measured as the modulus of the distance vector between the initial colour values and the actual colour coordinates.  It indicates the magnitude of colour difference between stored and control samples.  Total colour difference (ΔE) is calculated as ΔE>3 Very distinct, 1.5< ΔE < 3  distinct 1.5< ΔE  Small difference
  • 13.
    Whiteness Index (WI) Whiteness indices (WI) are widely measured to yield numbers correlating closely with consumers’ preferences for white colours.  It mathematically combines lightness and yellow– blue into a single term.  The WI represents the overall whiteness of food products that may indicate the extent of discoloration during the drying process.  WI indicates the degree of whiteness
  • 14.
    Yellowness Index (YI) Yellowness is associated with scorching, soiling, and general product degradation by light, chemical exposure and processing.  Yellowness indices are used chiefly to quantify these types of degradation with a single value.  They can be used when measuring clear, near- colourless liquids or solids in transmission and near- white, opaque solids in reflectance
  • 15.
    Browning Index (BI) The browning index (BI) is used to characterise the overall changes in browning colour  It is defined as brown colour purity and is one of the most common indicators of browning in food products containing sugar.  Enzymatic browning has been quantified using browning indicators through a biochemical index (PPO activity)  Browning Index Based on CIE L*a*b* Coordinates