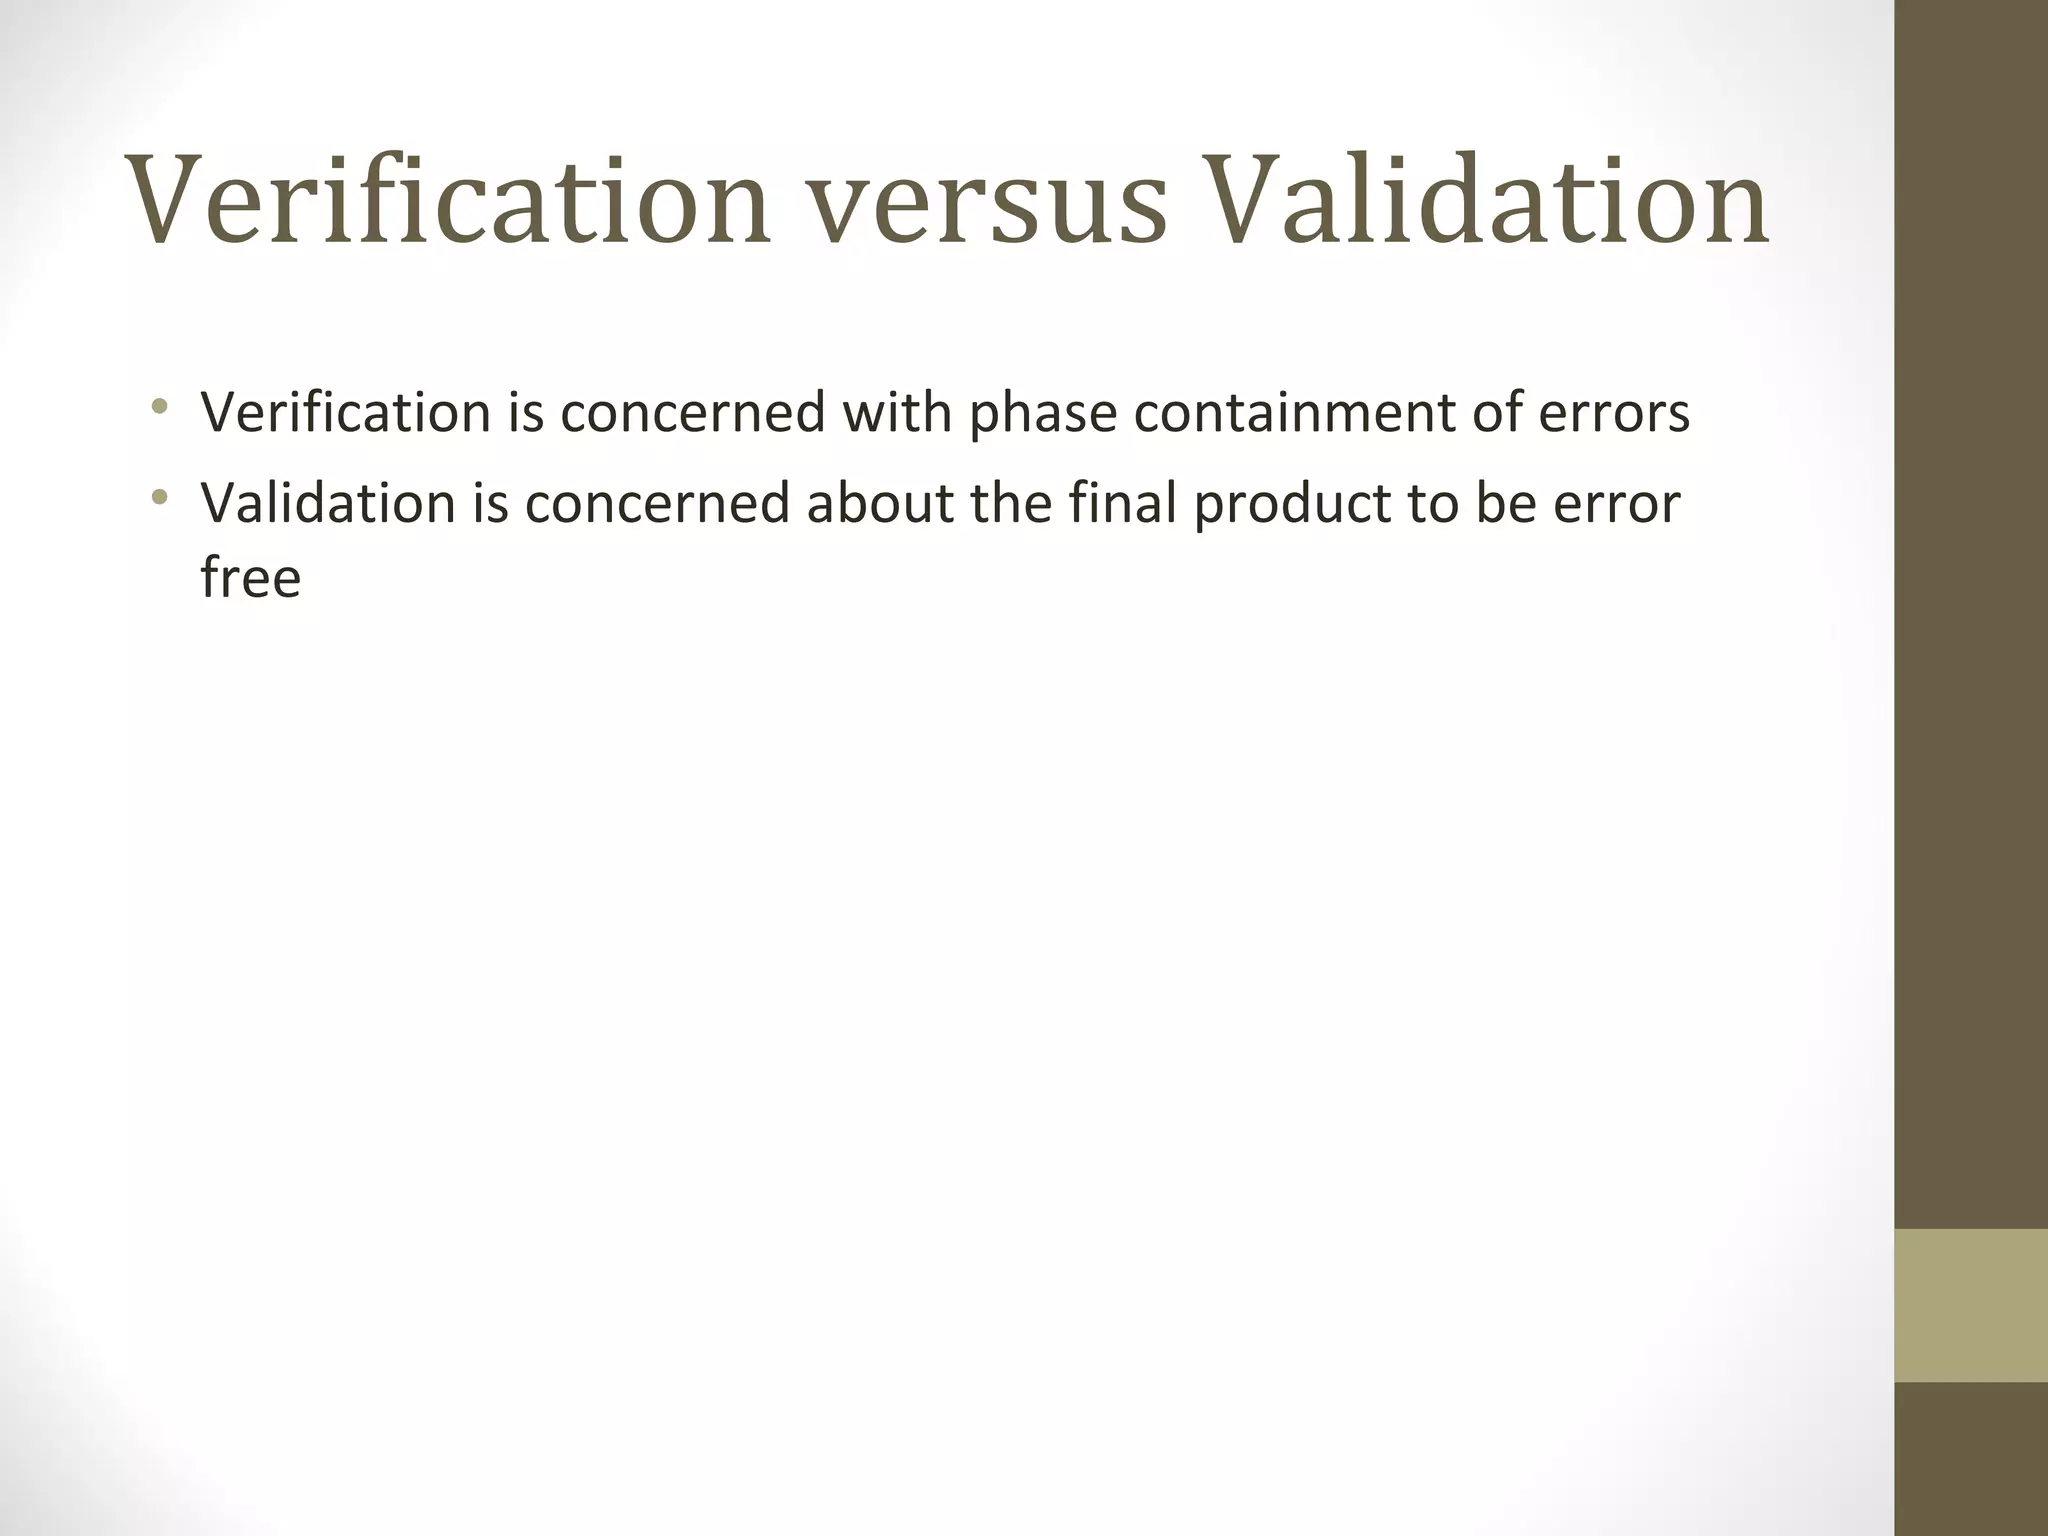
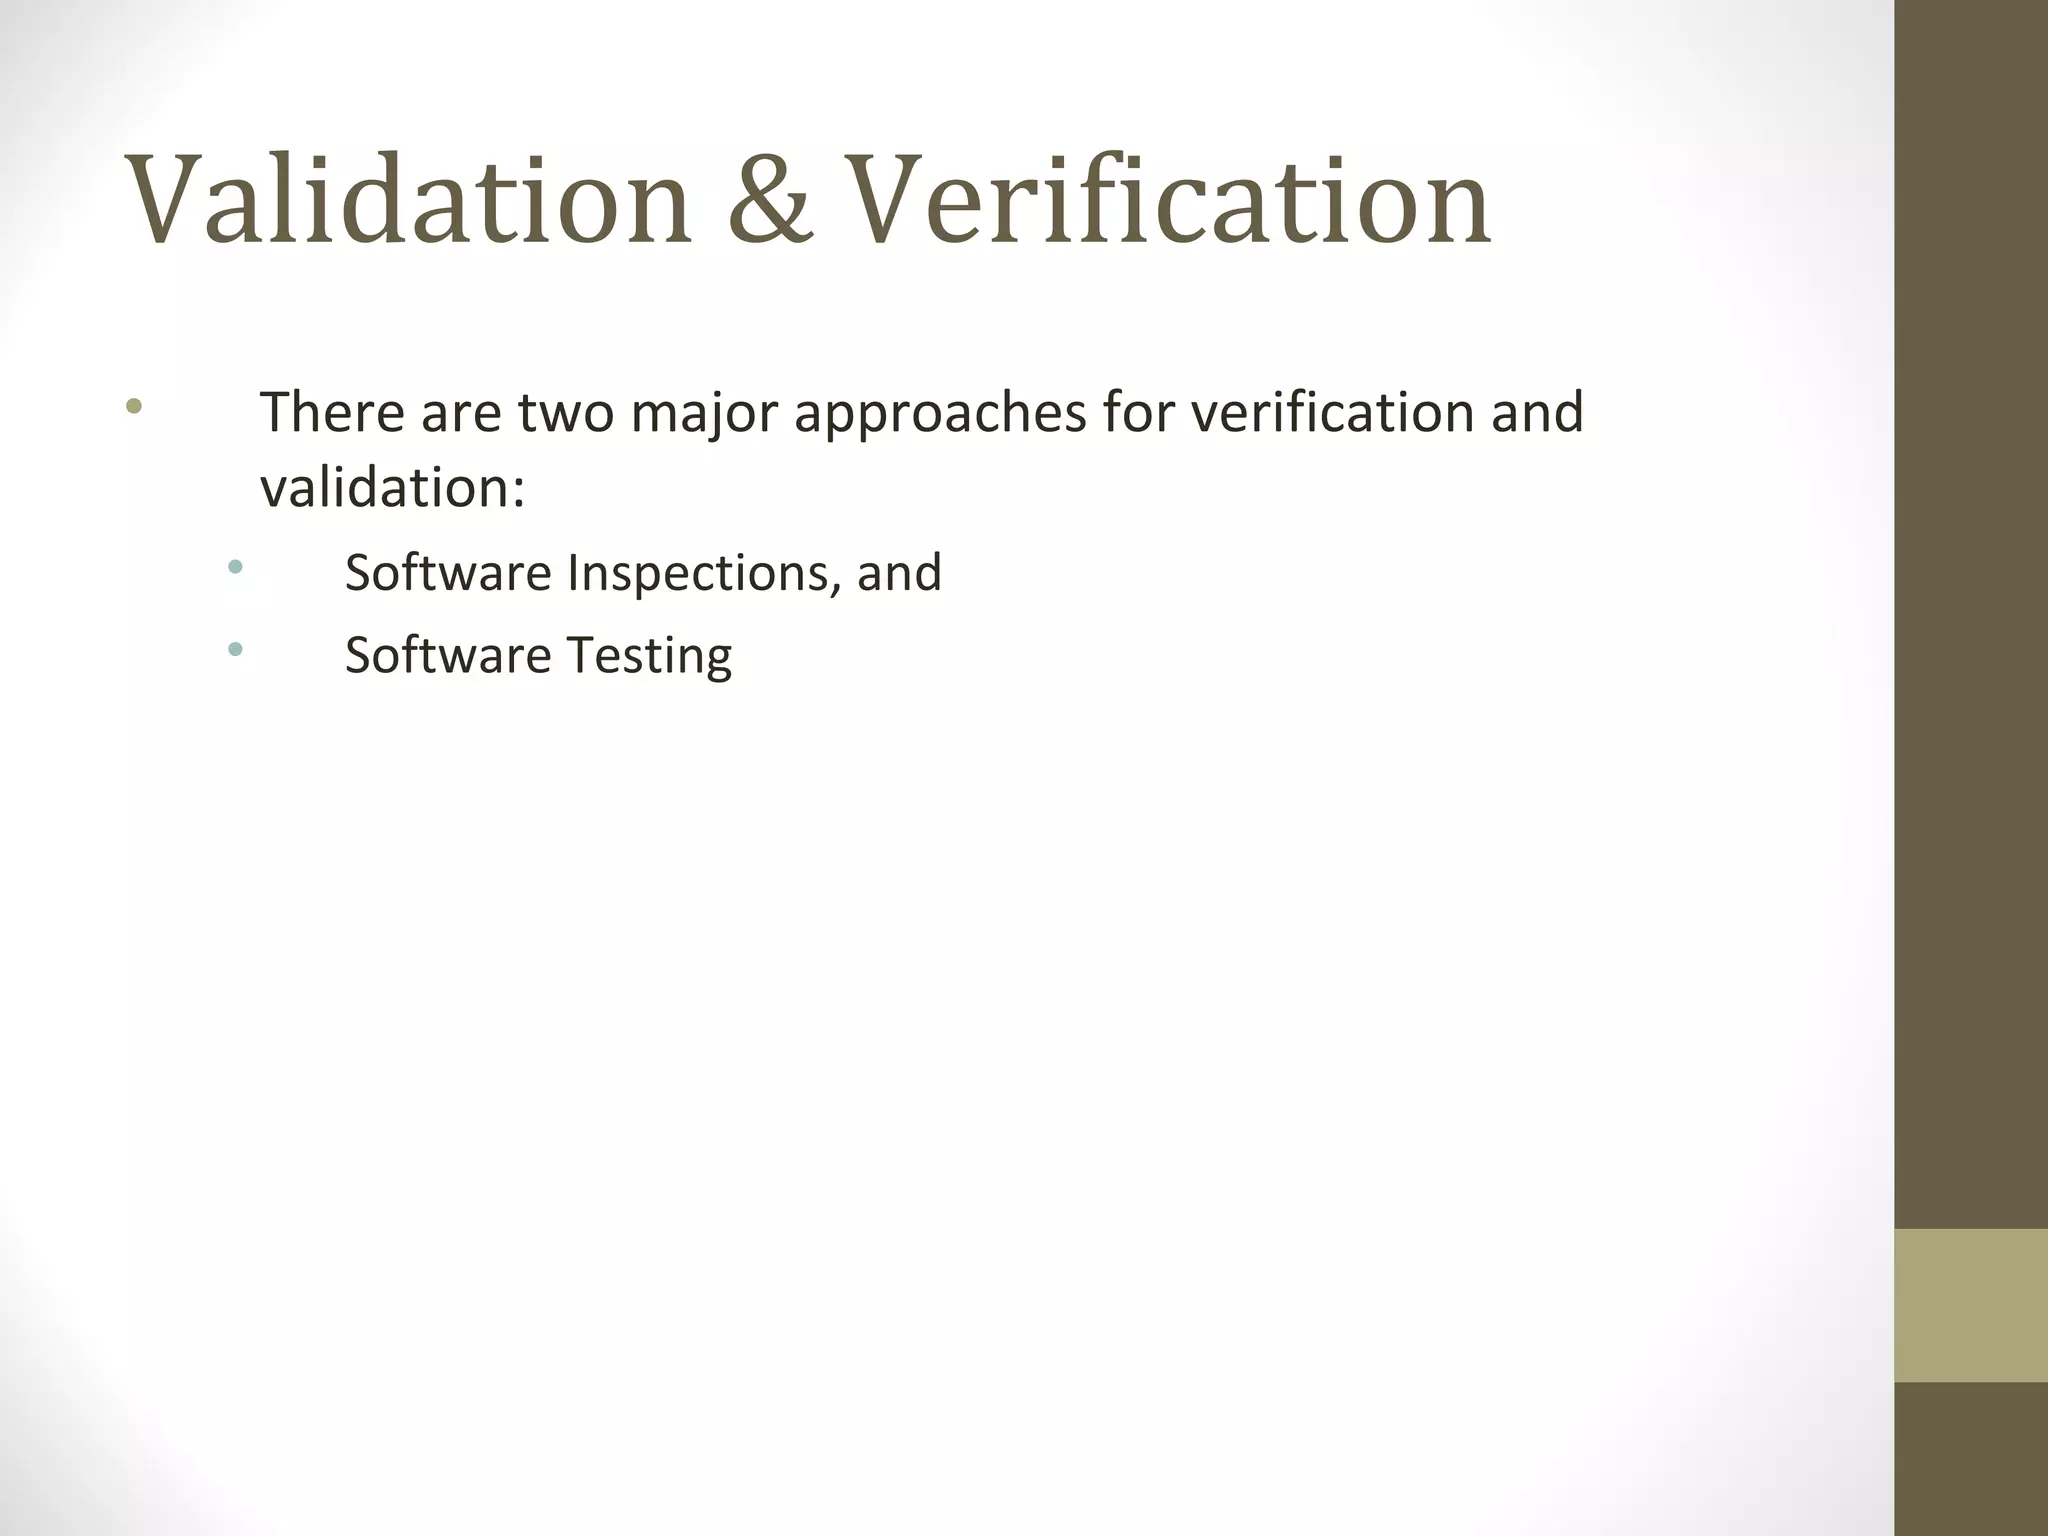
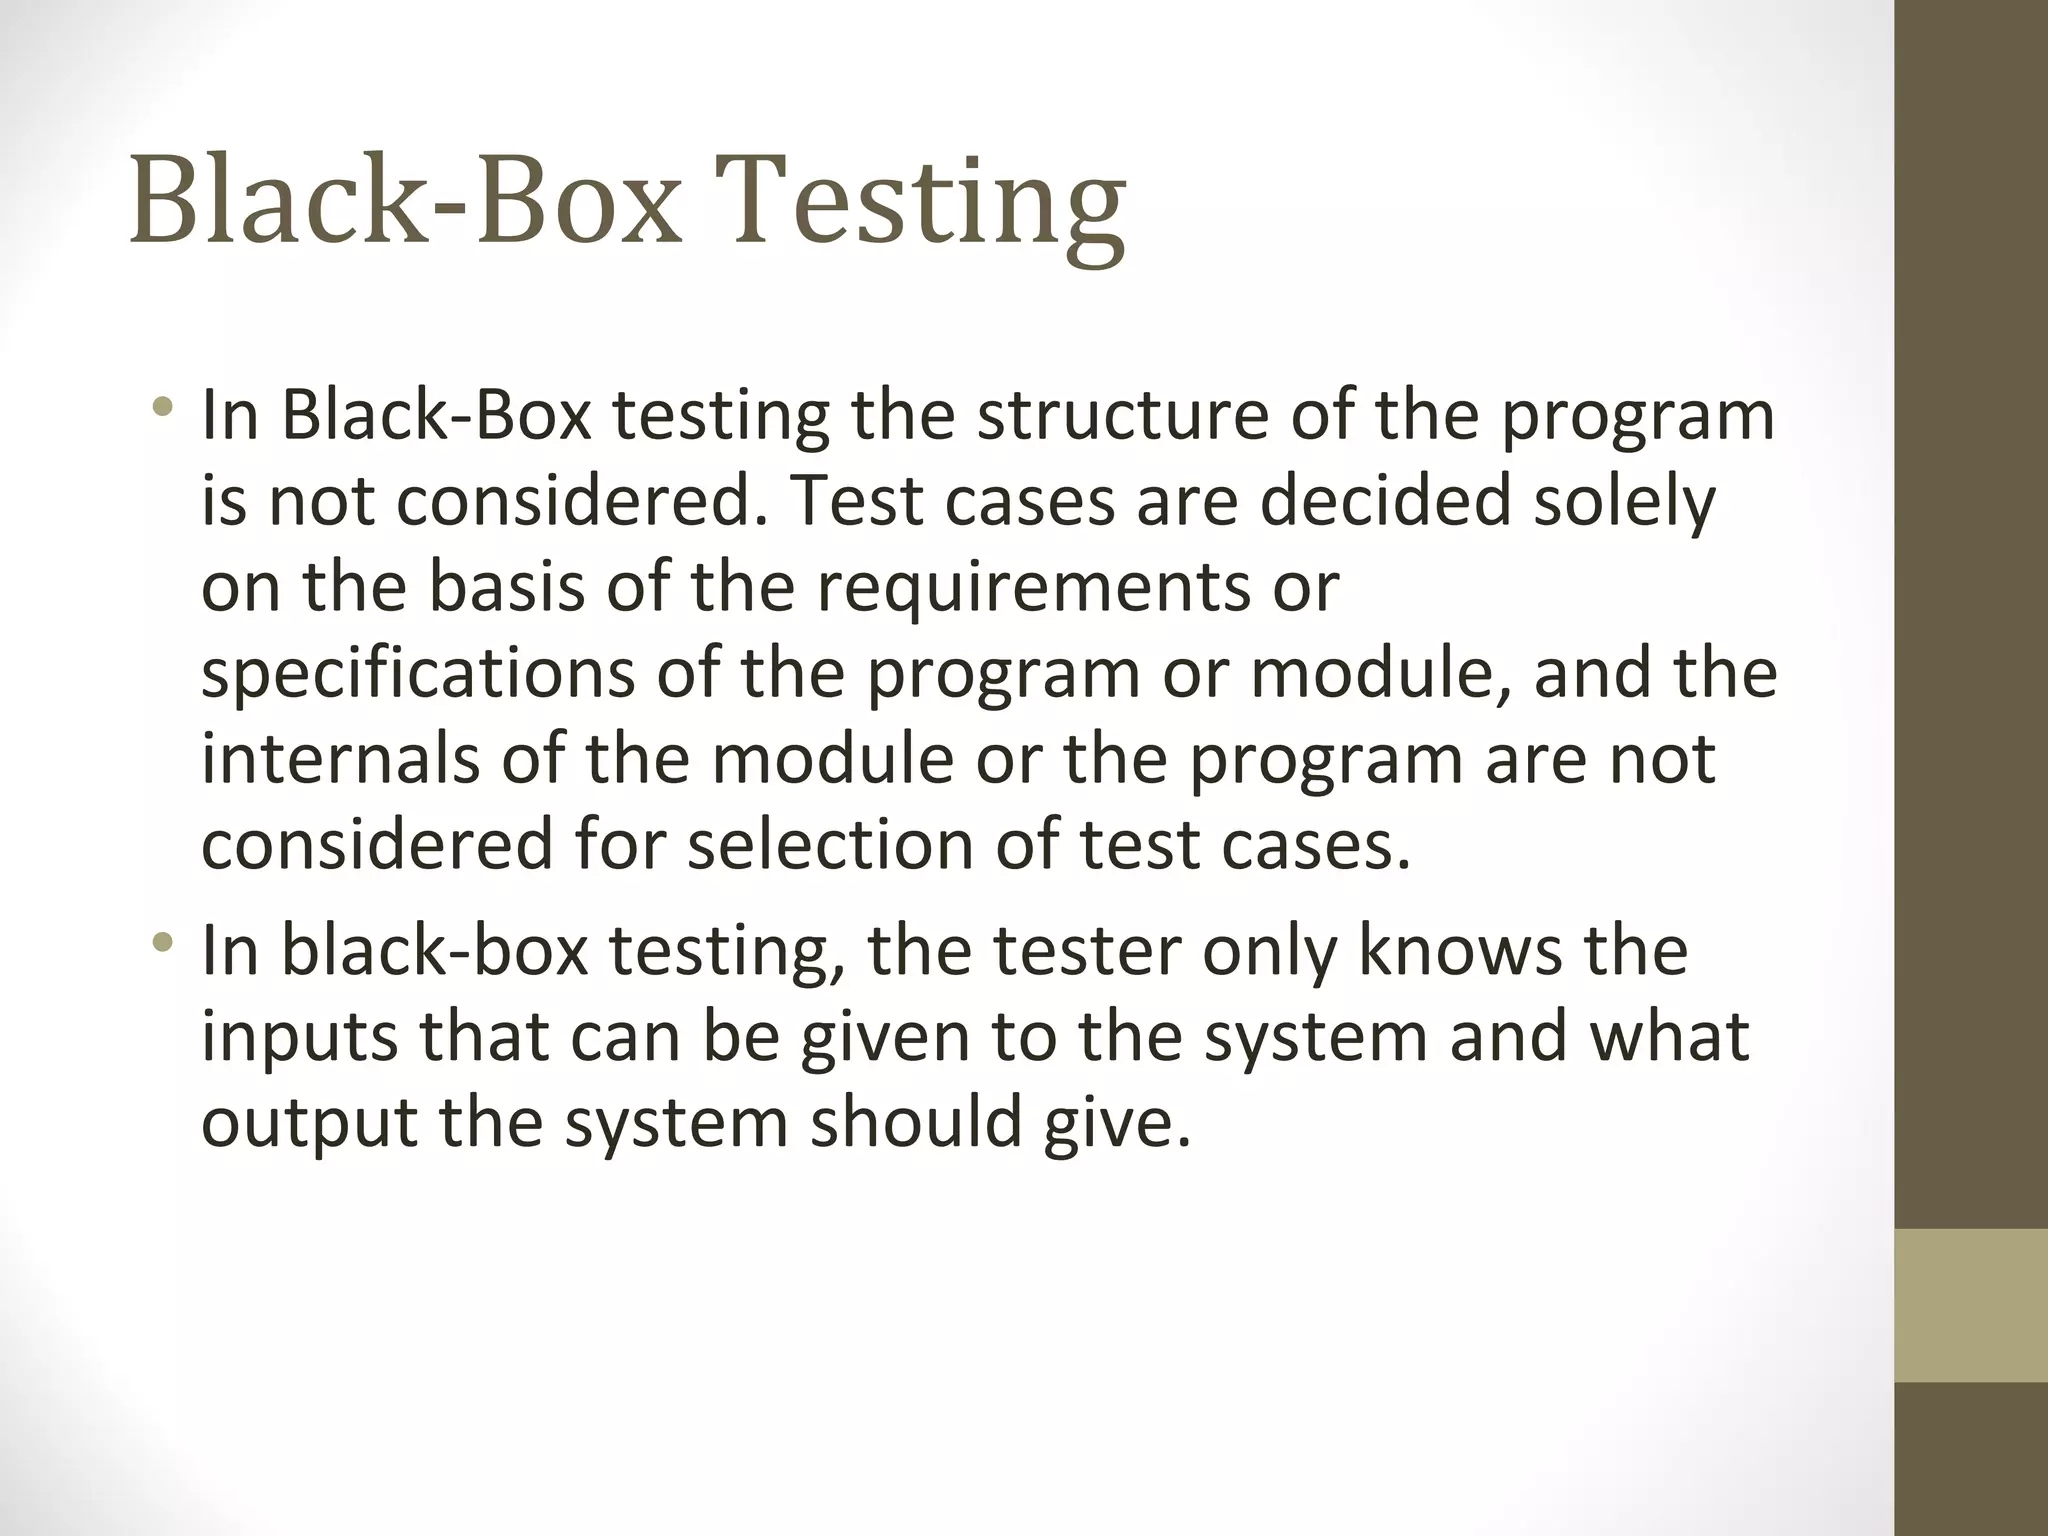
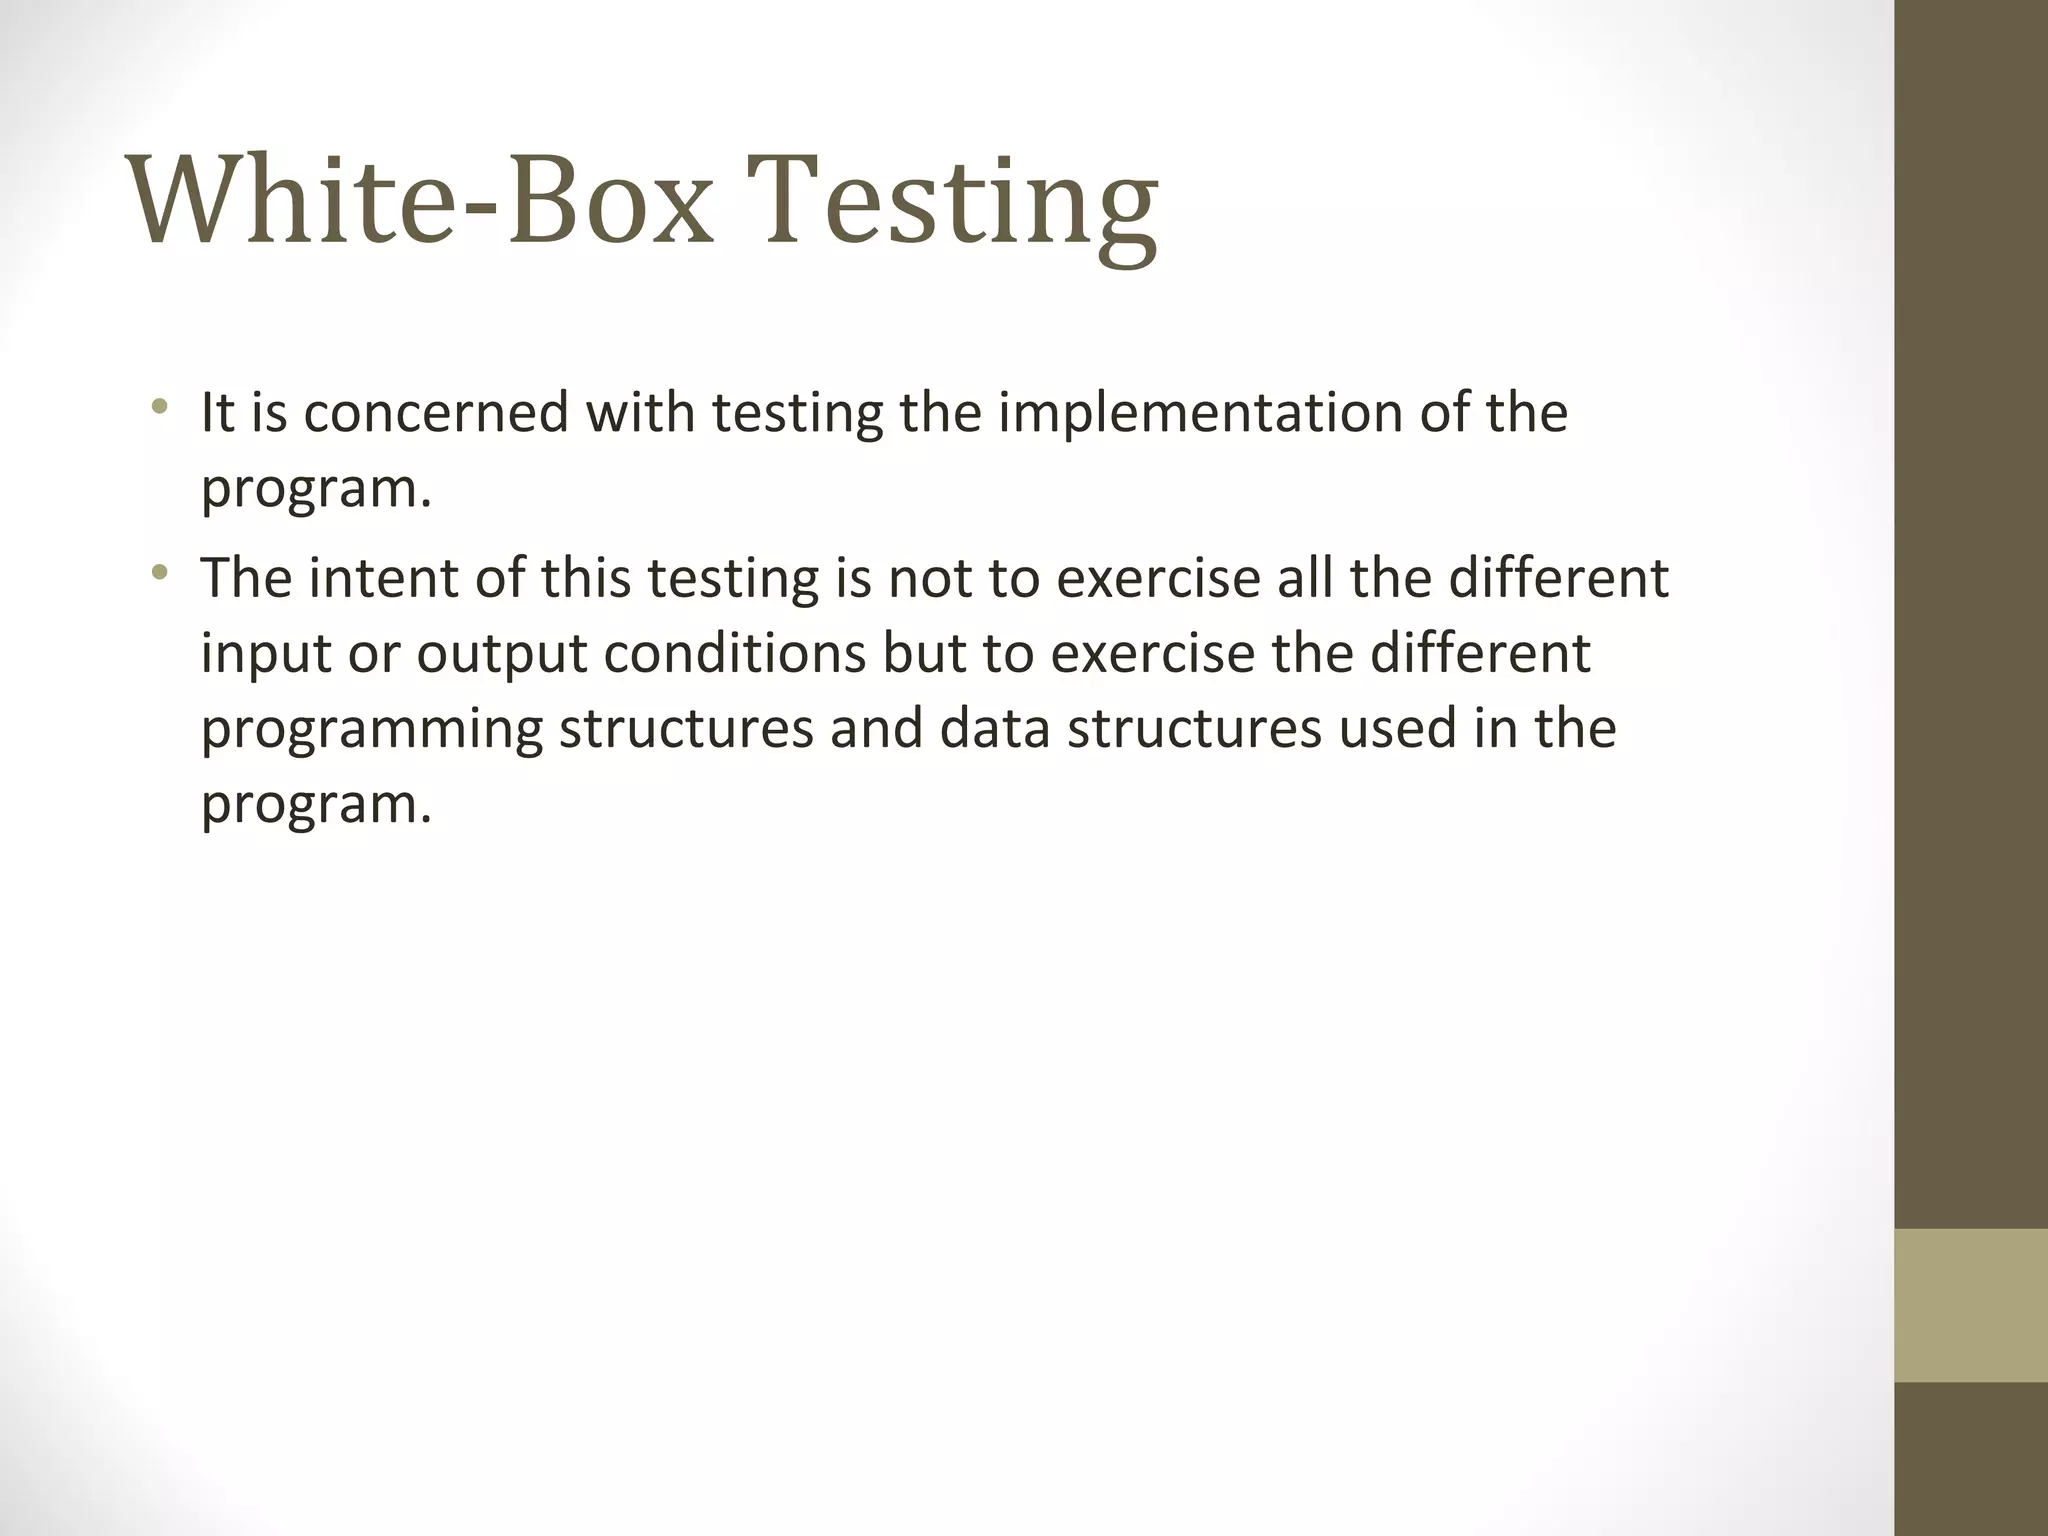
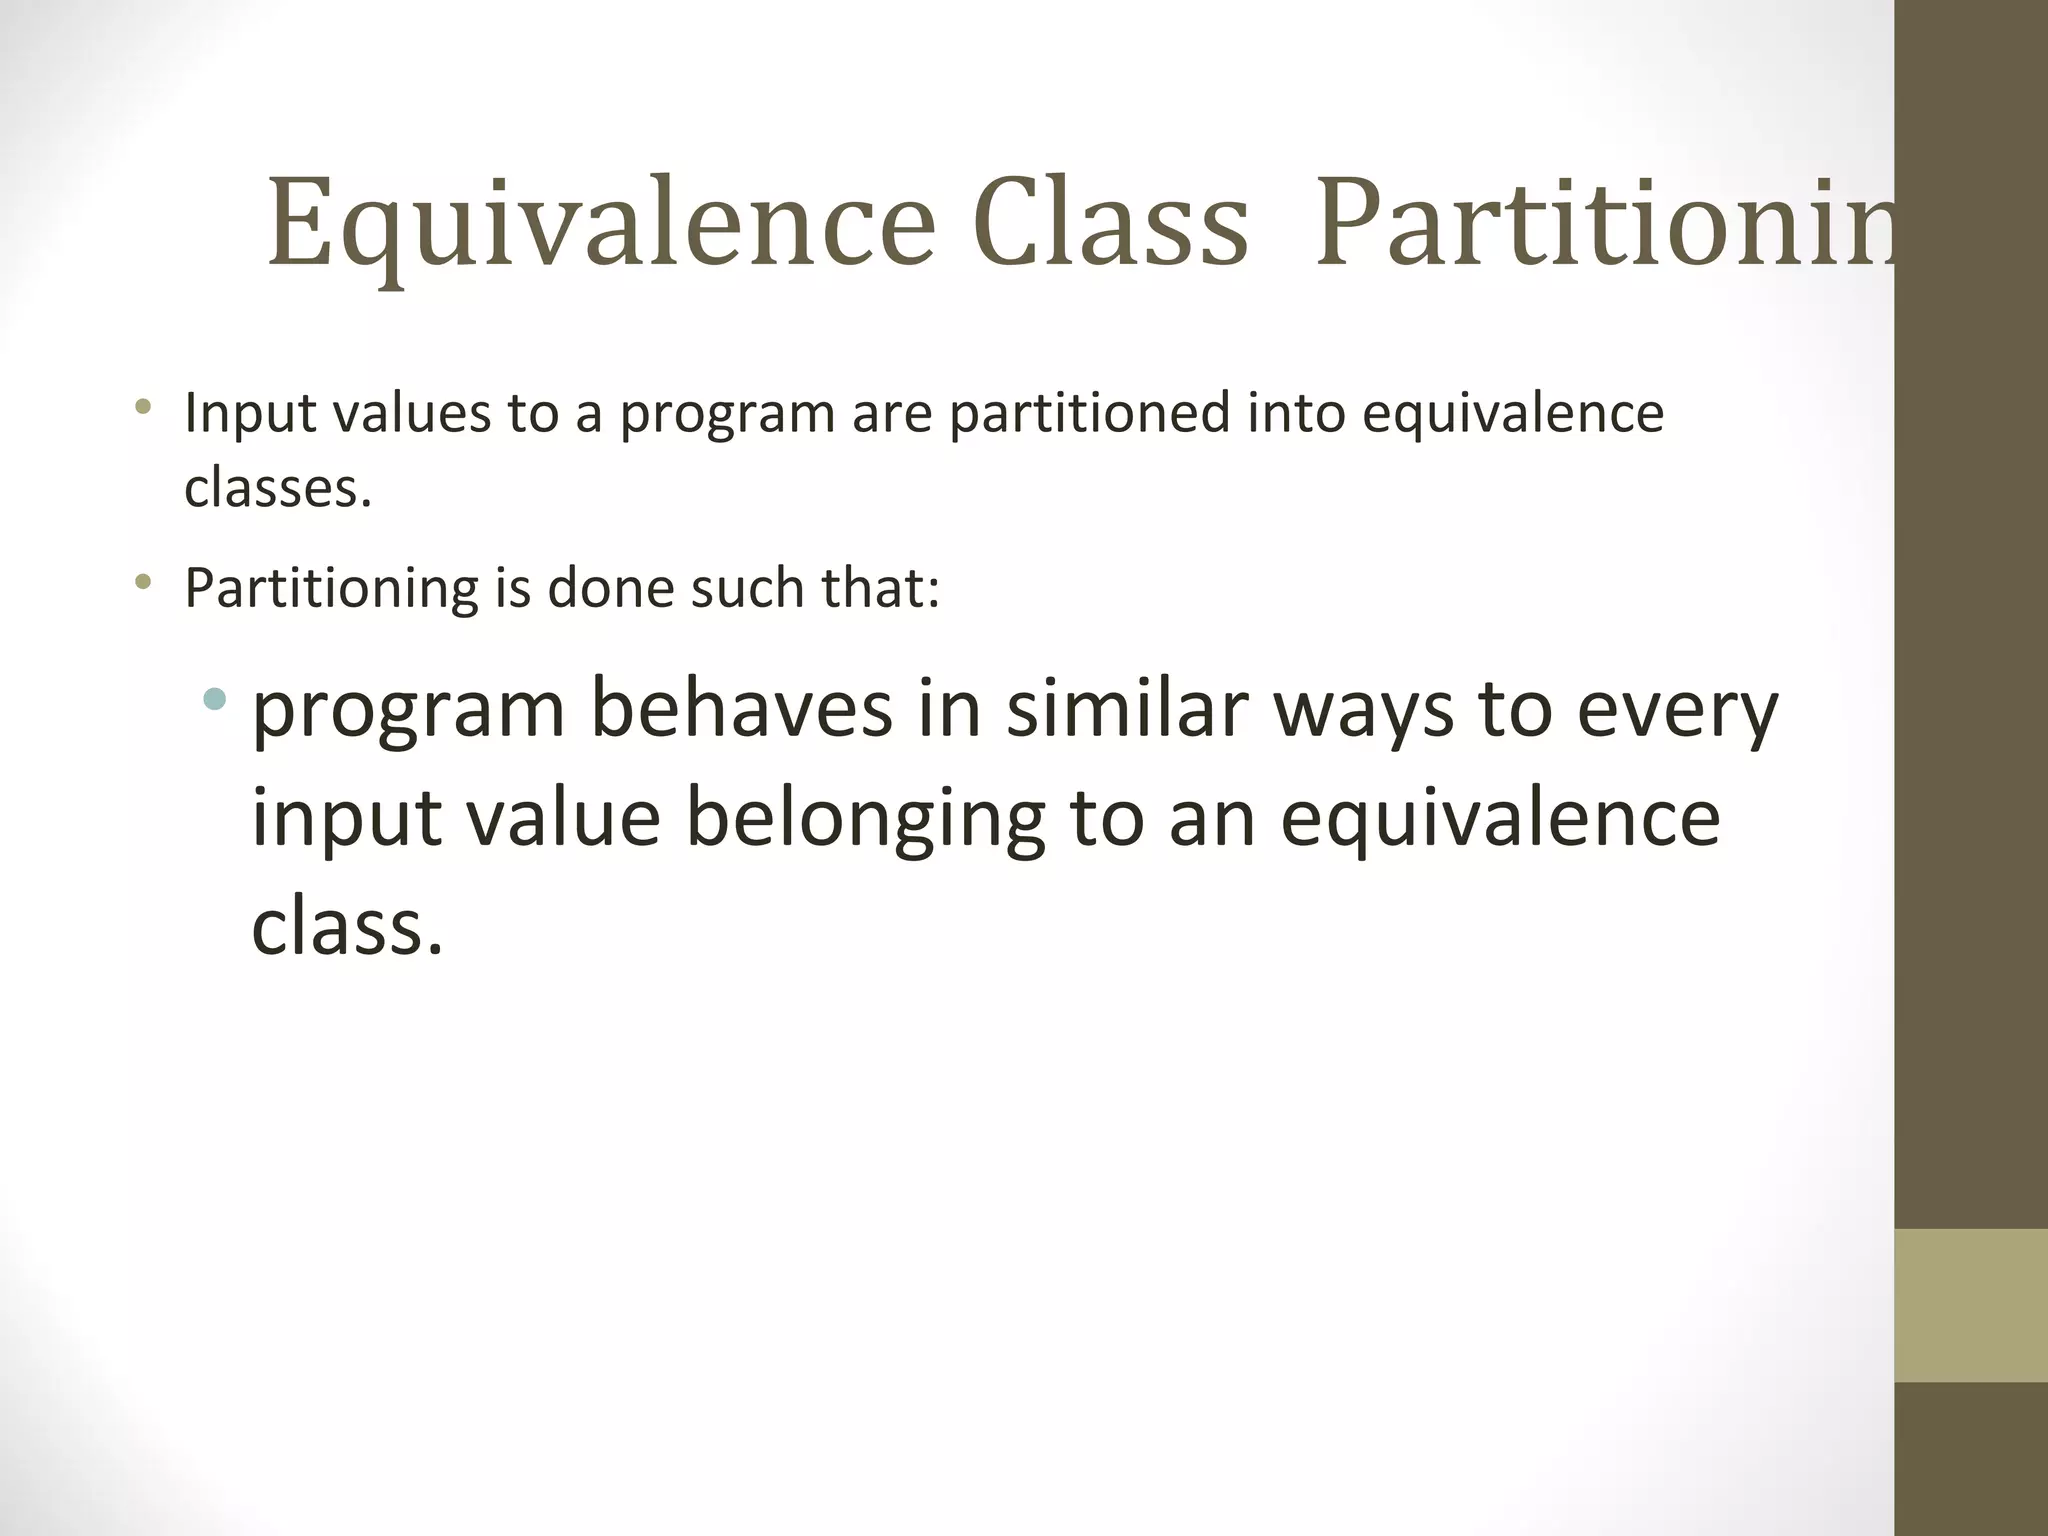
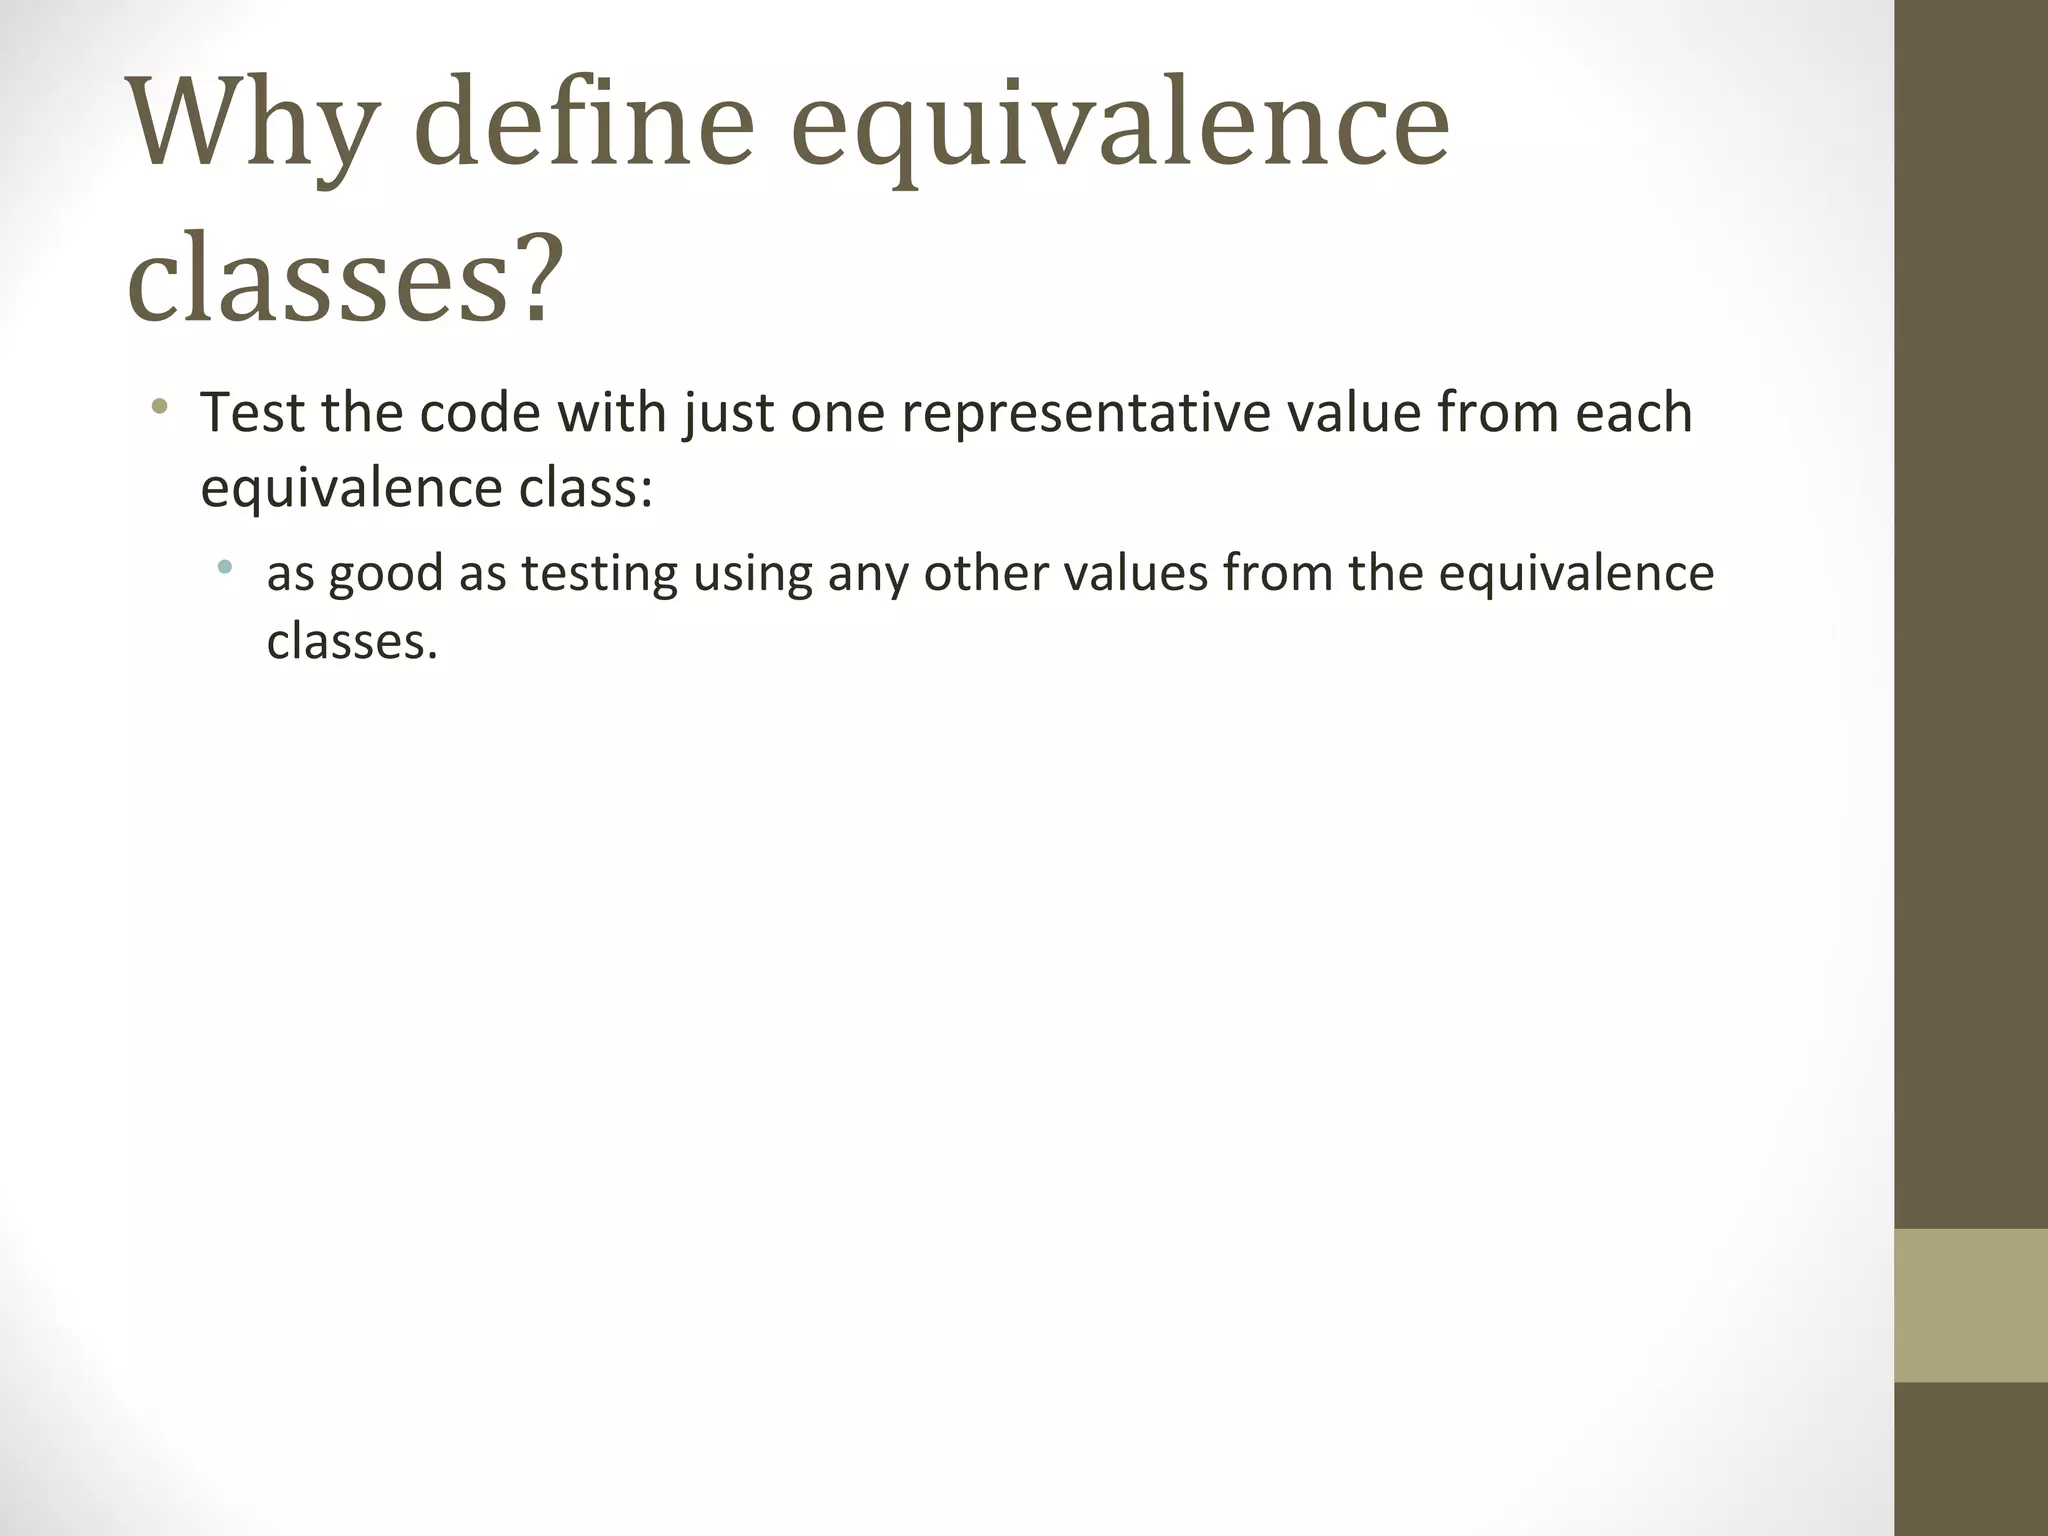
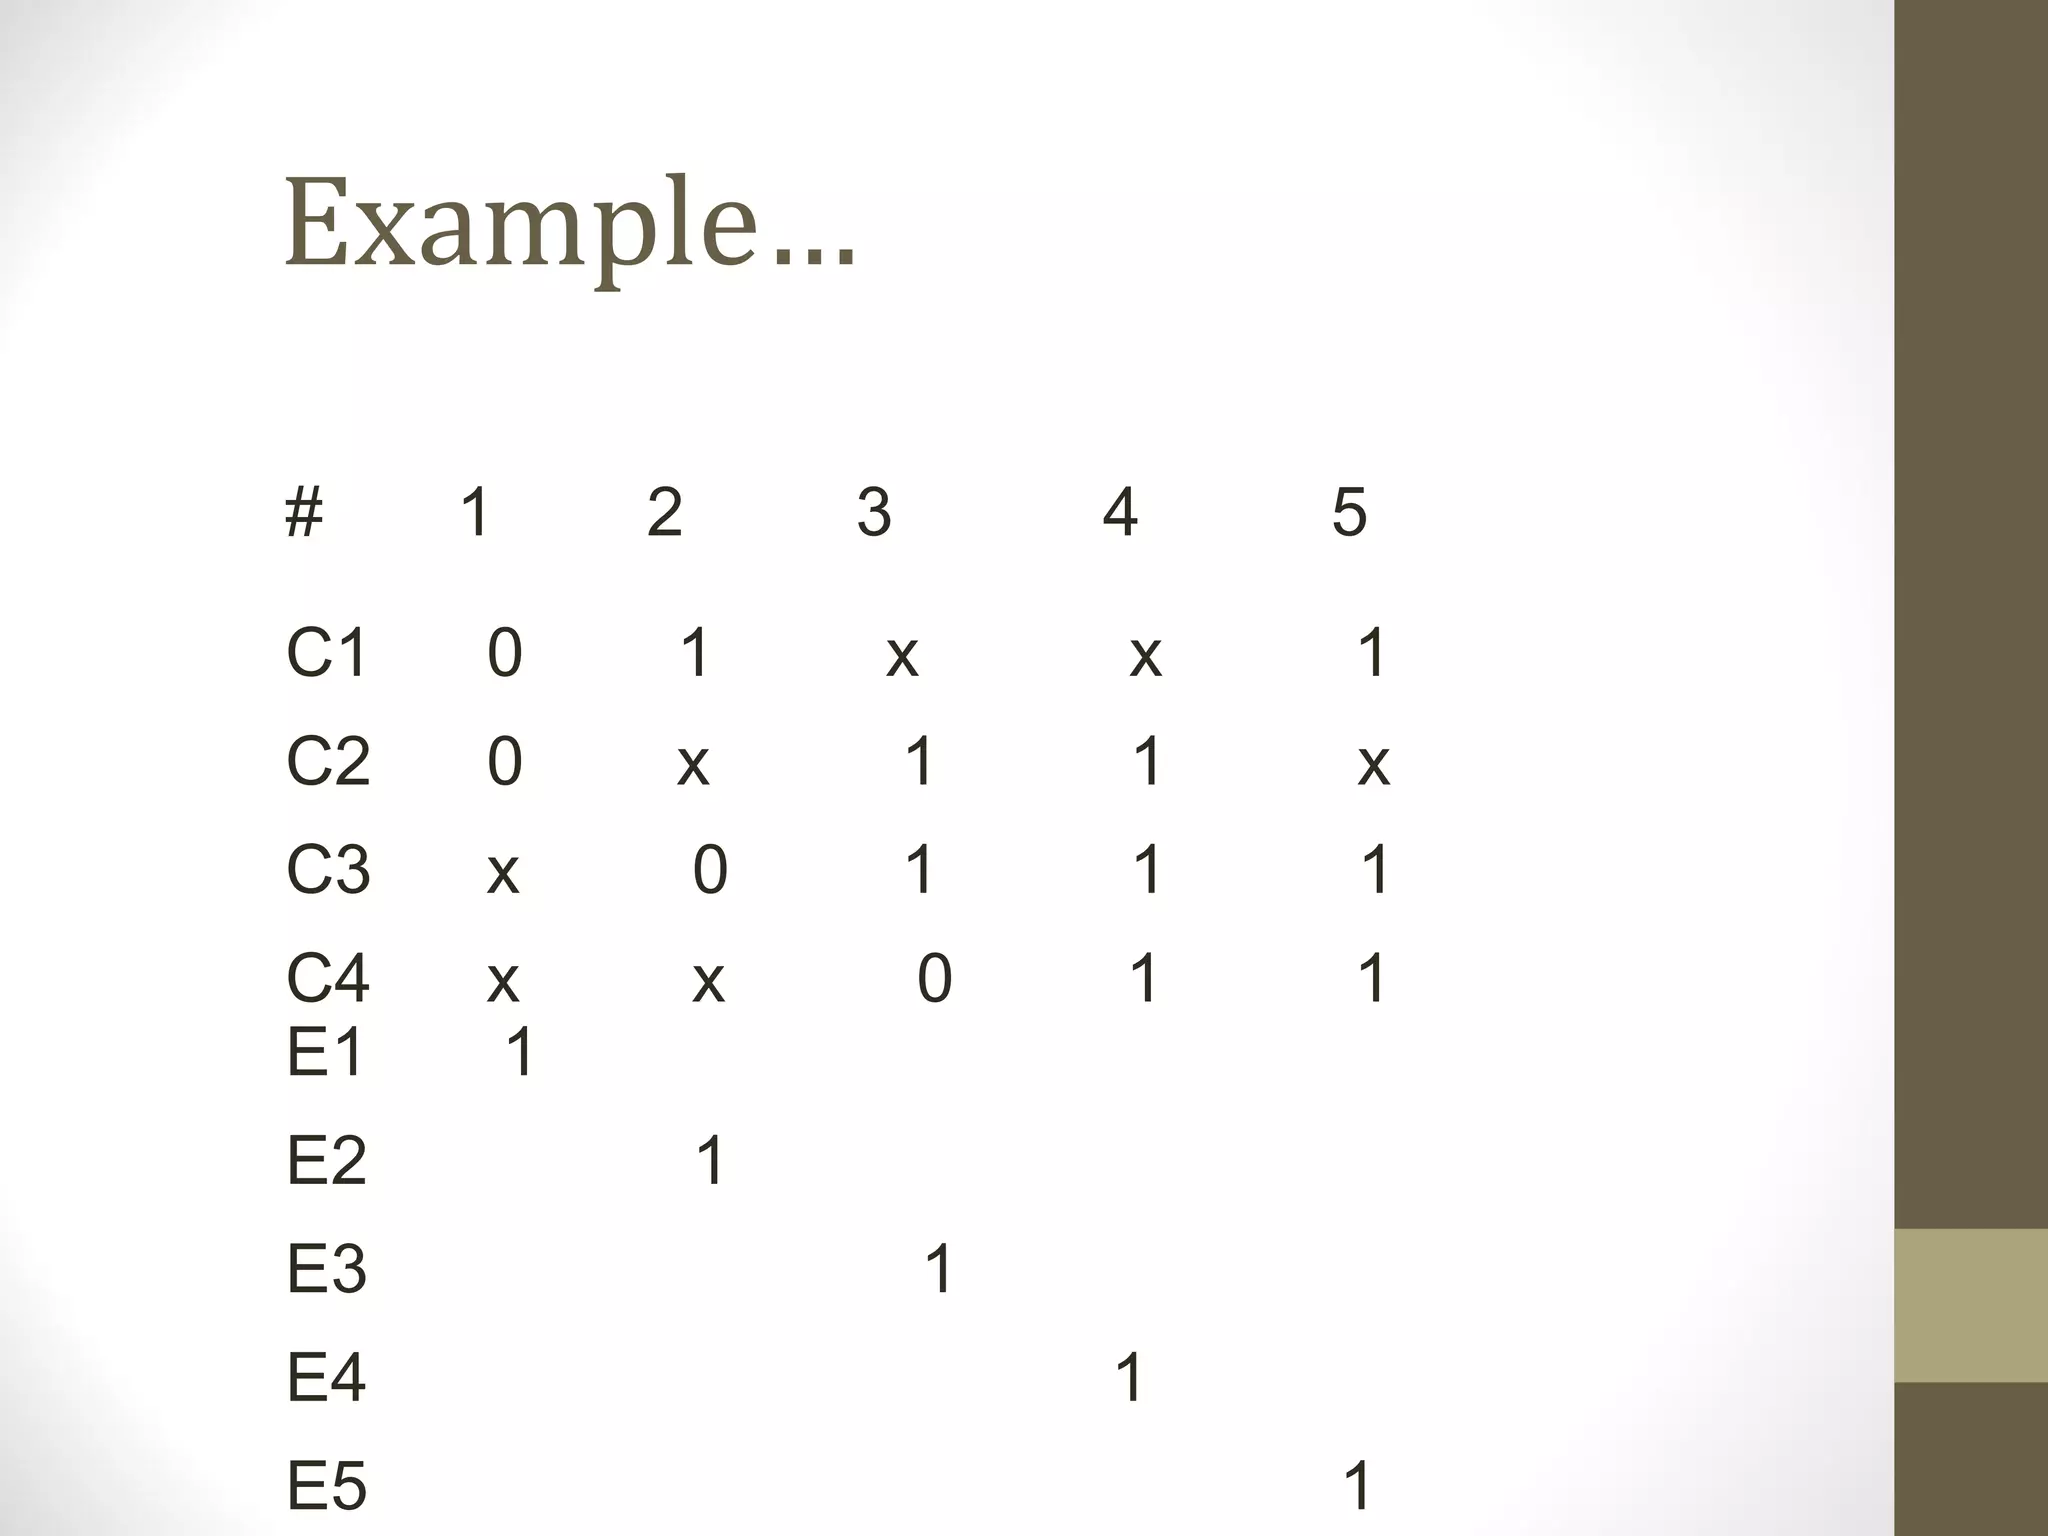
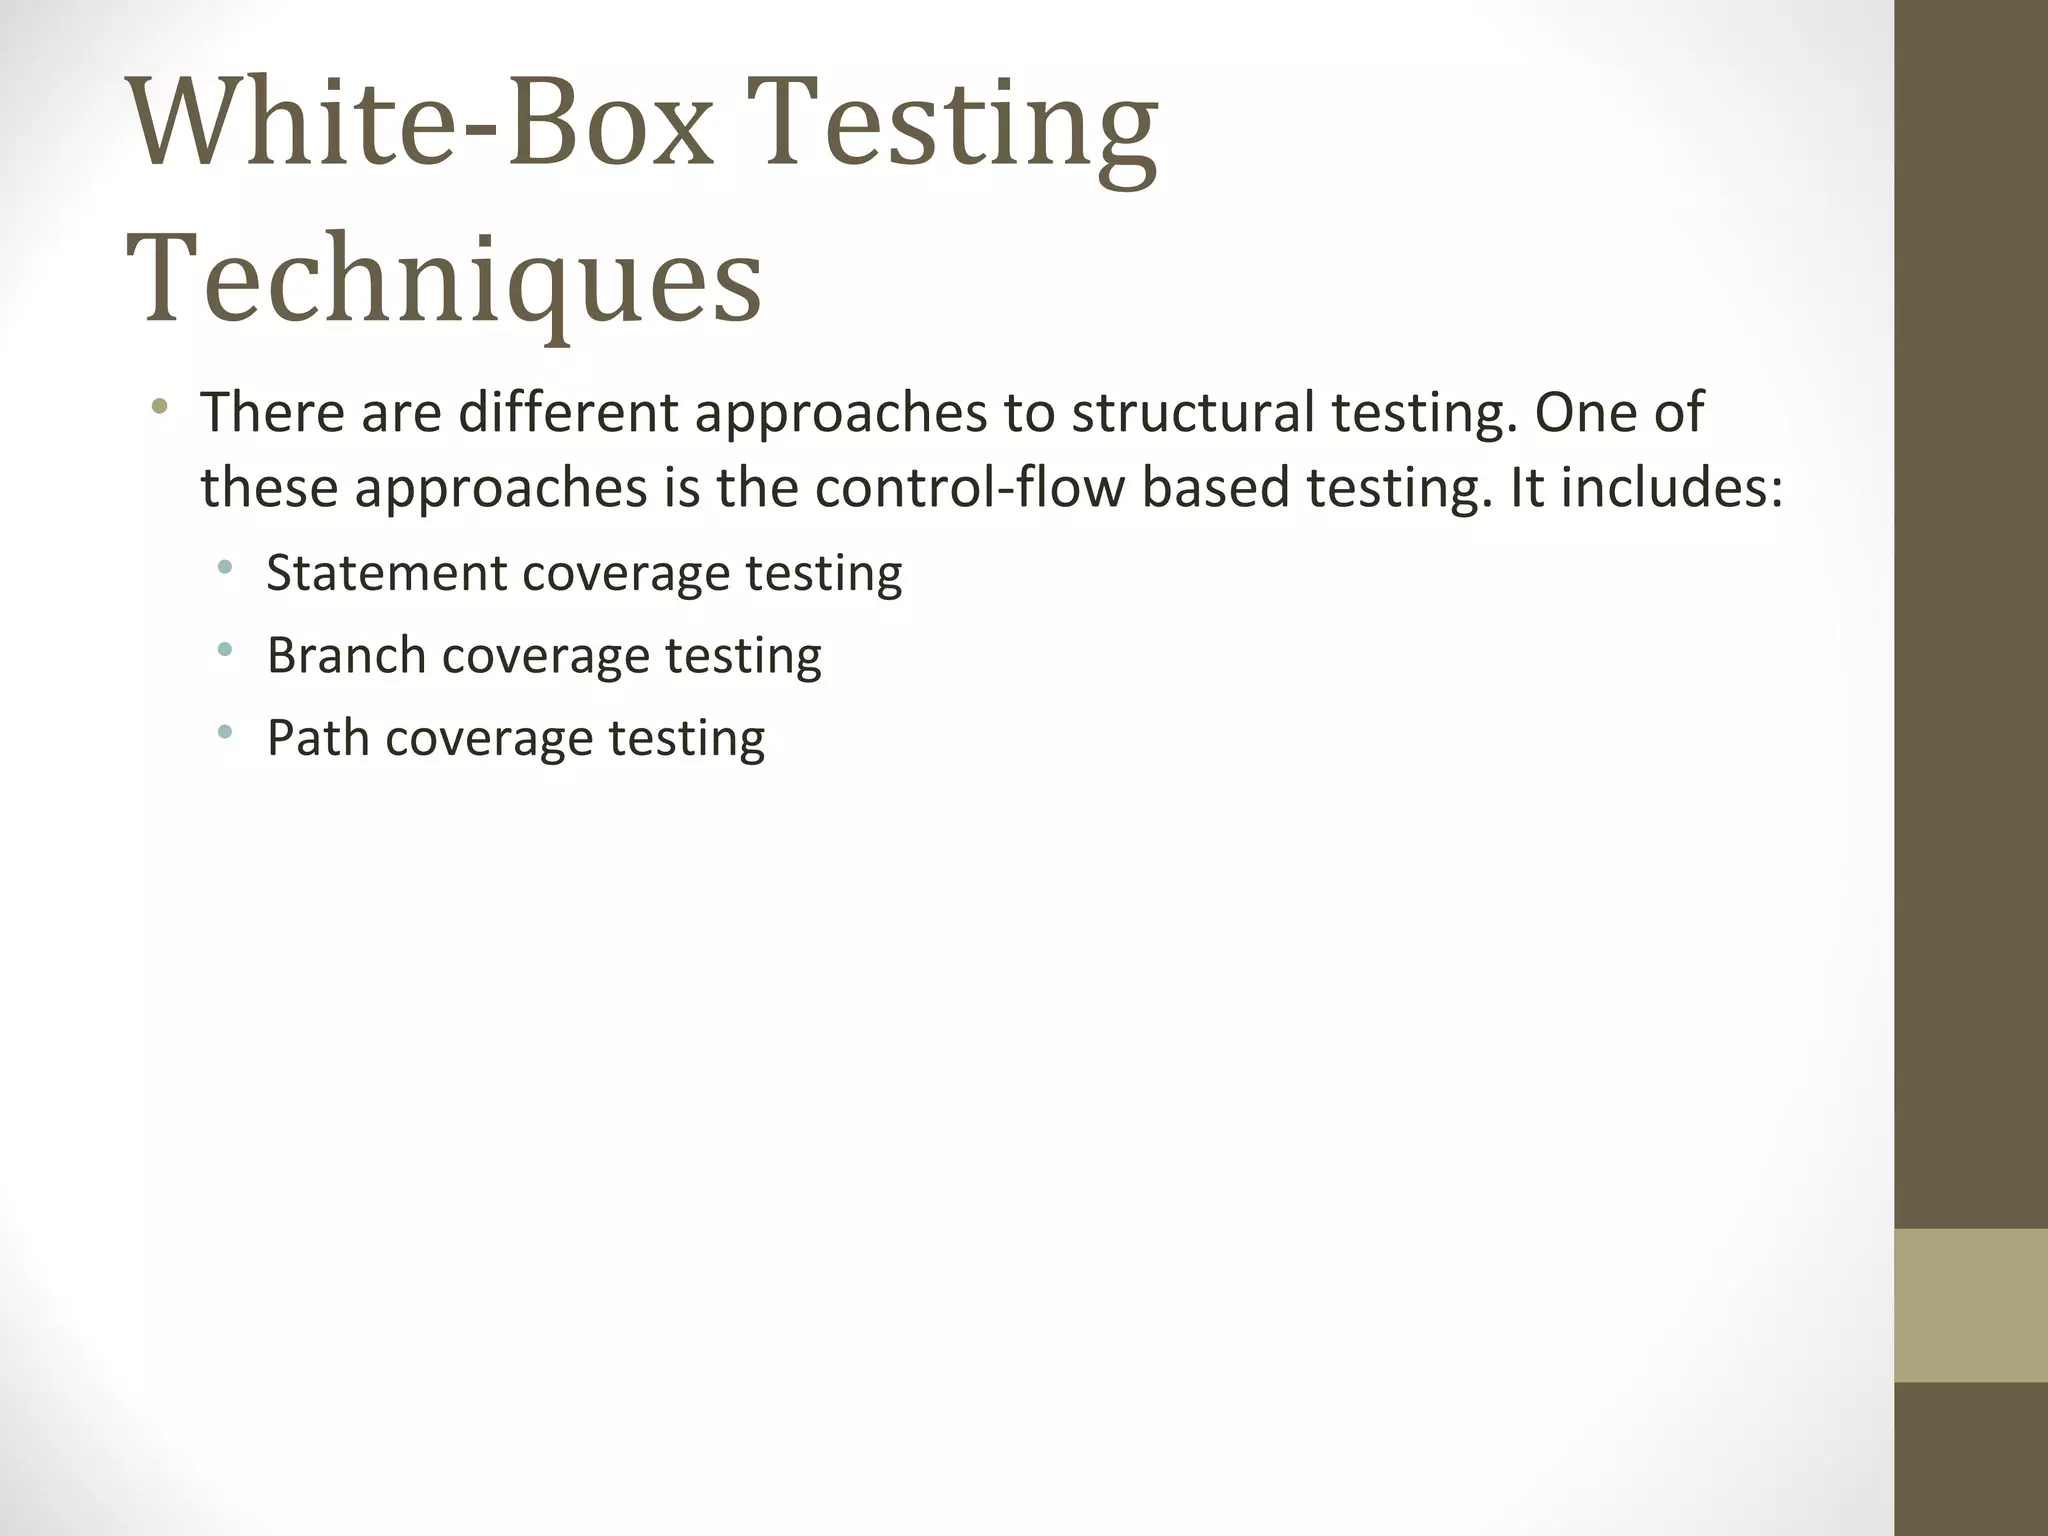
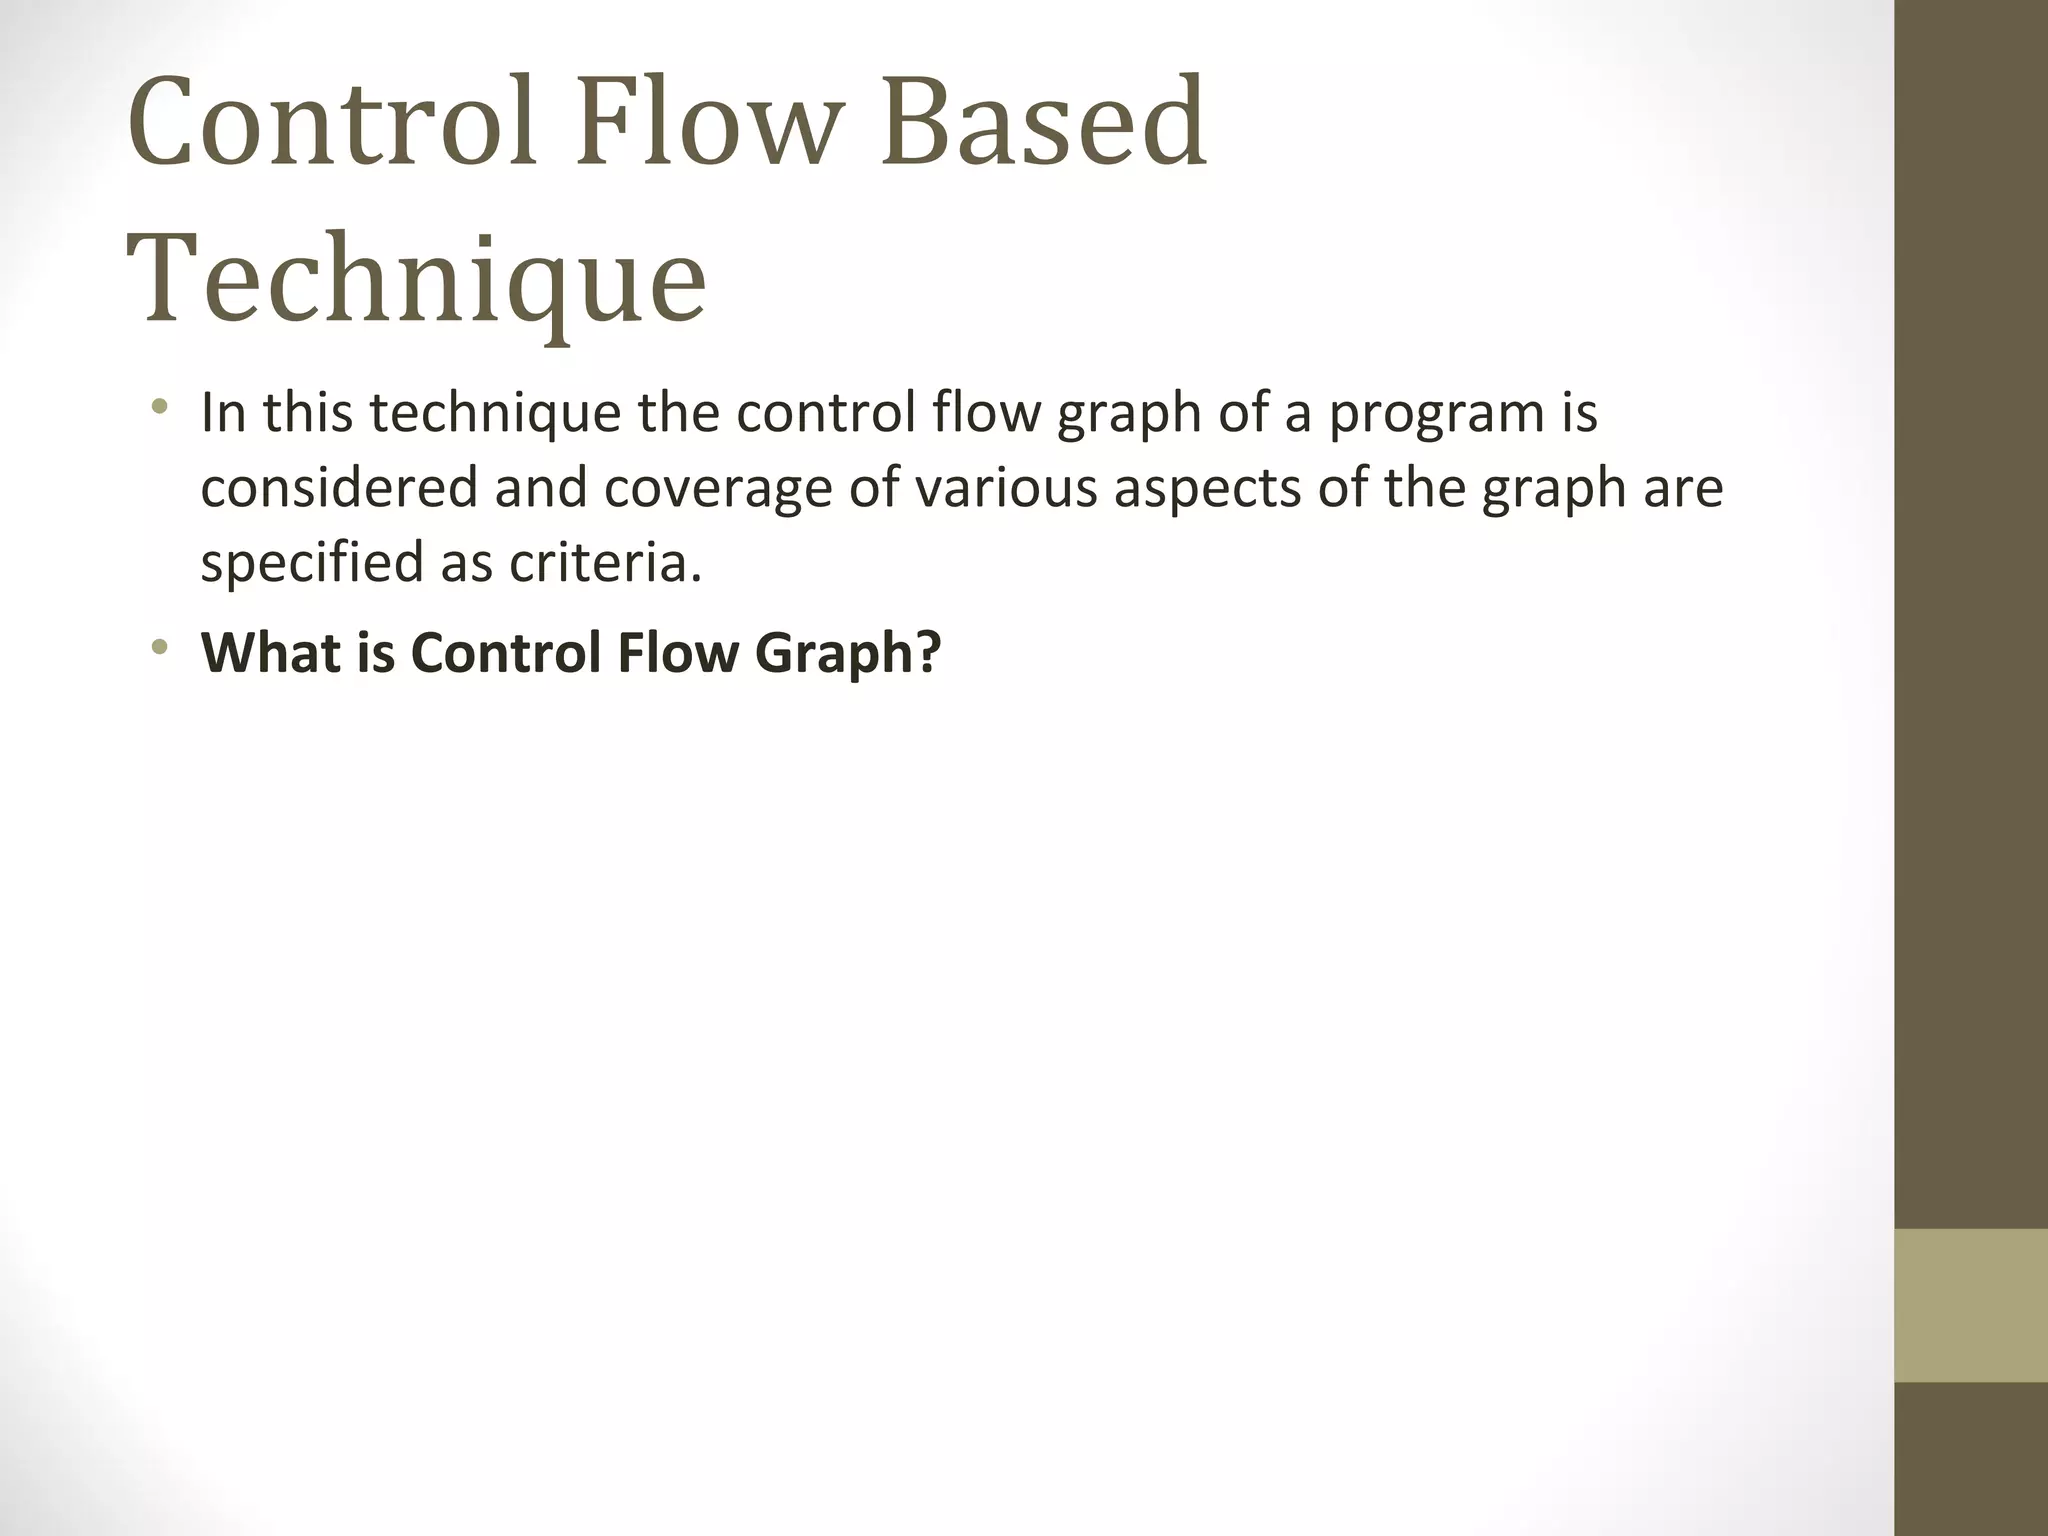
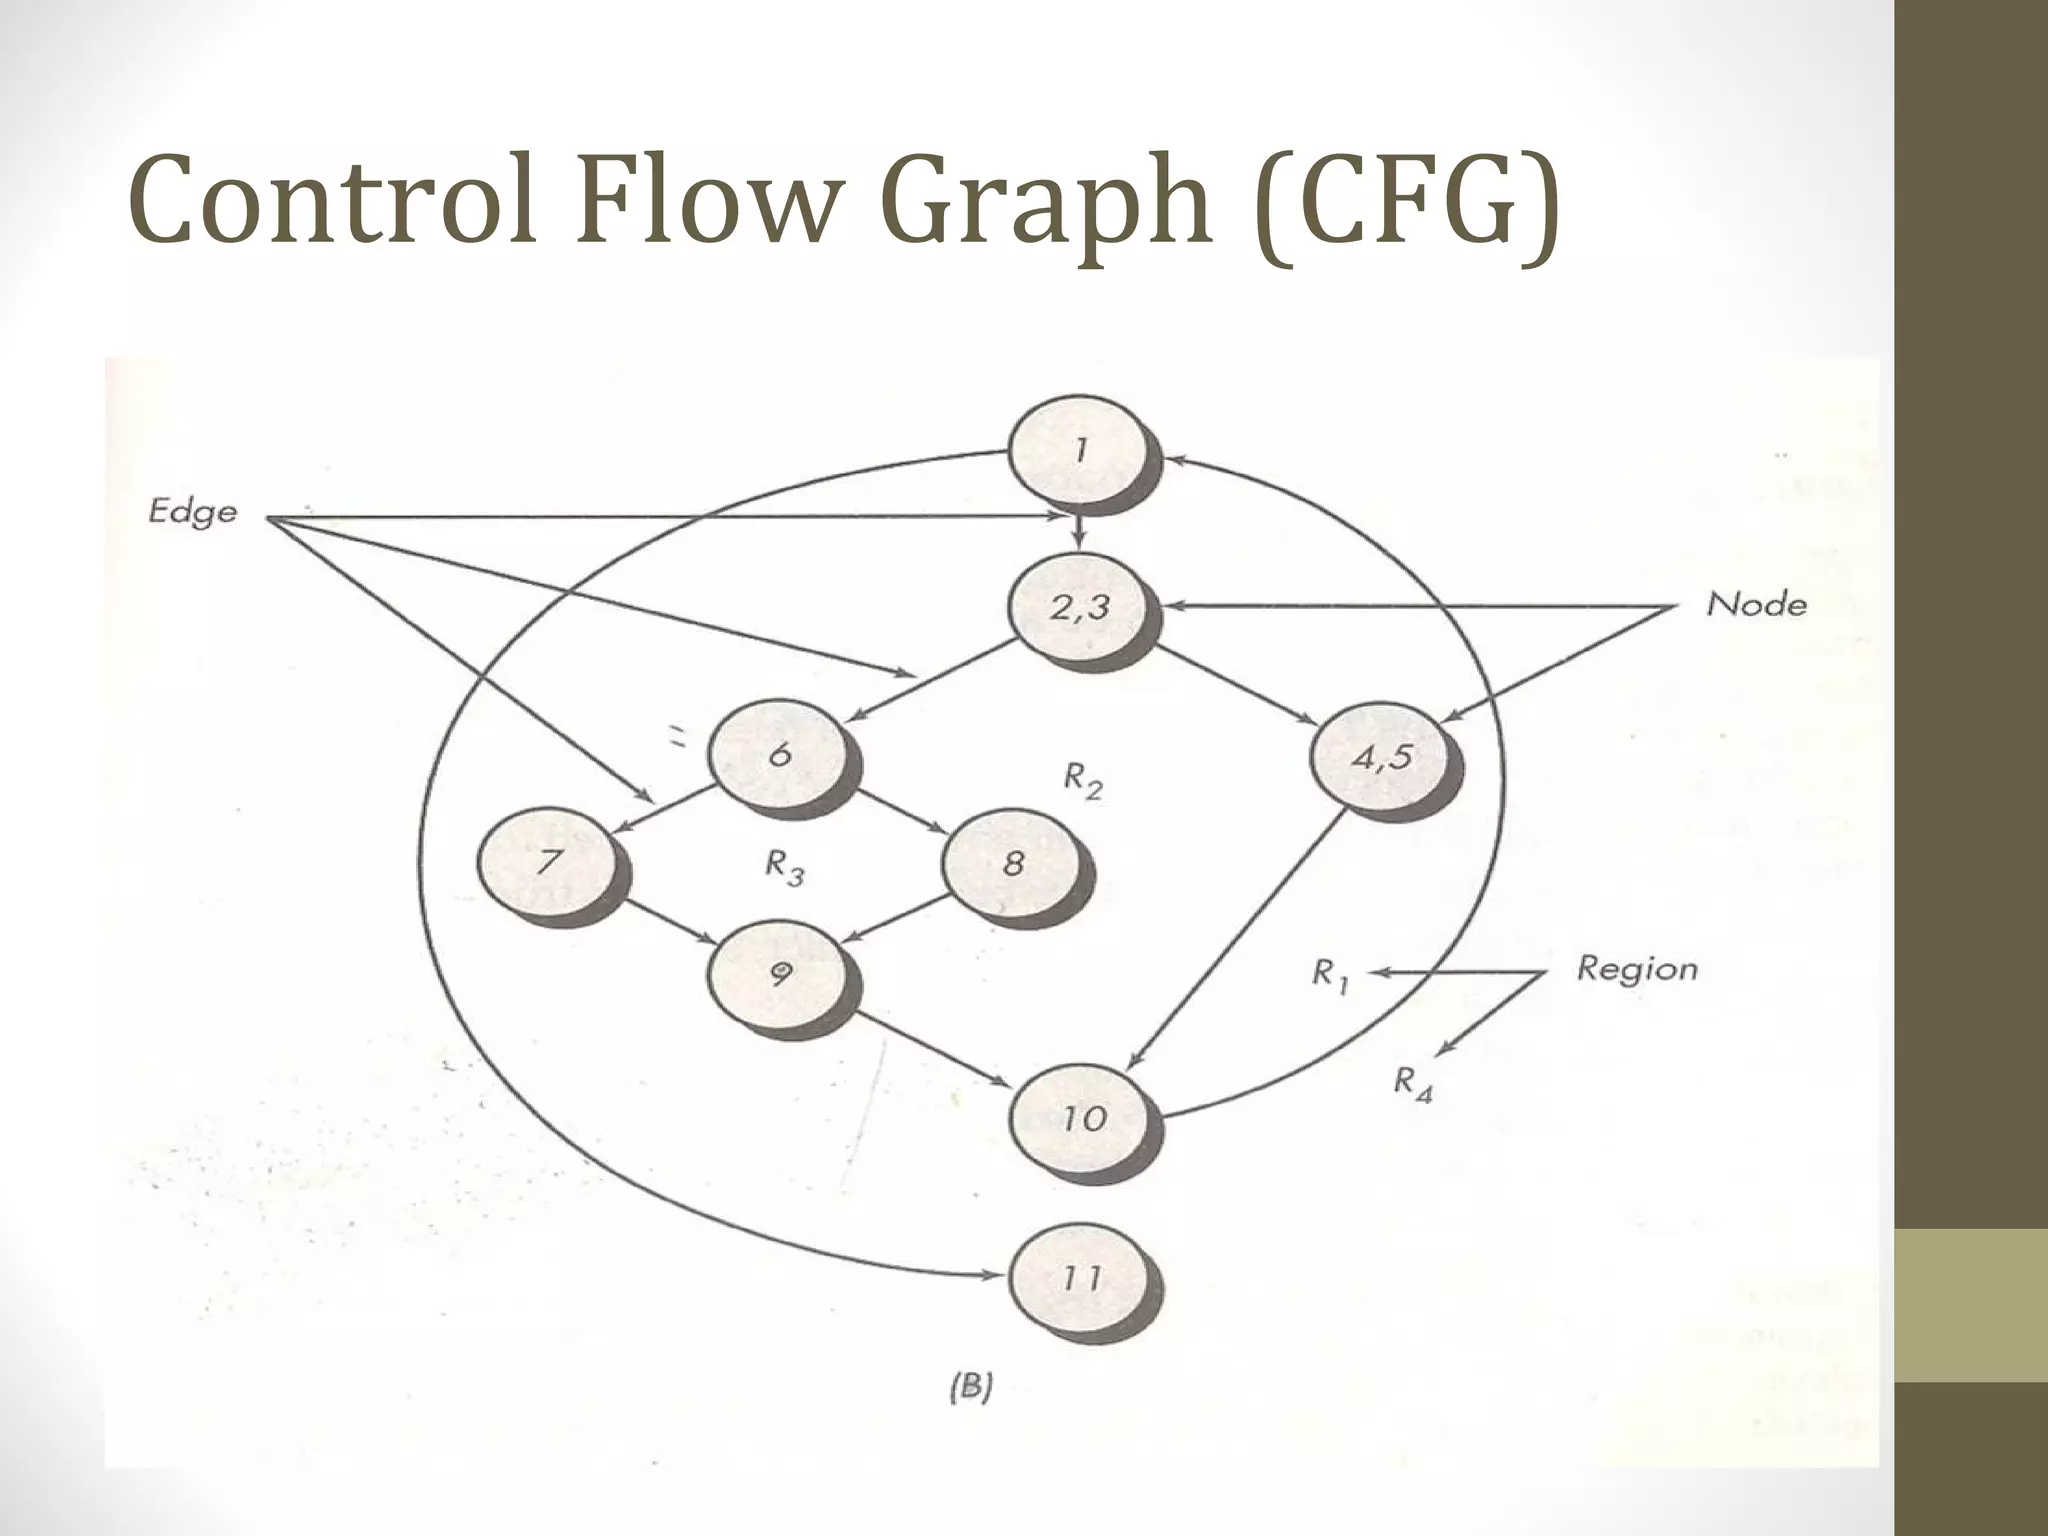
Testing
Indu Sharma
HOD(CSE)
CPTC,Rajsamand
Validation & Verification
• Verification
• “Are we building the product right?”
• Ensure software meet specification (error-free)
• Process of determining whether output of one
phase of development conforms to its previous
phase.
• Validation
• “Are we building the right product?”
• Ensure software meets customer’s needs
• Process of determining whether a fully developed
system conforms to its SRS document
Verification versus Validation
• Verification is concerned with phase containment of errors
• Validation is concerned about the final product to be error
free
Validation & Verification
• There are two major approaches for verification and
validation:
• Software Inspections, and
• Software Testing
Inspection Vs. Testing
Production
Requirements
Artifacts
Design
Artifacts
Code
Artifacts
Unit Testing Integration
Testing
System
Testing
Acceptance
Testing
Inspection
Testing
Inspection Vs. Testing
• Testing is an activity that can be generally
performed only on code. Inspection is a more
general activity that can be applied to any work
product, including code.
• Testing can evaluate the product working
whereas inspection can only examine the static
documents.
• Testing is a dynamic technique for V&V whereas
inspection is a static technique.
What is Software Testing
• Glen Myers
• Testing is the process of executing a program with the intent of
finding errors
• Software Testing is the process of evaluating a system by
manual or automated means to verify that it satisfies
specified requirements in terms of SRS, functionality,
and performance.
• The software is tested under normal and abnormal
conditions
• Normal conditions->positive testing->normal data
• Abnormal conditions->Negative testing->abnormal data
Testing Objectives
1. Testing is a process of executing a program
with the intent of finding error.
2. A good test case (a document which defines
each test case in detail) is one that has a high
probability of finding an as-yet-undiscovered
error.
3. A successful test is one that uncovers an as-
yet-undiscovered error.
Testing Principles
1. All tests should be traceable to customer
requirements.
2. Tests should be planned long before testing
begins.
3. The Pareto principle applies to software
testing.
• Typically, 80% of the errors come from 20% of
the modules. The problem, of course, is to
isolate these suspect components and to
thoroughly test them.
Testing Principles
4. Testing should begin “in the small” and progress toward
testing “in the large.”
5. Exhaustive testing is not possible.
6. To be most effective, testing should be conducted by an
independent third party.
Testing Process
A Software Testing Strategy
or Levels of Testing
• Large systems are built of sub-systems which are
built of modules which are composed of
procedures and functions. The testing process
should therefore proceed in stages where
testing is carried out incrementally in
conjunction with system implementation.
• The sequence of testing activities:
• Unit Testing
• Integration Testing
• System Testing
• Acceptance Testing
A Software Testing Strategy
or Levels of Testing
• The relation of the errors introduced in different phases, and
different levels of testing can be shown as:
Client Needs  Acceptance Testing
Requirements  System Testing
Design - Integration Testing
Code - Unit Testing
Testing Methodologies
• There are two basic methodologies to testing:
• Functional Testing Or Black Box Testing Or Behavioral Testing
• Structural Testing or White Box Testing Or Glass Box Testing
Black-Box Testing
• In Black-Box testing the structure of the program
is not considered. Test cases are decided solely
on the basis of the requirements or
specifications of the program or module, and the
internals of the module or the program are not
considered for selection of test cases.
• In black-box testing, the tester only knows the
inputs that can be given to the system and what
output the system should give.
White-Box Testing
• It is concerned with testing the implementation of the
program.
• The intent of this testing is not to exercise all the different
input or output conditions but to exercise the different
programming structures and data structures used in the
program.
Black-Box Testing
Techniques
• The most obvious black-box testing is exhaustive
testing, which is impractical and infeasible.
• The set of test cases includes all the possible inputs
to the program.
• Even for small program the no. of elements in the
input domain can be extremely large (i.e. it is not
practical due to cost constrains.)
• One other criteria for generating test cases is to
generate them randomly. This strategy has little
chances of resulting in a set of test cases that is
close to optimal (i.e. that detects maximum errors
with minimum test cases.)
Black-Box Testing
Techniques
• There are no formal rules for designing test case
for Black-box testing.
• However, there are a number of techniques that
can be used to select test cases that have been
found to be very successful in detecting errors.
Some of these techniques are:
• Equivalence class partitioning
• Boundary value analysis
• Cause-Effect Graphing
Equivalence Class Partitioning
• Input values to a program are partitioned into equivalence
classes.
• Partitioning is done such that:
• program behaves in similar ways to every
input value belonging to an equivalence
class.
Why define equivalence
classes?
• Test the code with just one representative value from each
equivalence class:
• as good as testing using any other values from the equivalence
classes.
Equivalence Class
Partitioning
• How do you determine the equivalence classes?
• examine the input data.
• few general guidelines for determining the equivalence classes
can be given
Equivalence Class
Partitioning
• If the input data to the program is specified by a range of
values:
• e.g. numbers between 1 to 5000.
• one valid and two invalid equivalence classes are defined.
1 5000
Equivalence Class
Partitioning
• If input is an enumerated set of values:
• e.g. {a,b,c}
• one equivalence class for valid input values
• another equivalence class for invalid input values should be
defined.
Example
• A program reads an input value in the range of 1 and 5000:
• computes the square root of the input number
SQRT
Example (cont.)
• There are three equivalence classes:
• the set of negative integers,
• set of integers in the range of 1 and 5000,
• integers larger than 5000.
1 5000
Example (cont.)
• The test suite must include:
• representatives from each of the three equivalence classes:
• a possible test suite can be:
{-5,500,6000}.
1 5000
Boundary Value Analysis
• Whereas equivalence class partitioning deals
with selecting representative values from within
the class, BVA forces on testing of values from
the boundary of the class.
• Some typical programming errors occur:
• at boundaries of equivalence classes
• might be purely due to psychological factors.
• Programmers often fail to see:
• special processing required at the boundaries of
equivalence classes.
Boundary Value Analysis
• Programmers may improperly use < instead of <=
• Boundary value analysis:
• select test cases at the boundaries of different equivalence
classes.
Example
• For a function that computes the square root of an integer in
the range of 1 and 5000:
• test cases must include the values: {0,1,5000,5001}.
1 5000
Cause Effect graphing
• Equivalence classes and boundary value analysis
consider each input separately.
• To handle multiple inputs, different combinations
of equivalent classes of inputs can be tried.
• Number of combinations can be large – if n
different input conditions such that each
condition is valid/invalid, total: 2n
Test Cases.
• Cause effect graphing helps in selecting
combinations as input conditions.
CE-graphing
• Identify causes and effects in the system
• Cause: distinct input condition which can be true or
false
• Effect: distinct output condition (T/F)
• Identify which causes can produce which effects;
can combine causes
• Causes/effects are nodes in the graph and arcs
are drawn to capture dependency; and/or are
allowed
Steps to create cause-effect
graph
• Draw causes on the LHS
• Draw effects on the RHS
• Draw logical relationship between causes and effects
• as edges in the graph.
• Extra nodes can be added
• to simplify the graph
Drawing Cause-Effect Graphs
A B
If A then B
A
C
If (A and B)then C
B
Drawing Cause-Effect Graphs
A
C
If (A or B) then C
B
A
C
If (not(A and B)) then C
B
~
Drawing Cause-Effect Graphs
A
C
If (not (A or B))then C
B
A B
If (not A) then B
~
~
CE-graphing
• From the CE graph, can make a decision table
• Lists combination of conditions that set different
effects
• Together they check for various effects
• Decision table can be used for forming the test
cases.
• Each combinations of conditions in the table for
an effect is a test-case.
CE graphing: Example
• A bank database which allows two commands
• Credit acc# amt
• Debit acc# amt
• Requirements
• If credit and acc# valid, then credit
• If debit and acc# valid and amt less than balance, then
debit
• Invalid command - message
Example…
• Causes
• C1: command is credit
• C2: command is debit
• C3: acc# is valid
• C4: amt is valid
• Effects
• E1: Print “Invalid command”
• E2: Print “Invalid acct#”
• E3: Print “Debit amt not valid”
• R4: Debit account
• E5: Credit account
Example…
Example…
# 1 2 3 4 5
C1 0 1 x x 1
C2 0 x 1 1 x
C3 x 0 1 1 1
C4 x x 0 1 1
E1 1
E2 1
E3 1
E4 1
E5 1
White-Box Testing
Techniques
• There are different approaches to structural testing. One of
these approaches is the control-flow based testing. It includes:
• Statement coverage testing
• Branch coverage testing
• Path coverage testing
Control Flow Based
Technique
• In this technique the control flow graph of a program is
considered and coverage of various aspects of the graph are
specified as criteria.
• What is Control Flow Graph?
Control Flow Graph (CFG)
• A control flow graph (CFG) describes:
• the sequence in which different instructions of a program get
executed.
• the way control flows through the program.
Control Flow Graph (CFG)
Control Flow Graph
• Considers the program as control flow graph
• Nodes represent code blocks – i.e. set of statements
always executed together
• An edge (i,j) represents a possible transfer of control
from i to j
• Assume a start node and an end node
• A path is a sequence of nodes from start to end
• An edge must terminate at a node, even if the
node does not represent any procedural
statement.
Control Flow Graph
• Predicate Nodes: Each node that contains a condition is called
predicate node.
• Regions: Areas bounded by edges and nodes are called
regions. When counting regions, we include the area outside
the graph as a region.
Statement Coverage Testing
• Statement coverage methodology:
• design test cases so that every statement in a program is
executed at least once.
• The principal idea:
• unless a statement is executed, we have no way of knowing if an
error exists in that statement
Statement Coverage Testing
• Observing that a statement behaves properly for one input
value:
• no guarantee that it will behave correctly for all input values.
Statement Coverage Testing
• Criterion: Each statement is executed at least once during
testing
• i.e. set of paths executed during testing should include all
nodes
• Limitation: does not require a decision to evaluate to false
if no else clause
• E.g. : abs (x) { if ( x>=0) x = -x; return (x); }
• This program is clearly wrong.
• The set of test cases {x = 0} achieves 100% statement coverage,
but error not detected
Branch Coverage Testing
• Criterion: Each edge should be traversed at least
once during testing
• i.e. each decision must evaluate to both true and
false during testing
• Branch coverage implies statement coverage
• The problem with branch coverage comes if a
decision has many conditions in it (i.e. consisting
of a Boolean Expression with Boolean operators
and/or). In such situations, a decision can
evaluate to true and false without actually
exercising all the conditions.
Branch Coverage Testing
• For eg., consider the following function that checks the validity
of data item. The data item is valid if it lies between 0 and 100.
int check(x)
int x;
{
if((x>=0) && (x<=200))
check=true;
else check=false;
}
• The module is incorrect, as it is checking x<=200 instead of 100
(perhaps a typing mistake made by the programmer).
• Suppose the module is tested with the following set of test
cases: {x=5,x=-5}. The branch coverage criteria will be satisfied
for this module by this set.
Path Coverage Testing
• More general coverage criteria is one that
requires all possible paths in the control flow
graph be executed during testing.
• Path coverage implies Branch coverage
• The problem with this criterion is that programs
that contain loops can have an infinite number
of possible paths.
• Furthermore, not all paths in a graph may be
“feasible” in the sense that there may not be any
inputs for which the path can be executed.
Path Coverage Testing
• Now, the question arises:
• How do we know how many paths to look for?
• The answer is by computing the Cyclomatic Complexity.
Cyclomatic Complexity
• Cyclomatic complexity is a software metric that
provides a quantitative measure of the logical
complexity of a program.
• When used in the context of the path coverage
testing method, the value computed for
cyclomatic complexity defines the number of
independent paths and provides us with an
upper bound for the number of tests that must
be conducted to ensure that all statements have
been executed at least once.
Cyclomatic Complexity
• Independent Path: An independent path is any
path through the program that introduces at
least one new set of processing statements or a
new condition.
• When stated in terms of Flow Graph, and
independent path must move along at least one
edge that has not been traversed before the
path is defined.
Cyclomatic Complexity
• For eg. A set of independent paths for the flow graph is:
• Path1: 1-10
• Path2: 1-2-3-4-5-9-1-10
• Path3: 1-2-3-6-7-9-1-10
• Path4: 1-2-3-6-8-9-1-10
• Note that each path introduces a new age. The path:
1-2-3-4-5-9-1-2-3-6-8-9-1-10
• Is not considered to be an independent path because
it simply a combination of already specified paths and
does not traverse any new age.
Cyclomatic Complexity
• Note that the path set is not unique. In fact, a no. of different
path sets can be derived for a given procedural design.
• How do we know how many paths to look for?
• The answer is by computing the Cyclomatic Complexity.
Cyclomatic Complexity
• Cyclomatic complexity is compounded in one
of three ways:
1. The number of regions of the flow graph
correspond to the Cyclomatic Complexity.
2. Cyclomatic Complexity, V(G), for a flow graph, G, is
defined as V(G)=E-N+2
Where E is the no. of flow graph edges, N is the no.
of flow graph nodes.
3. Cyclomatic Complexity, for a flow graph G is also
defined as V(G)=P+1
Where P is the number of predicate nodes
contained in the flow graph G.
Cyclomatic Complexity
• Now refer to Flow Graph:
1. The flow graph has 4 regions.
2. V(G)=10 edges – 8 nodes + 2 = 4
3. V(G)=3 predicate nodes + 1 = 4

Testing

  • 1.
  • 2.
    Validation & Verification •Verification • “Are we building the product right?” • Ensure software meet specification (error-free) • Process of determining whether output of one phase of development conforms to its previous phase. • Validation • “Are we building the right product?” • Ensure software meets customer’s needs • Process of determining whether a fully developed system conforms to its SRS document
  • 3.
    Verification versus Validation •Verification is concerned with phase containment of errors • Validation is concerned about the final product to be error free
  • 4.
    Validation & Verification •There are two major approaches for verification and validation: • Software Inspections, and • Software Testing
  • 5.
    Inspection Vs. Testing Production Requirements Artifacts Design Artifacts Code Artifacts UnitTesting Integration Testing System Testing Acceptance Testing Inspection Testing
  • 6.
    Inspection Vs. Testing •Testing is an activity that can be generally performed only on code. Inspection is a more general activity that can be applied to any work product, including code. • Testing can evaluate the product working whereas inspection can only examine the static documents. • Testing is a dynamic technique for V&V whereas inspection is a static technique.
  • 7.
    What is SoftwareTesting • Glen Myers • Testing is the process of executing a program with the intent of finding errors • Software Testing is the process of evaluating a system by manual or automated means to verify that it satisfies specified requirements in terms of SRS, functionality, and performance. • The software is tested under normal and abnormal conditions • Normal conditions->positive testing->normal data • Abnormal conditions->Negative testing->abnormal data
  • 8.
    Testing Objectives 1. Testingis a process of executing a program with the intent of finding error. 2. A good test case (a document which defines each test case in detail) is one that has a high probability of finding an as-yet-undiscovered error. 3. A successful test is one that uncovers an as- yet-undiscovered error.
  • 9.
    Testing Principles 1. Alltests should be traceable to customer requirements. 2. Tests should be planned long before testing begins. 3. The Pareto principle applies to software testing. • Typically, 80% of the errors come from 20% of the modules. The problem, of course, is to isolate these suspect components and to thoroughly test them.
  • 10.
    Testing Principles 4. Testingshould begin “in the small” and progress toward testing “in the large.” 5. Exhaustive testing is not possible. 6. To be most effective, testing should be conducted by an independent third party.
  • 11.
  • 12.
    A Software TestingStrategy or Levels of Testing • Large systems are built of sub-systems which are built of modules which are composed of procedures and functions. The testing process should therefore proceed in stages where testing is carried out incrementally in conjunction with system implementation. • The sequence of testing activities: • Unit Testing • Integration Testing • System Testing • Acceptance Testing
  • 13.
    A Software TestingStrategy or Levels of Testing • The relation of the errors introduced in different phases, and different levels of testing can be shown as: Client Needs  Acceptance Testing Requirements  System Testing Design - Integration Testing Code - Unit Testing
  • 14.
    Testing Methodologies • Thereare two basic methodologies to testing: • Functional Testing Or Black Box Testing Or Behavioral Testing • Structural Testing or White Box Testing Or Glass Box Testing
  • 15.
    Black-Box Testing • InBlack-Box testing the structure of the program is not considered. Test cases are decided solely on the basis of the requirements or specifications of the program or module, and the internals of the module or the program are not considered for selection of test cases. • In black-box testing, the tester only knows the inputs that can be given to the system and what output the system should give.
  • 16.
    White-Box Testing • Itis concerned with testing the implementation of the program. • The intent of this testing is not to exercise all the different input or output conditions but to exercise the different programming structures and data structures used in the program.
  • 17.
    Black-Box Testing Techniques • Themost obvious black-box testing is exhaustive testing, which is impractical and infeasible. • The set of test cases includes all the possible inputs to the program. • Even for small program the no. of elements in the input domain can be extremely large (i.e. it is not practical due to cost constrains.) • One other criteria for generating test cases is to generate them randomly. This strategy has little chances of resulting in a set of test cases that is close to optimal (i.e. that detects maximum errors with minimum test cases.)
  • 18.
    Black-Box Testing Techniques • Thereare no formal rules for designing test case for Black-box testing. • However, there are a number of techniques that can be used to select test cases that have been found to be very successful in detecting errors. Some of these techniques are: • Equivalence class partitioning • Boundary value analysis • Cause-Effect Graphing
  • 19.
    Equivalence Class Partitioning •Input values to a program are partitioned into equivalence classes. • Partitioning is done such that: • program behaves in similar ways to every input value belonging to an equivalence class.
  • 20.
    Why define equivalence classes? •Test the code with just one representative value from each equivalence class: • as good as testing using any other values from the equivalence classes.
  • 21.
    Equivalence Class Partitioning • Howdo you determine the equivalence classes? • examine the input data. • few general guidelines for determining the equivalence classes can be given
  • 22.
    Equivalence Class Partitioning • Ifthe input data to the program is specified by a range of values: • e.g. numbers between 1 to 5000. • one valid and two invalid equivalence classes are defined. 1 5000
  • 23.
    Equivalence Class Partitioning • Ifinput is an enumerated set of values: • e.g. {a,b,c} • one equivalence class for valid input values • another equivalence class for invalid input values should be defined.
  • 24.
    Example • A programreads an input value in the range of 1 and 5000: • computes the square root of the input number SQRT
  • 25.
    Example (cont.) • Thereare three equivalence classes: • the set of negative integers, • set of integers in the range of 1 and 5000, • integers larger than 5000. 1 5000
  • 26.
    Example (cont.) • Thetest suite must include: • representatives from each of the three equivalence classes: • a possible test suite can be: {-5,500,6000}. 1 5000
  • 27.
    Boundary Value Analysis •Whereas equivalence class partitioning deals with selecting representative values from within the class, BVA forces on testing of values from the boundary of the class. • Some typical programming errors occur: • at boundaries of equivalence classes • might be purely due to psychological factors. • Programmers often fail to see: • special processing required at the boundaries of equivalence classes.
  • 28.
    Boundary Value Analysis •Programmers may improperly use < instead of <= • Boundary value analysis: • select test cases at the boundaries of different equivalence classes.
  • 29.
    Example • For afunction that computes the square root of an integer in the range of 1 and 5000: • test cases must include the values: {0,1,5000,5001}. 1 5000
  • 30.
    Cause Effect graphing •Equivalence classes and boundary value analysis consider each input separately. • To handle multiple inputs, different combinations of equivalent classes of inputs can be tried. • Number of combinations can be large – if n different input conditions such that each condition is valid/invalid, total: 2n Test Cases. • Cause effect graphing helps in selecting combinations as input conditions.
  • 31.
    CE-graphing • Identify causesand effects in the system • Cause: distinct input condition which can be true or false • Effect: distinct output condition (T/F) • Identify which causes can produce which effects; can combine causes • Causes/effects are nodes in the graph and arcs are drawn to capture dependency; and/or are allowed
  • 32.
    Steps to createcause-effect graph • Draw causes on the LHS • Draw effects on the RHS • Draw logical relationship between causes and effects • as edges in the graph. • Extra nodes can be added • to simplify the graph
  • 33.
    Drawing Cause-Effect Graphs AB If A then B A C If (A and B)then C B
  • 34.
    Drawing Cause-Effect Graphs A C If(A or B) then C B A C If (not(A and B)) then C B ~
  • 35.
    Drawing Cause-Effect Graphs A C If(not (A or B))then C B A B If (not A) then B ~ ~
  • 36.
    CE-graphing • From theCE graph, can make a decision table • Lists combination of conditions that set different effects • Together they check for various effects • Decision table can be used for forming the test cases. • Each combinations of conditions in the table for an effect is a test-case.
  • 37.
    CE graphing: Example •A bank database which allows two commands • Credit acc# amt • Debit acc# amt • Requirements • If credit and acc# valid, then credit • If debit and acc# valid and amt less than balance, then debit • Invalid command - message
  • 38.
    Example… • Causes • C1:command is credit • C2: command is debit • C3: acc# is valid • C4: amt is valid • Effects • E1: Print “Invalid command” • E2: Print “Invalid acct#” • E3: Print “Debit amt not valid” • R4: Debit account • E5: Credit account
  • 39.
  • 40.
    Example… # 1 23 4 5 C1 0 1 x x 1 C2 0 x 1 1 x C3 x 0 1 1 1 C4 x x 0 1 1 E1 1 E2 1 E3 1 E4 1 E5 1
  • 41.
    White-Box Testing Techniques • Thereare different approaches to structural testing. One of these approaches is the control-flow based testing. It includes: • Statement coverage testing • Branch coverage testing • Path coverage testing
  • 42.
    Control Flow Based Technique •In this technique the control flow graph of a program is considered and coverage of various aspects of the graph are specified as criteria. • What is Control Flow Graph?
  • 43.
    Control Flow Graph(CFG) • A control flow graph (CFG) describes: • the sequence in which different instructions of a program get executed. • the way control flows through the program.
  • 44.
  • 45.
  • 46.
    Control Flow Graph •Considers the program as control flow graph • Nodes represent code blocks – i.e. set of statements always executed together • An edge (i,j) represents a possible transfer of control from i to j • Assume a start node and an end node • A path is a sequence of nodes from start to end • An edge must terminate at a node, even if the node does not represent any procedural statement.
  • 47.
    Control Flow Graph •Predicate Nodes: Each node that contains a condition is called predicate node. • Regions: Areas bounded by edges and nodes are called regions. When counting regions, we include the area outside the graph as a region.
  • 48.
    Statement Coverage Testing •Statement coverage methodology: • design test cases so that every statement in a program is executed at least once. • The principal idea: • unless a statement is executed, we have no way of knowing if an error exists in that statement
  • 49.
    Statement Coverage Testing •Observing that a statement behaves properly for one input value: • no guarantee that it will behave correctly for all input values.
  • 50.
    Statement Coverage Testing •Criterion: Each statement is executed at least once during testing • i.e. set of paths executed during testing should include all nodes • Limitation: does not require a decision to evaluate to false if no else clause • E.g. : abs (x) { if ( x>=0) x = -x; return (x); } • This program is clearly wrong. • The set of test cases {x = 0} achieves 100% statement coverage, but error not detected
  • 51.
    Branch Coverage Testing •Criterion: Each edge should be traversed at least once during testing • i.e. each decision must evaluate to both true and false during testing • Branch coverage implies statement coverage • The problem with branch coverage comes if a decision has many conditions in it (i.e. consisting of a Boolean Expression with Boolean operators and/or). In such situations, a decision can evaluate to true and false without actually exercising all the conditions.
  • 52.
    Branch Coverage Testing •For eg., consider the following function that checks the validity of data item. The data item is valid if it lies between 0 and 100. int check(x) int x; { if((x>=0) && (x<=200)) check=true; else check=false; } • The module is incorrect, as it is checking x<=200 instead of 100 (perhaps a typing mistake made by the programmer). • Suppose the module is tested with the following set of test cases: {x=5,x=-5}. The branch coverage criteria will be satisfied for this module by this set.
  • 53.
    Path Coverage Testing •More general coverage criteria is one that requires all possible paths in the control flow graph be executed during testing. • Path coverage implies Branch coverage • The problem with this criterion is that programs that contain loops can have an infinite number of possible paths. • Furthermore, not all paths in a graph may be “feasible” in the sense that there may not be any inputs for which the path can be executed.
  • 54.
    Path Coverage Testing •Now, the question arises: • How do we know how many paths to look for? • The answer is by computing the Cyclomatic Complexity.
  • 55.
    Cyclomatic Complexity • Cyclomaticcomplexity is a software metric that provides a quantitative measure of the logical complexity of a program. • When used in the context of the path coverage testing method, the value computed for cyclomatic complexity defines the number of independent paths and provides us with an upper bound for the number of tests that must be conducted to ensure that all statements have been executed at least once.
  • 56.
    Cyclomatic Complexity • IndependentPath: An independent path is any path through the program that introduces at least one new set of processing statements or a new condition. • When stated in terms of Flow Graph, and independent path must move along at least one edge that has not been traversed before the path is defined.
  • 57.
    Cyclomatic Complexity • Foreg. A set of independent paths for the flow graph is: • Path1: 1-10 • Path2: 1-2-3-4-5-9-1-10 • Path3: 1-2-3-6-7-9-1-10 • Path4: 1-2-3-6-8-9-1-10 • Note that each path introduces a new age. The path: 1-2-3-4-5-9-1-2-3-6-8-9-1-10 • Is not considered to be an independent path because it simply a combination of already specified paths and does not traverse any new age.
  • 58.
    Cyclomatic Complexity • Notethat the path set is not unique. In fact, a no. of different path sets can be derived for a given procedural design. • How do we know how many paths to look for? • The answer is by computing the Cyclomatic Complexity.
  • 59.
    Cyclomatic Complexity • Cyclomaticcomplexity is compounded in one of three ways: 1. The number of regions of the flow graph correspond to the Cyclomatic Complexity. 2. Cyclomatic Complexity, V(G), for a flow graph, G, is defined as V(G)=E-N+2 Where E is the no. of flow graph edges, N is the no. of flow graph nodes. 3. Cyclomatic Complexity, for a flow graph G is also defined as V(G)=P+1 Where P is the number of predicate nodes contained in the flow graph G.
  • 60.
    Cyclomatic Complexity • Nowrefer to Flow Graph: 1. The flow graph has 4 regions. 2. V(G)=10 edges – 8 nodes + 2 = 4 3. V(G)=3 predicate nodes + 1 = 4