Download to read offline


![Ravali.Koppula, Varikunta.Bhargavi Sai, SS. Asadi and M.V. Raju
http://www.iaeme.com/IJCIET/index.asp 694 editor@iaeme.com
5. CONCLUSION AND RECOMMENDATION
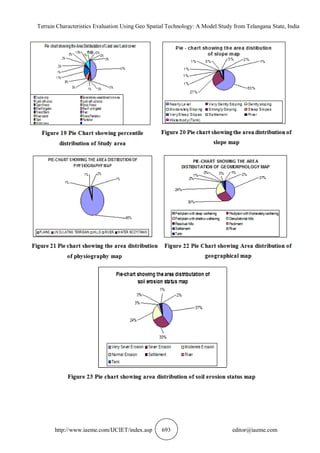
By studying the existing Scenario of study area and changes in physical characteristics of study area
due to mining activities going on in study area and its impact on the Land and Water Resources
through special analysis using Remote Sensing and GIS tools. From the Analysis of physical
characteristics data, It is identified that more area in the site has been very severely affected by soil
erosion. In future this may lead to consequential problem to major water bodies. Thus, It is necessary
to control soil erosion and Ground water potential is very good in the selected site and Ground water
table is 0-5 m bgl. Thus, there is a need to save water from undergoing pollution.
REFERENCES
[1] Griffth, Daniel A. and Larry J.Layne. A casebook for spatial Statistical Data Analysis: A
compilation of Analyses of Different Thematic Data Sets, New York : Oxford Presss,1999.
[2] Harder, Christian. Serving Maps on the internet: Geographic Information on the World Wide Web,
Redlands, CA: ESRI Press,1998.
[3] Hay, S.I, S.E. Randolph and D.J.Rogers, eds. Remote Sensing and Geographical Information
Systems in Epidemiology, San Diego: Academic Press,2000.
[4] Huxhold, Willian E, Eric M.Fowler and Brian Parr. ArcGis and the Digital City: A Hands- on
Approach for Local Governments, Redlands, CA: ESRI Press,2004.
[5] Kennedy, Heather, ed. Dictionary of GIS Terminology, Redlands, CA:ESRI Press,2001.
[6] Agarwal, C.S. and Garg, P.K. Text book of Remote Sensing in Natural Resources Management.
[7] Arakeri, H.R. and Roy Donahue, 1984. Principles of soil Conservation and Water
Management. Oxford and IBH Publishing CO. Ltd.
[8] Bikram Prasad and H.L Tiwari, GIS Based Soil Erosio n Modelling. International Journal
of Civil Engineering and Technology, 7(6), 2016, pp.166 – 171.
[9] Cracknell, A.P. and Hayes, L.W.B. 1996. Introduction to Remote Sensing. Chapman and
Hall Publications, New York.
[10] Handbook of Statistics, Rangareddy district 2001. Chief Planning Officer, Director of
Census Operation, Andhra Pradesh.
[11] G.S. Sarma, SS. Asadi and S. Lakshmi Narayana, Creation of Web Based Decision Support
Information System for Evaluation of Topographic Characteristics Using Remote Sensing
& GIS and Visual Basic Programe. International Journal of Civil Engineering and
Technology, 7(6), 2016, pp. 621–634.
[12] Isobel W. Heathcote, 1998. Integrated Watershed management – Principles and practice.
John Wiley and Sons Inc, New York.](https://image.slidesharecdn.com/ijciet0801080-170306053220/85/TERRAIN-CHARACTERISTICS-EVALUATION-USING-GEO-SPATIAL-TECHNOLOGY-A-MODEL-STUDY-FROM-TELANGANA-STATE-INDIA-10-320.jpg)

The document discusses a study on terrain characteristics evaluation in Kothagudem, Telangana using geo-spatial technology, specifically remote sensing and GIS. It aims to create a spatial database of physical characteristics such as drainage, land use, and slope to aid in resource management and planning. The findings indicate significant soil erosion, highlighting the need for conservation strategies to protect water resources.