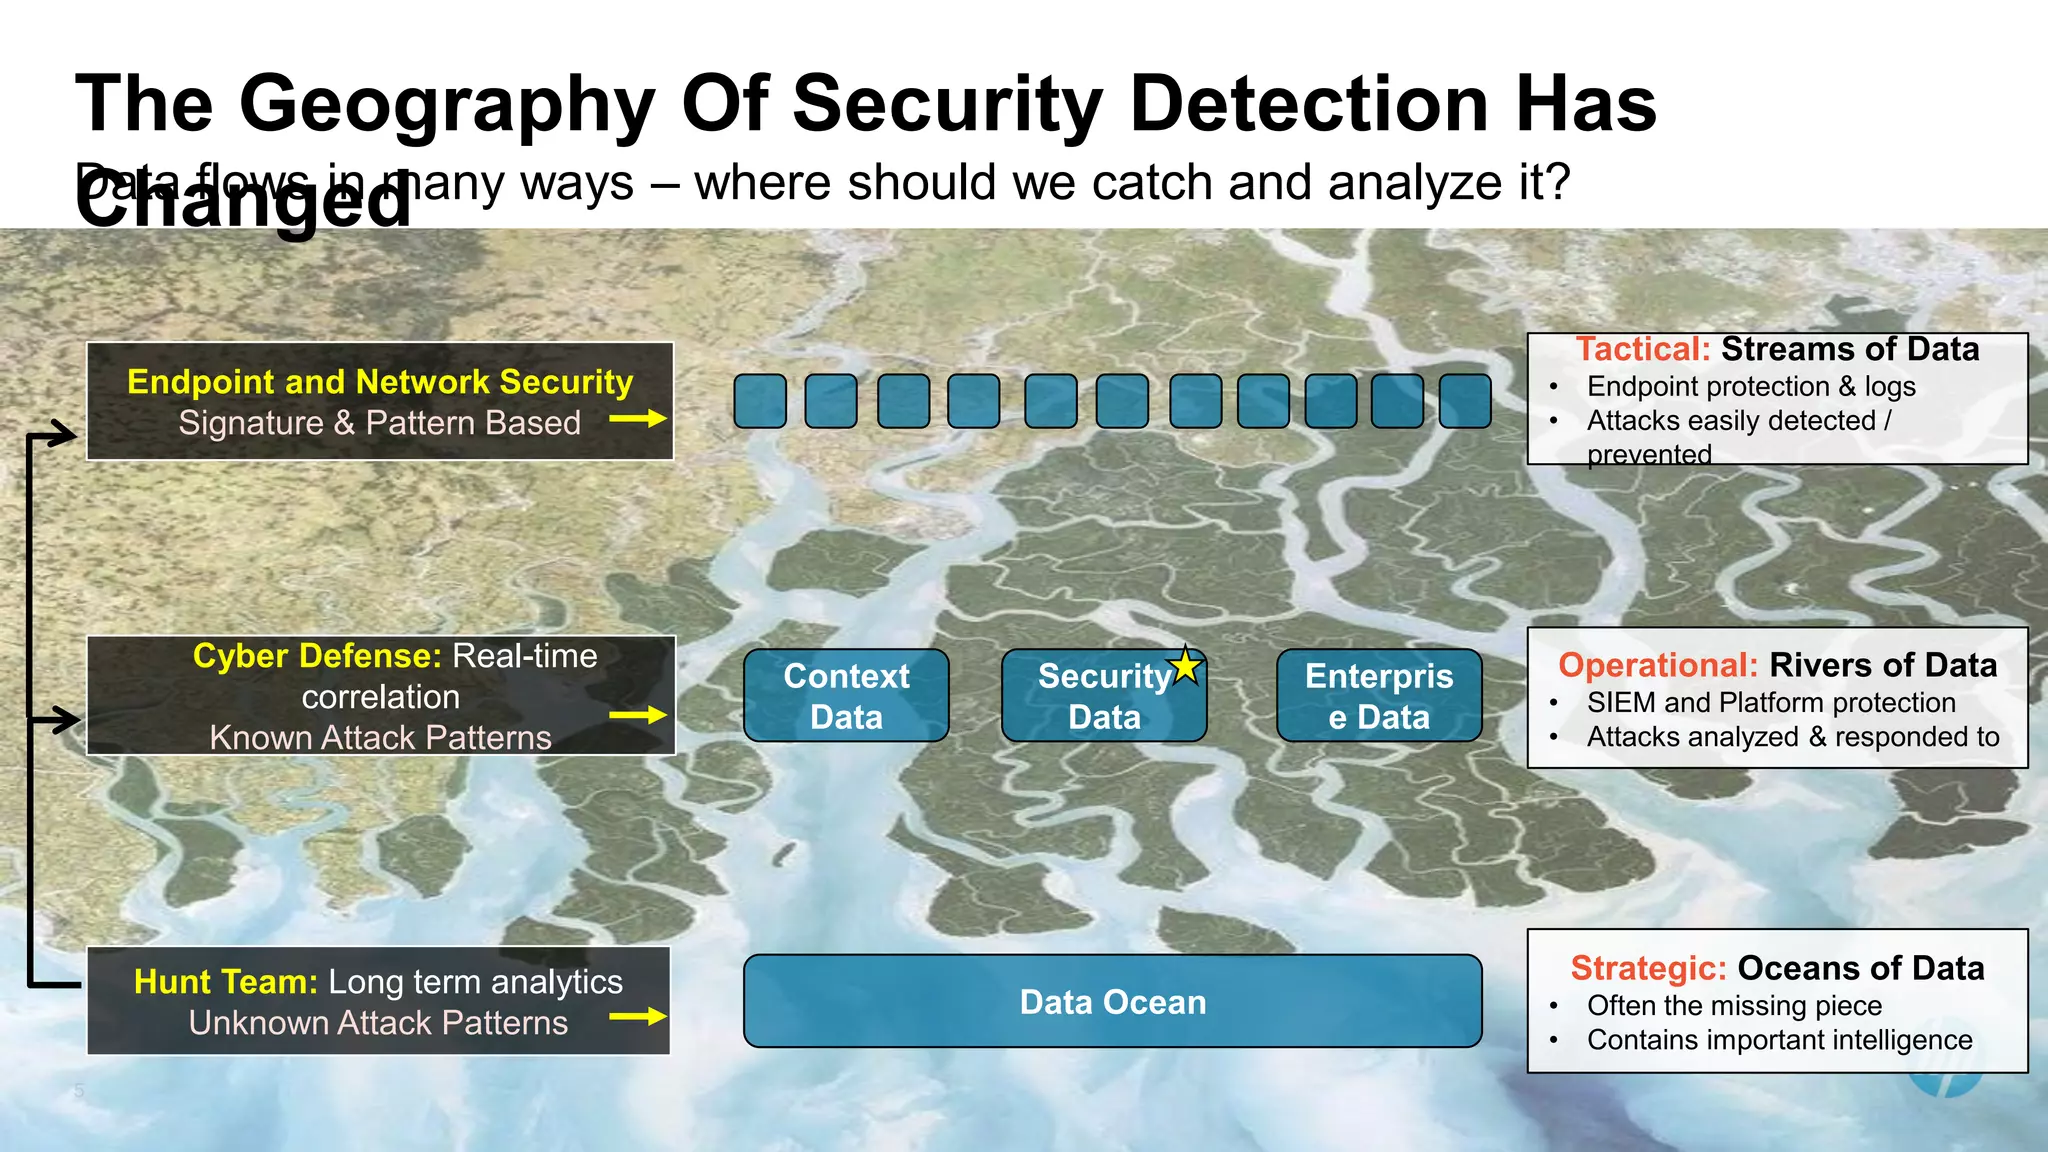
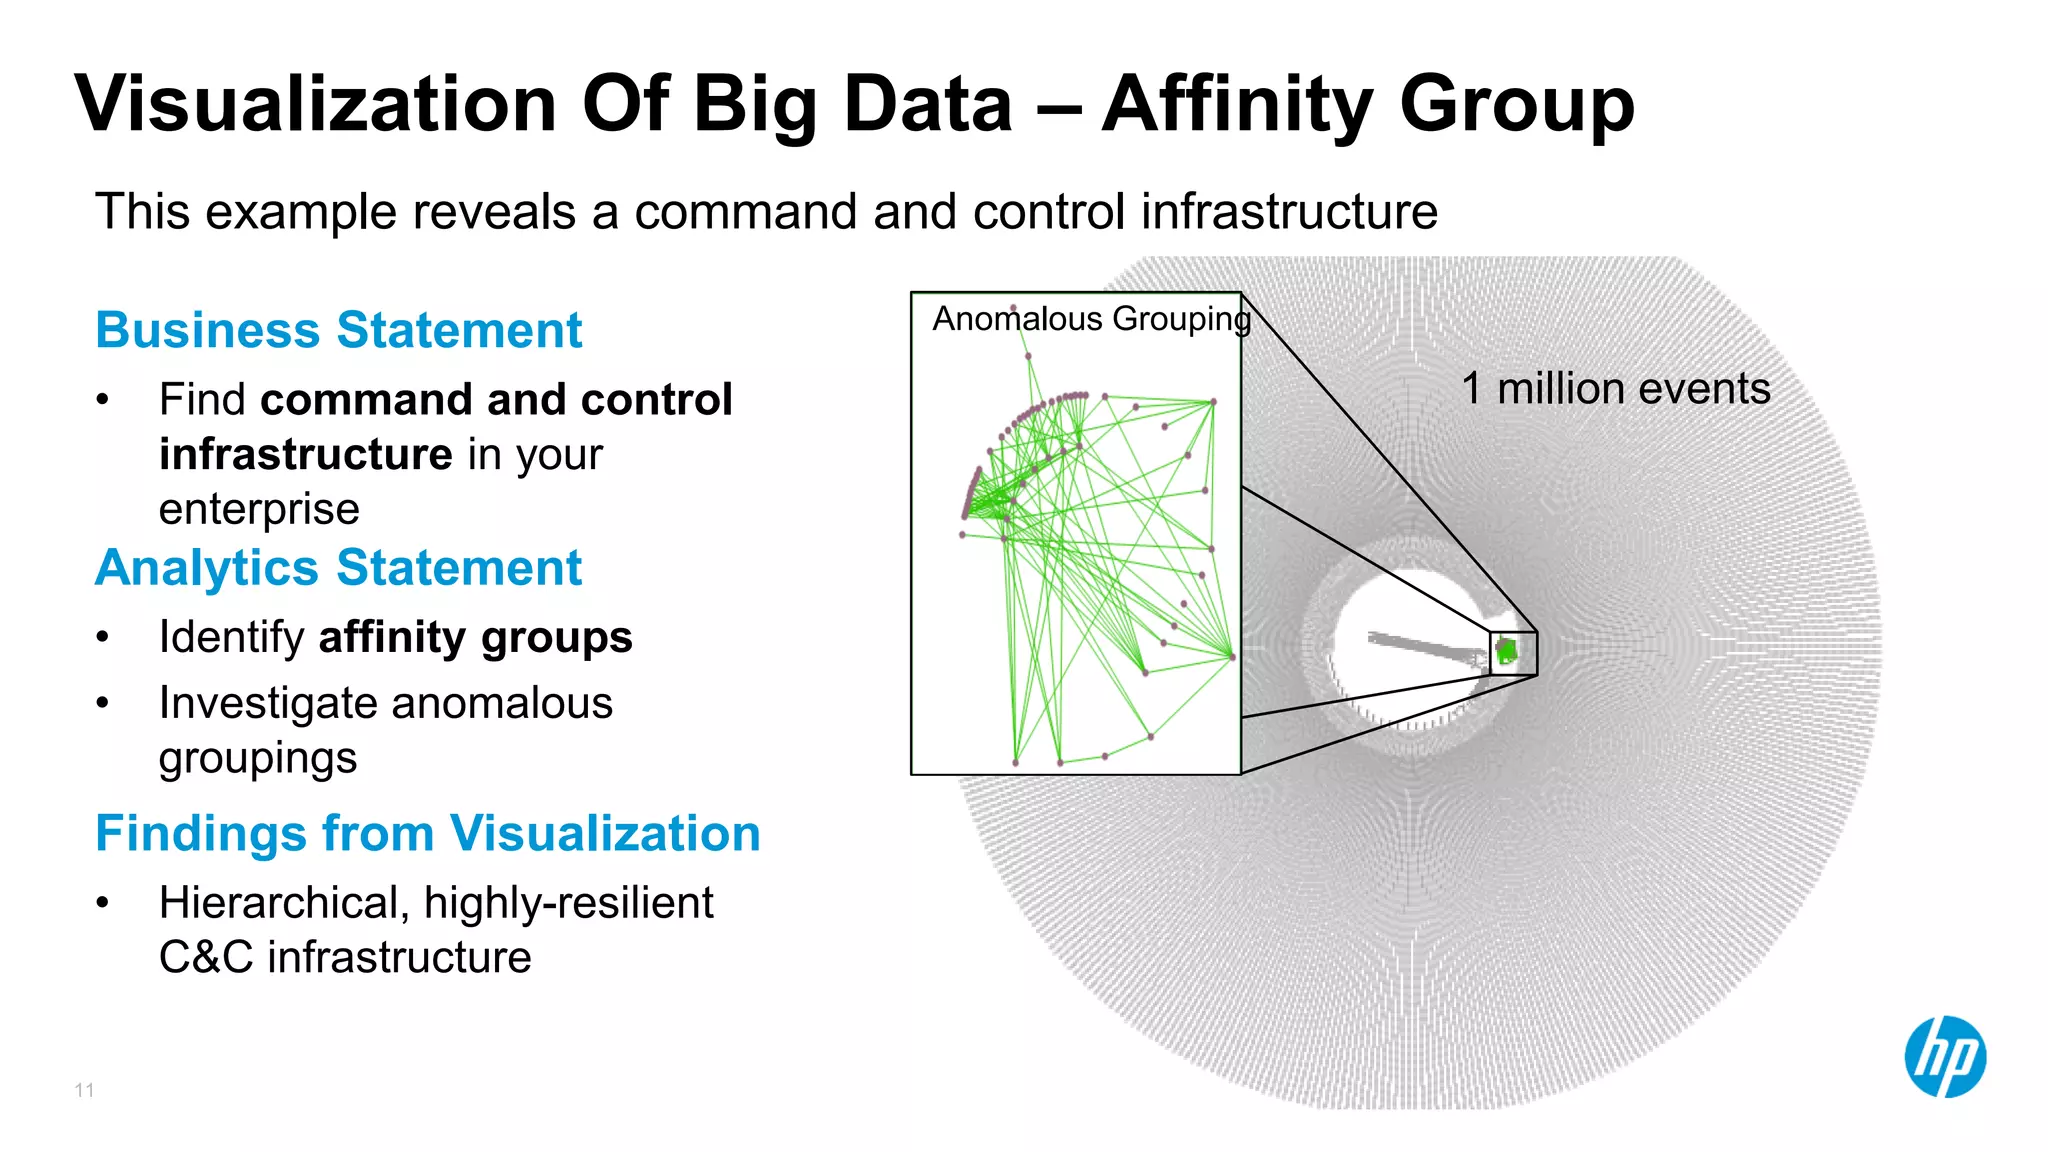
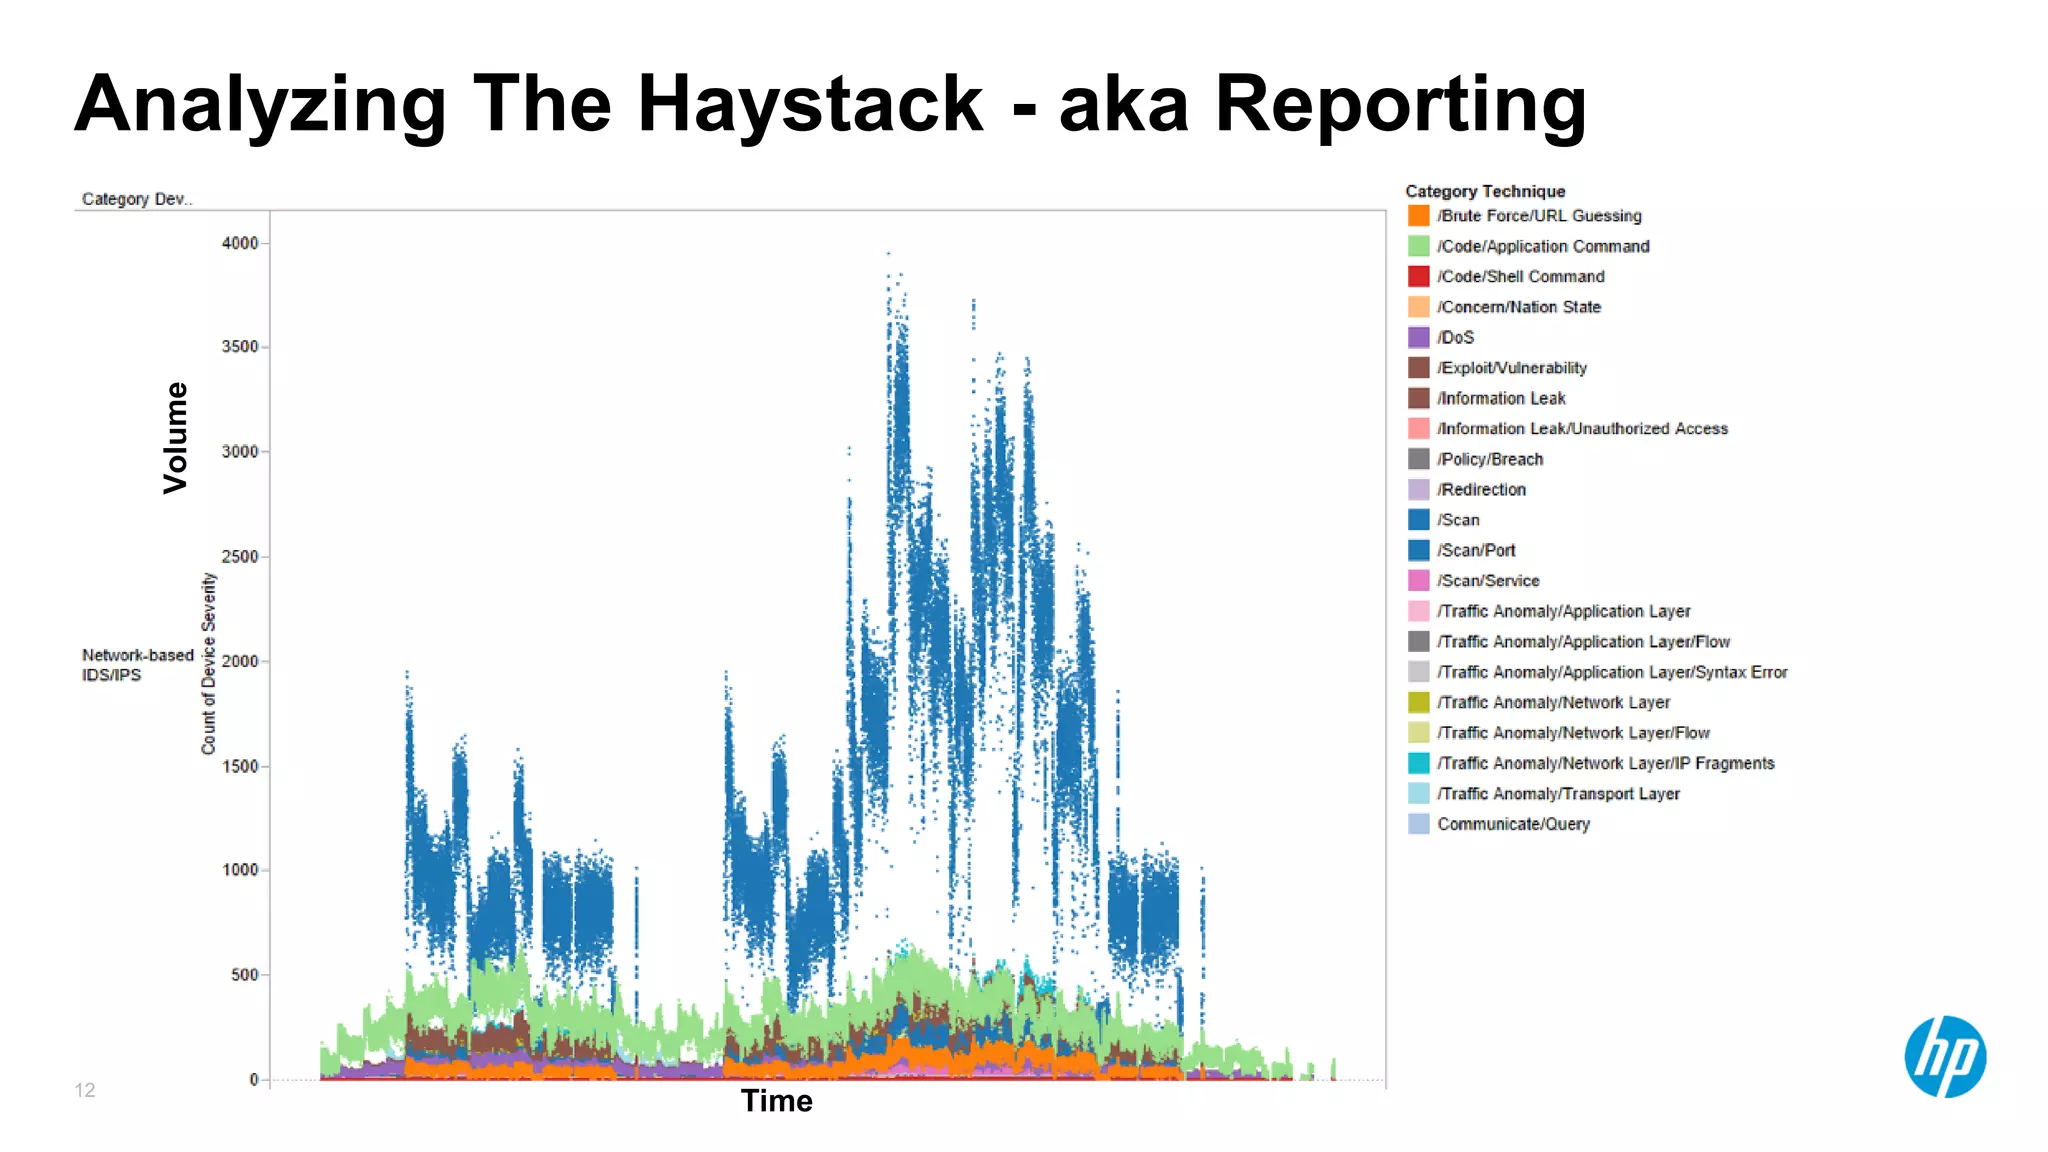
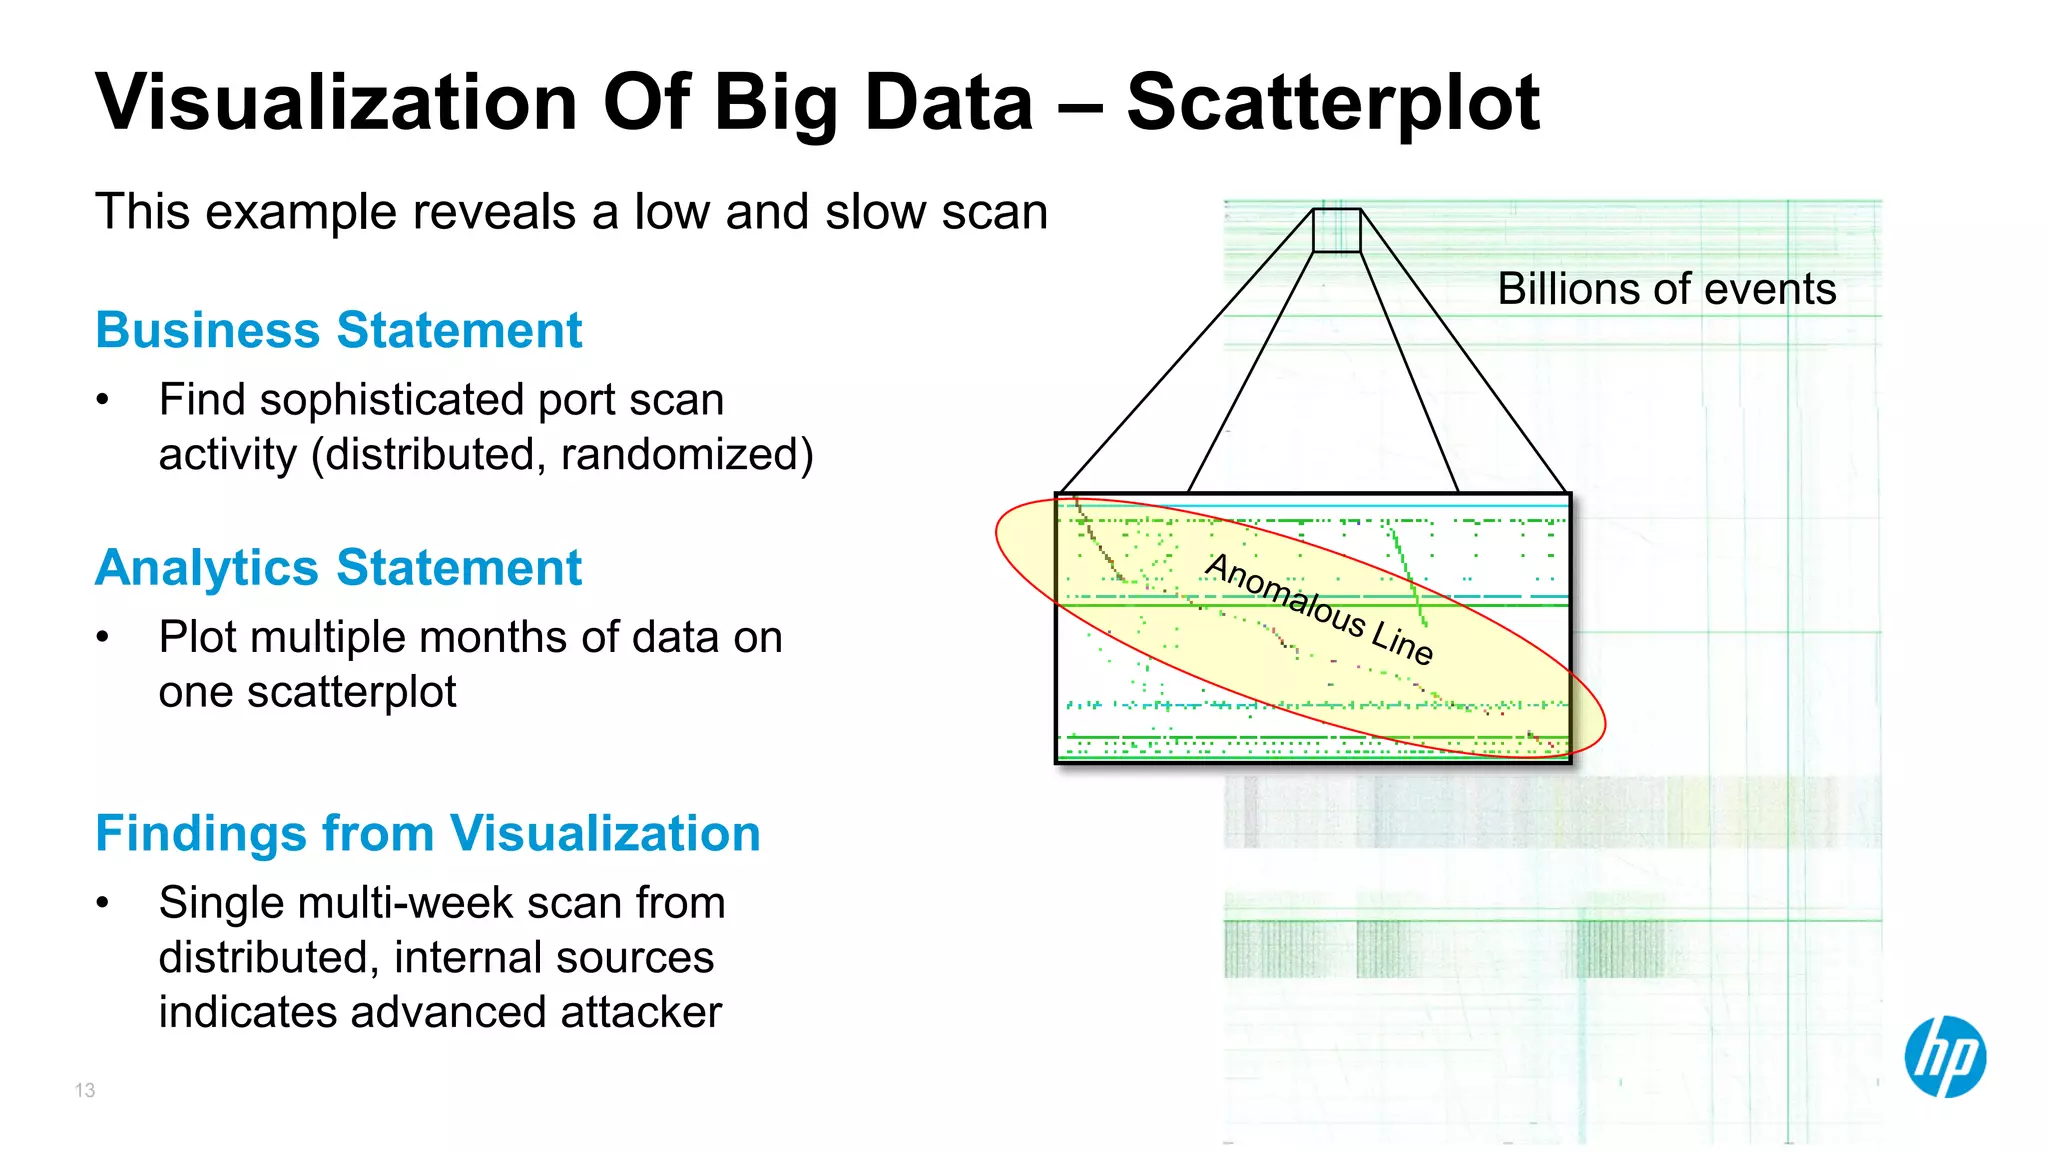
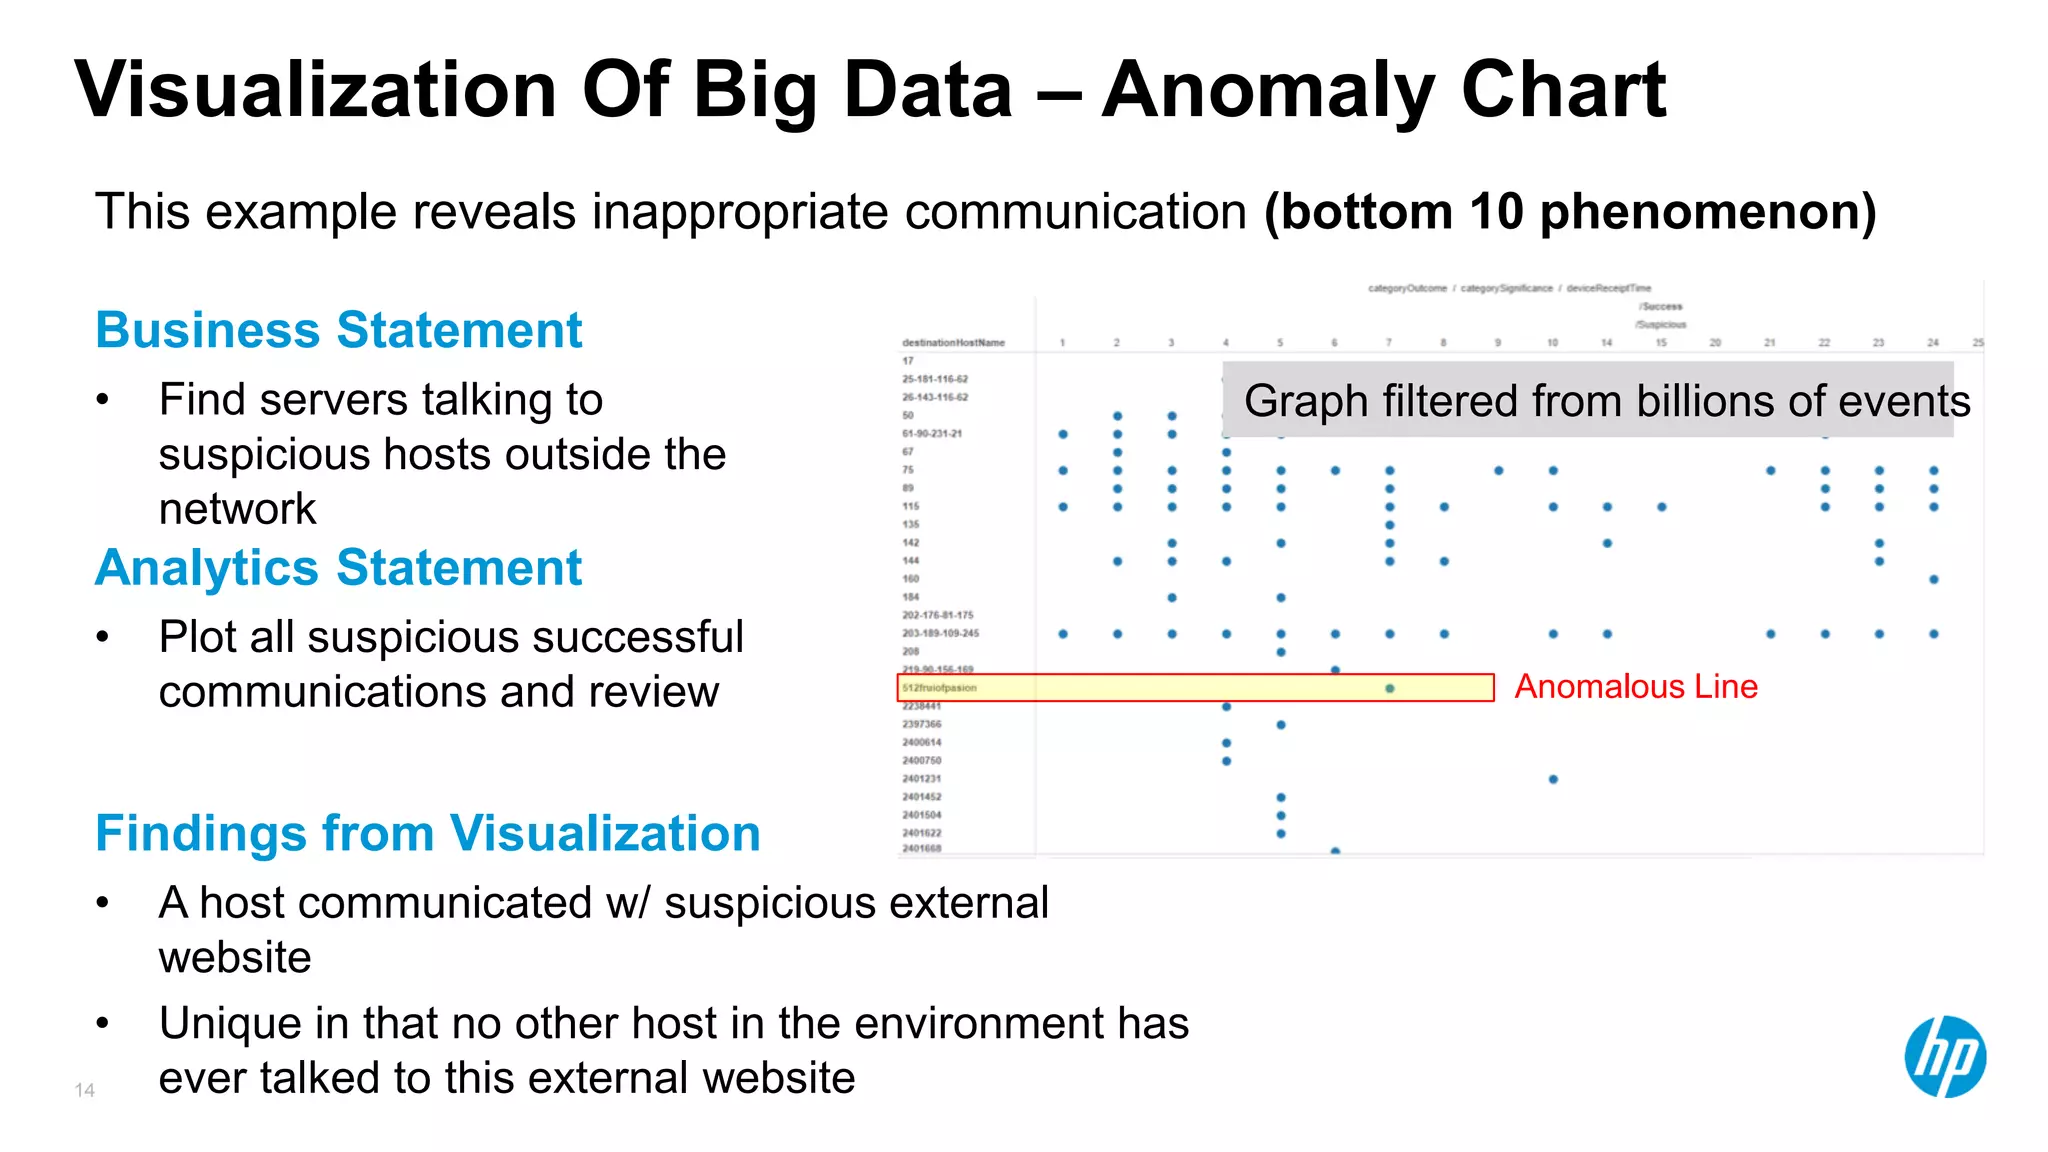
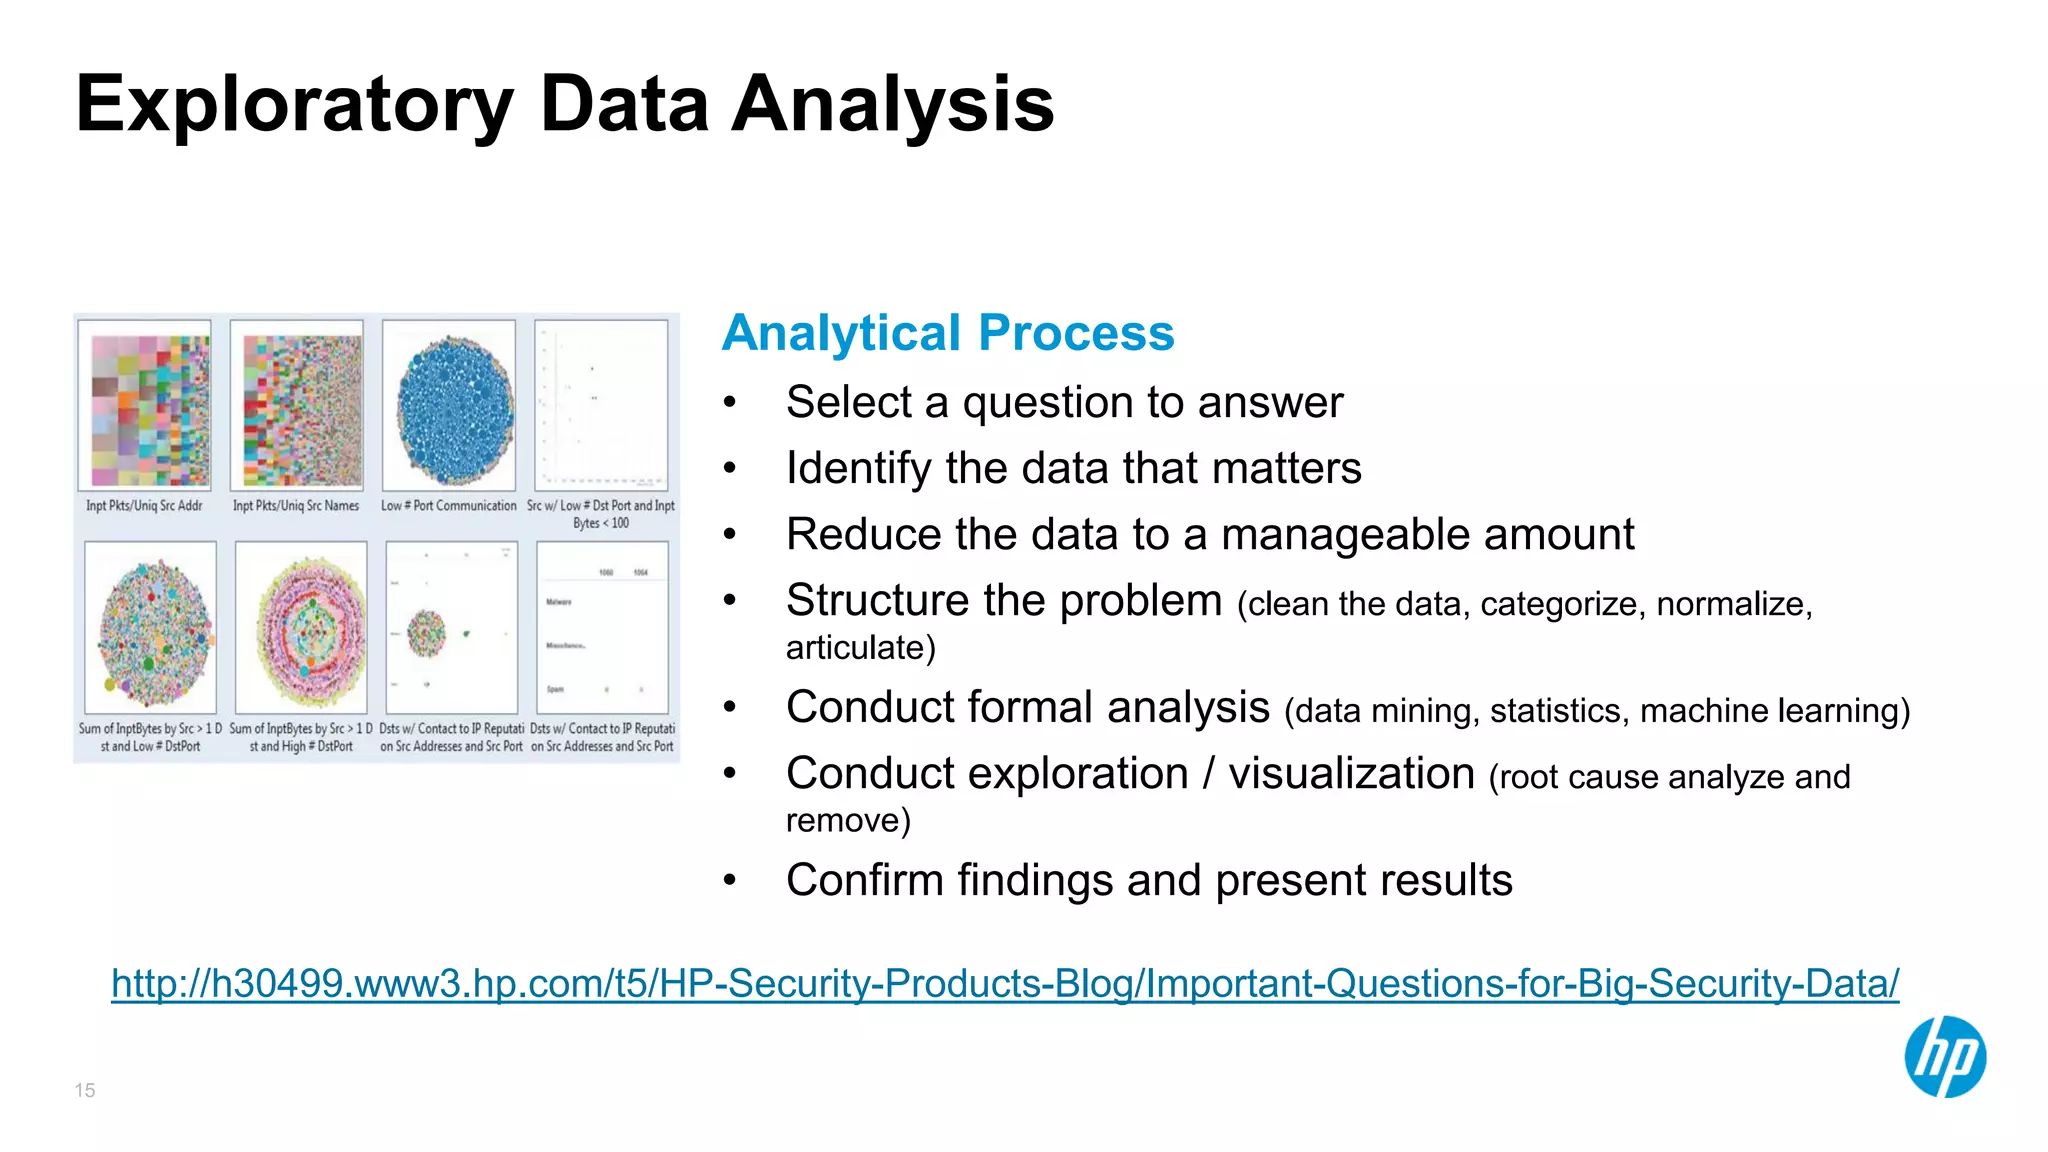
© Copyright 2013 Hewlett-Packard Development Company, L.P. The information contained herein is subject to change without notice.
ISSA Conference
Chris Calvert, CISSP, CISM – Director of Solution Innovation
2
My Job Is Innovation So I Own The Buzzword
Slides
(Google Trends Report)
3
The Security Industry Is Not Catching Enough
Bad GuysMost enterprises remain challenged with missing critical breaches.
of business networks
have traffic going to
known malware hosting
websites
(Cisco 2014 Annual Security Report)
229 Days 100%
is the median duration of
how long breaches were
present before discovery in
2013
(M-Trends Report)
4
Bad guys know how to stay inside the bell curve.
Why Is This So Hard?
Unknown: Harder to detect
• New behavior
• Goes to an approved place
• Works encrypted
• Authorized Use
• Inside of baseline
• Outside monitored infrastructure
• Matches a signature
• Goes to a bad place
• Works in the clear
• Unauthorized Use
• Outside of baseline
• Within monitored infrastructure
Known: Easier to detect
5
The Geography Of Security Detection Has
ChangedData flows in many ways – where should we catch and analyze it?
Security
Data
Enterpris
e Data
Context
Data
Data Ocean
Cyber Defense: Real-time
correlation
Known Attack Patterns
Hunt Team: Long term analytics
Unknown Attack Patterns
Operational: Rivers of Data
• SIEM and Platform protection
• Attacks analyzed & responded to
Tactical: Streams of Data
• Endpoint protection & logs
• Attacks easily detected /
prevented
Strategic: Oceans of Data
• Often the missing piece
• Contains important intelligence
Endpoint and Network Security
Signature & Pattern Based
6
All Data Is Not Equal
And expensive…
• $collect, $process, $analyze, $store,
$manage
You should consider the small
analytics problems first
Collect what matters to solving a
real problem – are all these logs
useful?
The conventional wisdom of collect everything and figure it out later is WRONG!
7
Basic Context
• Asset, Network
• Identity
Advanced Context
• Application
• Flow & DPI
Technical Intelligence
• Malware Detonation
• IOC Identification
Human
Intelligence
• Sentiment
analysis
• Motivation
Adhoc Query
• Small dataset
• Basic analysis
Advanced Search
• Indicator lists
• Pivot search
Analytical Query
• Big Data management
• Analytical datamart
Visualization
• Exploratory data
analysis
Reporting
• Threat
• Compliance
Scoring
• Risk Fidelity
• Profiling
Data Mining
• Clustering, Aggregation
• Affinity Grouping
Machine Learning
• Classification
• Other Algorithms
Real-time
• RT Correlation
• Log Aggregation
Historical Analysis
• LT Correlation
• Epidemiology
Statistical Analysis
• Distributed R
• Standard deviation
Behavioral
• Insider Threat
• Baselining
Frontier
Understand
Explore
Explain
Detect
Depth => Increase in Effectiveness
Describing the Future of Security Detection
Adding Advanced Analytics
Existing Emerging Advanced Target
8
What Stopped Us From This Kind Of Analysis?
9
Analytics Of The Future Relies On Columnar
Retrieval
Compression Clustering
Distributed
Query
10
Find Needles & Understand Haystacks Using…
Classification - context (asset model, etc…)
Correlation - real-time (ESM) & historical
Clustering – common root cause
Affinity Grouping - relationships in data
Aggregation - assemble attacker profile
Statistical Analysis – reporting & anomalies
Disciplines of Analytics
11
Visualization Of Big Data – Affinity Group
Business Statement
• Find command and control
infrastructure in your
enterprise
Analytics Statement
• Identify affinity groups
• Investigate anomalous
groupings
1 million events
Anomalous Grouping
Findings from Visualization
• Hierarchical, highly-resilient
C&C infrastructure
This example reveals a command and control infrastructure
12
Analyzing The Haystack - aka Reporting
Time
Volume
13
Business Statement
• Find sophisticated port scan
activity (distributed, randomized)
Analytics Statement
• Plot multiple months of data on
one scatterplot
Billions of events
Findings from Visualization
• Single multi-week scan from
distributed, internal sources
indicates advanced attacker
This example reveals a low and slow scan
Visualization Of Big Data – Scatterplot
14
Business Statement
• Find servers talking to
suspicious hosts outside the
network
Analytics Statement
• Plot all suspicious successful
communications and review
Graph filtered from billions of events
Findings from Visualization
• A host communicated w/ suspicious external
website
• Unique in that no other host in the environment has
ever talked to this external website
This example reveals inappropriate communication (bottom 10 phenomenon)
Anomalous Line
Visualization Of Big Data – Anomaly Chart
15
Exploratory Data Analysis
Analytical Process
• Select a question to answer
• Identify the data that matters
• Reduce the data to a manageable amount
• Structure the problem (clean the data, categorize, normalize,
articulate)
• Conduct formal analysis (data mining, statistics, machine learning)
• Conduct exploration / visualization (root cause analyze and
remove)
• Confirm findings and present results
http://h30499.www3.hp.com/t5/HP-Security-Products-Blog/Important-Questions-for-Big-Security-Data/
16
Hunt Team - The Way To Operationalize
Analytics
17
Operational Deception – Honeypot vs.
Deception
18
Analytical Talent: A Strong Fingerprint Exists
Work in small teams – industry average 10 people
Using tools more sophisticated than a spreadsheet is a qualifier
Analytics personality? - Tom Davenport
• Mindset: #1 intellectually curious more important than any
specific skill
• Desire to learn
• Deep desire for creative assignments
• Major in STEM and minor in liberal arts
• Rigor and discipline are high
• Important work matters to these folks
© Copyright 2013 Hewlett-Packard Development Company, L.P. The information contained herein is subject to change without notice.
They’re in there! Let’s find
them.

Technical track chris calvert-1 30 pm-issa conference-calvert

  • 1.
    © Copyright 2013Hewlett-Packard Development Company, L.P. The information contained herein is subject to change without notice. ISSA Conference Chris Calvert, CISSP, CISM – Director of Solution Innovation
  • 2.
    2 My Job IsInnovation So I Own The Buzzword Slides (Google Trends Report)
  • 3.
    3 The Security IndustryIs Not Catching Enough Bad GuysMost enterprises remain challenged with missing critical breaches. of business networks have traffic going to known malware hosting websites (Cisco 2014 Annual Security Report) 229 Days 100% is the median duration of how long breaches were present before discovery in 2013 (M-Trends Report)
  • 4.
    4 Bad guys knowhow to stay inside the bell curve. Why Is This So Hard? Unknown: Harder to detect • New behavior • Goes to an approved place • Works encrypted • Authorized Use • Inside of baseline • Outside monitored infrastructure • Matches a signature • Goes to a bad place • Works in the clear • Unauthorized Use • Outside of baseline • Within monitored infrastructure Known: Easier to detect
  • 5.
    5 The Geography OfSecurity Detection Has ChangedData flows in many ways – where should we catch and analyze it? Security Data Enterpris e Data Context Data Data Ocean Cyber Defense: Real-time correlation Known Attack Patterns Hunt Team: Long term analytics Unknown Attack Patterns Operational: Rivers of Data • SIEM and Platform protection • Attacks analyzed & responded to Tactical: Streams of Data • Endpoint protection & logs • Attacks easily detected / prevented Strategic: Oceans of Data • Often the missing piece • Contains important intelligence Endpoint and Network Security Signature & Pattern Based
  • 6.
    6 All Data IsNot Equal And expensive… • $collect, $process, $analyze, $store, $manage You should consider the small analytics problems first Collect what matters to solving a real problem – are all these logs useful? The conventional wisdom of collect everything and figure it out later is WRONG!
  • 7.
    7 Basic Context • Asset,Network • Identity Advanced Context • Application • Flow & DPI Technical Intelligence • Malware Detonation • IOC Identification Human Intelligence • Sentiment analysis • Motivation Adhoc Query • Small dataset • Basic analysis Advanced Search • Indicator lists • Pivot search Analytical Query • Big Data management • Analytical datamart Visualization • Exploratory data analysis Reporting • Threat • Compliance Scoring • Risk Fidelity • Profiling Data Mining • Clustering, Aggregation • Affinity Grouping Machine Learning • Classification • Other Algorithms Real-time • RT Correlation • Log Aggregation Historical Analysis • LT Correlation • Epidemiology Statistical Analysis • Distributed R • Standard deviation Behavioral • Insider Threat • Baselining Frontier Understand Explore Explain Detect Depth => Increase in Effectiveness Describing the Future of Security Detection Adding Advanced Analytics Existing Emerging Advanced Target
  • 8.
    8 What Stopped UsFrom This Kind Of Analysis?
  • 9.
    9 Analytics Of TheFuture Relies On Columnar Retrieval Compression Clustering Distributed Query
  • 10.
    10 Find Needles &Understand Haystacks Using… Classification - context (asset model, etc…) Correlation - real-time (ESM) & historical Clustering – common root cause Affinity Grouping - relationships in data Aggregation - assemble attacker profile Statistical Analysis – reporting & anomalies Disciplines of Analytics
  • 11.
    11 Visualization Of BigData – Affinity Group Business Statement • Find command and control infrastructure in your enterprise Analytics Statement • Identify affinity groups • Investigate anomalous groupings 1 million events Anomalous Grouping Findings from Visualization • Hierarchical, highly-resilient C&C infrastructure This example reveals a command and control infrastructure
  • 12.
    12 Analyzing The Haystack- aka Reporting Time Volume
  • 13.
    13 Business Statement • Findsophisticated port scan activity (distributed, randomized) Analytics Statement • Plot multiple months of data on one scatterplot Billions of events Findings from Visualization • Single multi-week scan from distributed, internal sources indicates advanced attacker This example reveals a low and slow scan Visualization Of Big Data – Scatterplot
  • 14.
    14 Business Statement • Findservers talking to suspicious hosts outside the network Analytics Statement • Plot all suspicious successful communications and review Graph filtered from billions of events Findings from Visualization • A host communicated w/ suspicious external website • Unique in that no other host in the environment has ever talked to this external website This example reveals inappropriate communication (bottom 10 phenomenon) Anomalous Line Visualization Of Big Data – Anomaly Chart
  • 15.
    15 Exploratory Data Analysis AnalyticalProcess • Select a question to answer • Identify the data that matters • Reduce the data to a manageable amount • Structure the problem (clean the data, categorize, normalize, articulate) • Conduct formal analysis (data mining, statistics, machine learning) • Conduct exploration / visualization (root cause analyze and remove) • Confirm findings and present results http://h30499.www3.hp.com/t5/HP-Security-Products-Blog/Important-Questions-for-Big-Security-Data/
  • 16.
    16 Hunt Team -The Way To Operationalize Analytics
  • 17.
    17 Operational Deception –Honeypot vs. Deception
  • 18.
    18 Analytical Talent: AStrong Fingerprint Exists Work in small teams – industry average 10 people Using tools more sophisticated than a spreadsheet is a qualifier Analytics personality? - Tom Davenport • Mindset: #1 intellectually curious more important than any specific skill • Desire to learn • Deep desire for creative assignments • Major in STEM and minor in liberal arts • Rigor and discipline are high • Important work matters to these folks
  • 19.
    © Copyright 2013Hewlett-Packard Development Company, L.P. The information contained herein is subject to change without notice. They’re in there! Let’s find them.