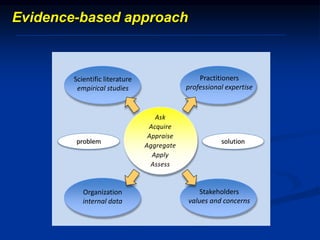
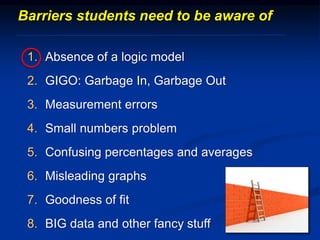
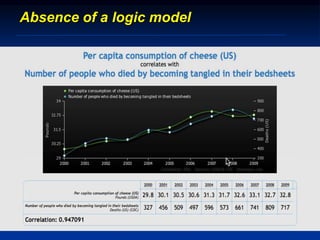
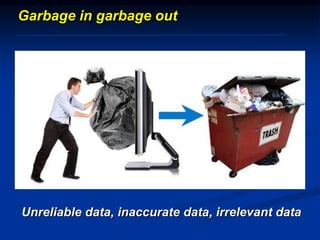
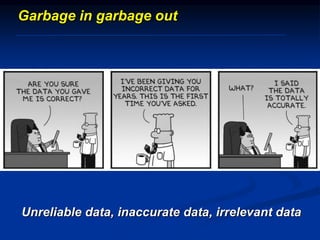
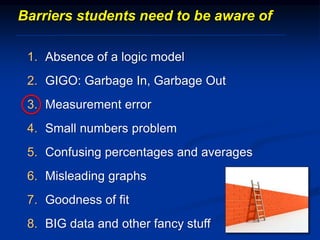
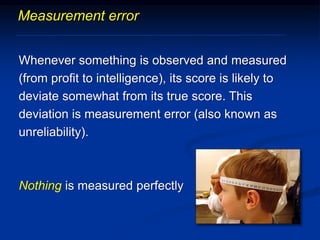
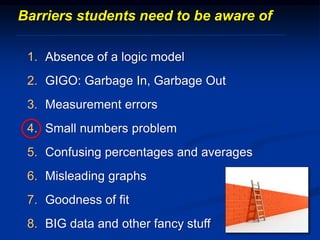
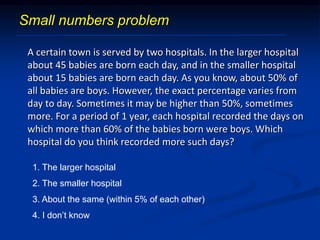
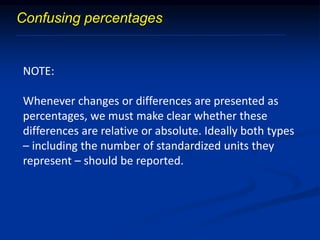
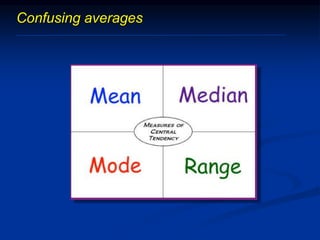
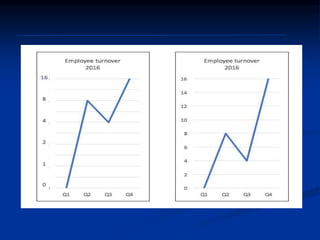
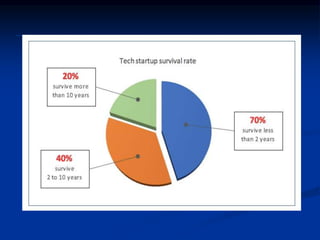
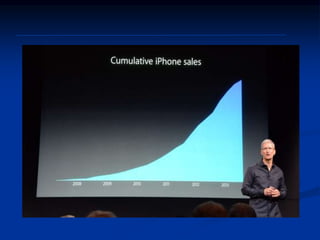
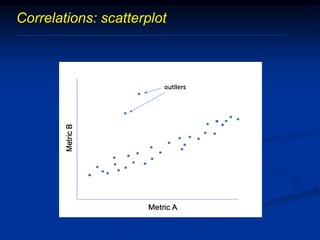
The document discusses several barriers students should be aware of when critically appraising organizational data, including: 1) the absence of a logic model, 2) garbage in/garbage out, 3) measurement errors, 4) small sample sizes, 5) confusing percentages and averages, 6) misleading graphs, and 7) issues with regression analysis like goodness of fit. It provides examples and definitions for each barrier to help students understand potential problems with organizational data and how to properly evaluate it.
Key Note of the EHMA 2016 Annual Conference in Porto
In this key note, Rob Briner and Eric Barends from the Center for Evidence Based Management will discuss the basic principles of EBMgt and consider why while most people agree with the principles of EBMgt, few organisations are able to take advantage of its potential benefits. Utilising interactive social media tools
Rob and Eric will demonstrate how EBMgt can be used to separate the wheat from the chaff.
Calls for both practical and scholarly activities to be grounded more in actual evidence have become louder, especially in the last decade. Four domains in particular have embraced evidence-based thinking, resulting in the respective developments of evidence-based medicine, evidence-based management, evidence-based education and evidence-based policy. Despite the presumed benefits of drawing on different sources of evidence for decision-making in practice, whether in medicine, management, education or policy, this does not seem to prevail. Whilst one likely reason for this slow uptake could simply be down to practitioners not always having much time to consult the evidence-base in their day-to-day work, another reason might be that they are not aware of specific insights applicable to their domain of work or to practice in general.
This is where the workshop contributes:
Representatives from the four key domains engaged with evidence-based practice will share with the audience their latest insights and the consequences thereof for practice. Further, all speakers will discuss questions such as:
What do we have in common?
How can we learn from one another?
How can we combine insights from the four domains?
These will be discussed as part of a concluding panel.
Workshop organiser:
Dr Celine Rojon, University of Edinburgh, celine.rojon@ed.ac.uk
Big data, evidence-based, predictive analytics, today these terms are all over the place. Is this just another fad or an irreversible trend? An increasing group of HR leaders relies on science, critical thinking and data analyses to make decisions.
Evidence-based HR, however, is still perceived by many as too time-consuming, narrow or impractical. Meanwhile, evidence-based practice is becoming mainstream in many other disciplines (like medicine). This is the momentum for pioneering HR leaders to seize the opportunity and make a difference with evidence. As part of an inclusive approach, valuing different perspectives.
We will enter into the dialogue about the why, the what, and most of all the how of evidence-based HR. How to get started and how to blend it with softer, less tangible HR practices? A pragmatic introduction, with realistic ambitions and openness towards other approaches.
Systematic review and evidence-based work and organizational psychology
Presentation by Prof. Rob Briner
17th congress of the European Association of Work and Organizational Psychology, Oslo
May 20, 2015
Hypothesis driven design is a powerful method to ensure features you build in your product are valuable and well evidenced. This quick presentation, delivered internally to DWP Digital colleagues, gives tips on writing high quality hypotheses to work from.
Psychological Safety : An Evidence Based Approachebbnflow
In this presentation we review 3 questions
What is psychological safety?
Why is psychological safety important for organisational change?
How can we make psychological safety work in practice?
Empathy is alive and and well in UX design. Many people apply empathy in their work. The slight problem is that the word “empathy” means different things to different people. And applying empathy doesn’t exactly bring a clear scenario to everyone’s mind. This presentation hopes to remedy this deficiency by providing a practice and vocabulary to dedevelop and apply empathy in your work.
DAS Slides: Data Quality Best PracticesDATAVERSITY
Tackling Data Quality problems requires more than a series of tactical, one-off improvement projects. By their nature, many Data Quality problems extend across and often beyond an organization. Addressing these issues requires a holistic architectural approach combining people, process, and technology. Join Nigel Turner and Donna Burbank as they provide practical ways to control Data Quality issues in your organization.
Researcher KnowHow session presented by Ruaraidh Hill PhD MSc FHEA Lecturer in evidence synthesis at the University of Liverpool and Angela Boland MSc PhD PGCert (LTHE)Director –Liverpool Reviews & Implementation Group
The Pharma 2020 series
The Pharmaceutical industry's long successful strategy of placing big bets on a few molecules, promoting them heavily and turning them into blockbusters worked well for many years, but its R&D productivity has now plummeted and the environment’s changing. PwC believes that seven major trends are reshaping the marketplace:
Source of info:
http://www.pwc.com/gx/en/pharma-life-sciences/pharma2020/index.jhtml#
Braun, Clarke & Hayfield Thematic Analysis Part 2Victoria Clarke
The second part of a four part lecture providing an introduction to thematic analysis and specifically the reflexive approach outlined by Braun and Clarke.
Between Black and White Population1. Comparing annual percent .docxjasoninnes20
Between Black and White Population
1. Comparing annual percent of Medicare enrollees having at least one ambulatory visit between B and W
2. Comparing average annual percent of diabetic Medicare enrollees age 65-75 having hemoglobin A1c between B and W
3. Comparing average annual percent of diabetic Medicare enrollees age 65-75 having eye examination between B and W
4. Comparing average annual percent of diabetic Medicare enrollees age 65-75 having
Students will develop an analysis report, in five main sections, including introduction, research method (research questions/objective, data set, research method, and analysis), results, conclusion and health policy recommendations. This is a 5-6 page individual project report.
Here are the main steps for this assignment.
Step 1: Students require to submit the topic using topic selection discussion forum by the end of week 1 and wait for instructor approval.
Step 2: Develop the research question and
Step 3: Run the analysis using EXCEL (RStudio for BONUS points) and report the findings using the assignment instruction.
The Report Structure:
Start with the
1.Cover page (1 page, including running head).
Please look at the example http://www.apastyle.org/manual/related/sample-experiment-paper-1.pdf (you can download the file from the class) and http://www.umuc.edu/library/libhow/apa_tutorial.cfm to learn more about the APA style.
In the title page include:
· Title, this is the approved topic by your instructor.
· Student name
· Class name
· Instructor name
· Date
2.Introduction
Introduce the problem or topic being investigated. Include relevant background information, for example;
· Indicates why this is an issue or topic worth researching;
· Highlight how others have researched this topic or issue (whether quantitatively or qualitatively), and
· Specify how others have operationalized this concept and measured these phenomena
Note: Introduction should not be more than one or two paragraphs.
Literature Review
There is no need for a literature review in this assignment
3.Research Question or Research Hypothesis
What is the Research Question or Research Hypothesis?
***Just in time information: Here are a few points for Research Question or Research Hypothesis
There are basically two kinds of research questions: testable and non-testable. Neither is better than the other, and both have a place in applied research.
Examples of non-testable questions are:
How do managers feel about the reorganization?
What do residents feel are the most important problems facing the community?
Respondents' answers to these questions could be summarized in descriptive tables and the results might be extremely valuable to administrators and planners. Business and social science researchers often ask non-testable research questions. The shortcoming with these types of questions is that they do not provide objective cut-off points for decision-makers.
In order to overcome this problem, researchers often seek to answer o ...
Module 4: Model Selection and EvaluationSara Hooker
Delta Analytics is a 501(c)3 non-profit in the Bay Area. We believe that data is powerful, and that anybody should be able to harness it for change. Our teaching fellows partner with schools and organizations worldwide to work with students excited about the power of data to do good.
Welcome to the course! These modules will teach you the fundamental building blocks and the theory necessary to be a responsible machine learning practitioner in your own community. Each module focuses on accessible examples designed to teach you about good practices and the powerful (yet surprisingly simple) algorithms we use to model data.
To learn more about our mission or provide feedback, take a look at www.deltanalytics.org.
Statistical Processes
Can descriptive statistical processes be used in determining relationships, differences, or effects in your research question and testable null hypothesis? Why or why not? Also, address the value of descriptive statistics for the forensic psychology research problem that you have identified for your course project. read an article for additional information on descriptive statistics and pictorial data presentations.
300 words APA rules for attributing sources.
Computing Descriptive Statistics
Computing Descriptive Statistics: “Ever Wonder What Secrets They Hold?” The Mean, Mode, Median, Variability, and Standard Deviation
Introduction
Before gaining an appreciation for the value of descriptive statistics in behavioral science environments, one must first become familiar with the type of measurement data these statistical processes use. Knowing the types of measurement data will aid the decision maker in making sure that the chosen statistical method will, indeed, produce the results needed and expected. Using the wrong type of measurement data with a selected statistic tool will result in erroneous results, errors, and ineffective decision making.
Measurement, or numerical, data is divided into four types: nominal, ordinal, interval, and ratio. The businessperson, because of administering questionnaires, taking polls, conducting surveys, administering tests, and counting events, products, and a host of other numerical data instrumentations, garners all the numerical values associated with these four types.
Nominal Data
Nominal data is the simplest of all four forms of numerical data. The mathematical values are assigned to that which is being assessed simply by arbitrarily assigning numerical values to a characteristic, event, occasion, or phenomenon. For example, a human resources (HR) manager wishes to determine the differences in leadership styles between managers who are at different geographical regions. To compute the differences, the HR manager might assign the following values: 1 = West, 2 = Midwest, 3 = North, and so on. The numerical values are not descriptive of anything other than the location and are not indicative of quantity.
Ordinal Data
In terms of ordinal data, the variables contained within the measurement instrument are ranked in order of importance. For example, a product-marketing specialist might be interested in how a consumer group would respond to a new product. To garner the information, the questionnaire administered to a group of consumers would include questions scaled as follows: 1 = Not Likely, 2 = Somewhat Likely, 3 = Likely, 4 = More Than Likely, and 5 = Most Likely. This creates a scale rank order from Not Likely to Most Likely with respect to acceptance of the new consumer product.
Interval Data
Oftentimes, in addition to being ordered, the differences (or intervals) between two adjacent measurement values on a measurement scale are identical. For example, the di ...
Running head SALES DECLINE AT MCDONALDS INC. .docxtoltonkendal
Running head: SALES DECLINE AT MCDONALDS INC. 1
SALES DECLINE AT MCDONALDS INC. 3
Sales Decline at McDonalds Inc.
Students’ Name
University Affiliation
Date
Business Decision Making
Sales Decline at McDonalds Inc.
This was an intriguing task and after much thought, the company I chose is McDonalds. McDonalds is the world's biggest chain of fast food eateries serving various countries over the world. McDonald’s eatery has worked as far as franchisee, subsidiary or the collaboration. The company picks up income from rent, charges and eminences from its establishments and deals from its worked stores. The company offers diverse items including cheeseburgers, chicken, French fries, milkshakes and pastries among numerous different things. In light of the arrangement of the company, McDonalds does not make any immediate offers of sustenance items rather composes and underpins the supply of nourishment to eateries through legitimized outsider administrators.
Sales Decline Problem
McDonald income fell by 11% in the principal quarter of 2015, which mirrors the antagonistic deals fall experienced. The company is attempting to enhance its deals because of the negative gauges among its sections. The administration of the company is continually trying to enhance the aggressiveness of the company towards addressing the shopper's needs. This would help in enhancing the general deals development and execution (Ritchie, Lewis, Nicholls and Ormston, 2013). The recently presented menu things and advancements neglected to pull in new clients from its rivals. For instance, its stores in France and Russia neglected to counterbalance the opposition in the UK. This has constrained McDonald to close some of its failing to meet expectations eateries in U.S and China.
Research Variable
One exploration variable is units of offers incomes sold by the company. Deals incomes are a critical variable, which demonstrates compelling in comprehension the nature and ramifications of the business decay issue. The comprehension and examination on the measure of the business income will be helpful in comprehension the issue confronting McDonalds Inc. The business variable is an autonomous variable, which relies on upon different variables including the advancement levels and accomplishment of showcasing effort. Therefore, the comprehension of the variable is basic in advancing the general exploration of the business decrease issue.
Straight Regression is the procedure of setting up a direct connection between to variables. In relapse, the normal slightest square strategy is utilized to build up direct connection between two variables.
The invalid theory of relapse is that the autonomous variable does not altogether influence the needy variable or β = 0. The substitute speculation is the free variable does not fundamentally influence subordinate variable or ...
Statistics is a mathematical science including methods of collecting, organizing, and analyzing data in such a way that meaningful conclusions can be drawn from them. In general, its investigations and analyses fall into two broad categories called descriptive and inferential statistics.
BUS308 – Week 1 Lecture 2 Describing Data Expected Out.docxcurwenmichaela
BUS308 – Week 1 Lecture 2
Describing Data
Expected Outcomes
After reading this lecture, the student should be familiar with:
1. Basic descriptive statistics for data location
2. Basic descriptive statistics for data consistency
3. Basic descriptive statistics for data position
4. Basic approaches for describing likelihood
5. Difference between descriptive and inferential statistics
What this lecture covers
This lecture focuses on describing data and how these descriptions can be used in an
analysis. It also introduces and defines some specific descriptive statistical tools and results.
Even if we never become a data detective or do statistical tests, we will be exposed and
bombarded with statistics and statistical outcomes. We need to understand what they are telling
us and how they help uncover what the data means on the “crime,” AKA research question/issue.
How we obtain these results will be covered in lecture 1-3.
Detecting
In our favorite detective shows, starting out always seems difficult. They have a crime,
but no real clues or suspects, no idea of what happened, no “theory of the crime,” etc. Much as
we are at this point with our question on equal pay for equal work.
The process followed is remarkably similar across the different shows. First, a case or
situation presents itself. The heroes start by understanding the background of the situation and
those involved. They move on to collecting clues and following hints, some of which do not pan
out to be helpful. They then start to build relationships between and among clues and facts,
tossing out ideas that seemed good but lead to dead-ends or non-helpful insights (false leads,
etc.). Finally, a conclusion is reached and the initial question of “who done it” is solved.
Data analysis, and specifically statistical analysis, is done quite the same way as we will
see.
Descriptive Statistics
Week 1 Clues
We are interested in whether or not males and females are paid the same for doing equal
work. So, how do we go about answering this question? The “victim” in this question could be
considered the difference in pay between males and females, specifically when they are doing
equal work. An initial examination (Doc, was it murder or an accident?) involves obtaining
basic information to see if we even have cause to worry.
The first action in any analysis involves collecting the data. This generally involves
conducting a random sample from the population of employees so that we have a manageable
data set to operate from. In this case, our sample, presented in Lecture 1, gave us 25 males and
25 females spread throughout the company. A quick look at the sample by HR provided us with
assurance that the group looked representative of the company workforce we are concerned with
as a whole. Now we can confidently collect clues to see if we should be concerned or not.
As with any detective, the first issue is to understand the.
Certified Specialist Business Intelligence (.docxdurantheseldine
Certified Specialist Business
Intelligence (CSBI) Reflection
Part 5 of 6
CSBI Course 5: Business Intelligence and Analytical and Quantitative Skills
● Thinking about the Basics
● The Basic Elements of Experimental Design
● Sampling
● Common Mistakes in Analysis
● Opportunities and Problems to Solve
● The Low Severity Level ED (SL5P) Case Setup as an Example of BI Work
● Meaningful Analytic Structures
Analysis and Statistics
A key aspect of the work of the BI/Analytics consultant is analysis. Analysis can be defined as
how the data is turned into information. Information is the outcome when the data is analyzed
correctly.
Rigorous analysis is having the best chance of creating the sharpest picture of what the data
might reveal and is the product of proper application of statistics and experimental design.
Statistics encompasses a complex and detailed series of disciplines. Statistical concepts are
foundational to all descriptive, predictive and prescriptive analytic applications. However, the
application of simple descriptive statistical calculations yields a great deal of usable information
for transformational decision-making. The value of the information is amplified when using these
same simple statistics within the context of a well-designed experiment.
This module is not designed to teach one statistic. It is designed to place statistical work within
the appropriate context so that it can be leveraged most effectively in driving organizational
performance..
An important review of the basic knowledge for work with descriptive and inferential statistics.
The Basic Elements of Experimental Design
Analytic tools also can provide an enhanced ability to conduct experiments. More than just
allowing analysis of output of activities or processes, experiments can be performed on
processes and the output of processes. Experimenting on processes is a movement beyond
the traditional r.
This presentation will address the issue of sample size determination for social sciences. A simple example is provided for every to understand and explain the sample size determination.
Primer on the application of statistical significance testing for business research purposes.
1) How to use statistics to make more informed decisions (and when not to use).
2) Highlight differences between statistics in science vs business.
3) Highlight assumptions, limitations and best practices.
Quantitative Critique Rubric- 5.25.2020Student Name .docxsimonlbentley59018
Quantitative Critique Rubric- 5.25.2020
Student Name: Article Title:
Areas of critique
Questions to be answered regarding article
Critique Responses
Points achieved
Intent of the
Research (7)
Is the title of the study clear? (1)
What is the research question(s) if stated? What is the hypothesis if stated? (3)
What are the issues or variables being studied? Are there Independent & Dependent variables identified? (3)
Significance of study (5)
How is the research problem significant to nursing?
How will the findings improve practice? (5)
Methods (26)
What is the study design? Describe. Was this appropriate? (5) What is the level of evidence in this research? Describe model used to evaluate level of research (3)
Was the sample randomized or not randomized? Was the sample selection addressed?(3)
Was the sample size adequate? Was there a power analysis done? (3)
What evidence was provided that biases were eliminated or minimized? What steps were taken to control confounding participant characteristics that could affect the equivalence of groups being compared? Were these steps adequate? (6)
What were the inclusion and exclusion criteria? (3)
Describe the instruments used- were they reliable/valid? Is this addressed? (3)
Procedures (6)
Describe how the data was collected- was it consistent? (3)
Were the dependent variables always obtained in the same manner? (3)
Analysis (32)
What type of analysis was done? Identify the statistics used-were they appropriate for level of measurement? All assumptions met? (5) Was rationale provided for use of statistical tests?
Was analysis appropriate for the design/methods used? (3)
Were the relevant sample demographics described? (3) Were they used to answer RQ when inferential statistics would have been more appropriate? (3)
What were the results of the study? (3) Were any results significant? What do the tests tell about the RQ or hypotheses? (3) Were any tests non-significant? Is it plausible that these reflect a Type II error? (3) What factors might have undermined the study’s statistical conclusion validity? (3)
Was an appropriate amount of statistical information reported? Are the findings clearly and logically organized? (3) Were tables or figures used to summarize large amounts of statistical information? (3)
Results and Interpretation (24)
What was the researcher's interpretation of the results? (3)
Do the results make sense? Did the researcher develop reasonable conclusions? (3)
Do the researchers discuss the limitations of the study and their possible effects on the credibility of the research? (3) Did the researchers discuss the generalizability of the results? (3) Did the researchers discuss the implications for clinical practice? (3)
What is your interpretation of the results? (3)
How would you improve upon this study if you w.
Similar to Teaching students how to critically appraise organizational data (17)
Talent Management – What’s the Evidence?
With Rob Briner & Eric Barends
28th April 2016, 3:00PM-5:00PM, IMI Conference Centre, Dublin 16
In this session, Rob Briner, Prof. of Organisational Psychology, University of Bath and Eric Barends, MD, Centre for Evidence-Based Management, put talent management under the microscope. They challenge some of the traditional thinking behind talent management shaped almost 20 years ago by The War for Talent – including the idea that potential can readily be identified in complex roles and that the best organisations have the best people.
The Case for Competition: Learning About Evidence-Based Management Through Case Competition
Presentation by Tina Saksida, UPEI
AOM Annual Meeting, 2015, Vancouver
From Passively Received Wisdom to Actively Constructed Knowledge:Teaching Systematic Review Skills As a Foundation of Evidence-Based Management
Presentation by Rob Briner and Neil Walshe
AOM Annual Meeting 2015, Vancouver
Presentation of the first two online learning modules developed by the Center for Evidence-Based Management and Carnegie Mellon' Online Learning initiative
Evidence-Based Management
Augmenter sa crédibilité de partenaire d’affaires par l’utilisation de données probantes.
Congres International Francophone Des Ressources Humaine
Lucie Morin, Jean-Luc Plante
21 Octobre
Palais des Congres, Montreal
More from Center for Evidence-Based Management (18)
Instructions for Submissions thorugh G- Classroom.pptxJheel Barad
This presentation provides a briefing on how to upload submissions and documents in Google Classroom. It was prepared as part of an orientation for new Sainik School in-service teacher trainees. As a training officer, my goal is to ensure that you are comfortable and proficient with this essential tool for managing assignments and fostering student engagement.
Operation “Blue Star” is the only event in the history of Independent India where the state went into war with its own people. Even after about 40 years it is not clear if it was culmination of states anger over people of the region, a political game of power or start of dictatorial chapter in the democratic setup.
The people of Punjab felt alienated from main stream due to denial of their just demands during a long democratic struggle since independence. As it happen all over the word, it led to militant struggle with great loss of lives of military, police and civilian personnel. Killing of Indira Gandhi and massacre of innocent Sikhs in Delhi and other India cities was also associated with this movement.
Francesca Gottschalk - How can education support child empowerment.pptxEduSkills OECD
Francesca Gottschalk from the OECD’s Centre for Educational Research and Innovation presents at the Ask an Expert Webinar: How can education support child empowerment?
The French Revolution, which began in 1789, was a period of radical social and political upheaval in France. It marked the decline of absolute monarchies, the rise of secular and democratic republics, and the eventual rise of Napoleon Bonaparte. This revolutionary period is crucial in understanding the transition from feudalism to modernity in Europe.
For more information, visit-www.vavaclasses.com
Honest Reviews of Tim Han LMA Course Program.pptxtimhan337
Personal development courses are widely available today, with each one promising life-changing outcomes. Tim Han’s Life Mastery Achievers (LMA) Course has drawn a lot of interest. In addition to offering my frank assessment of Success Insider’s LMA Course, this piece examines the course’s effects via a variety of Tim Han LMA course reviews and Success Insider comments.
Read| The latest issue of The Challenger is here! We are thrilled to announce that our school paper has qualified for the NATIONAL SCHOOLS PRESS CONFERENCE (NSPC) 2024. Thank you for your unwavering support and trust. Dive into the stories that made us stand out!
Palestine last event orientationfvgnh .pptxRaedMohamed3
An EFL lesson about the current events in Palestine. It is intended to be for intermediate students who wish to increase their listening skills through a short lesson in power point.
Acetabularia Information For Class 9 .docxvaibhavrinwa19
Acetabularia acetabulum is a single-celled green alga that in its vegetative state is morphologically differentiated into a basal rhizoid and an axially elongated stalk, which bears whorls of branching hairs. The single diploid nucleus resides in the rhizoid.
How to Make a Field invisible in Odoo 17Celine George
It is possible to hide or invisible some fields in odoo. Commonly using “invisible” attribute in the field definition to invisible the fields. This slide will show how to make a field invisible in odoo 17.
4. Barriers students need to be aware of
1. Absence of a logic model
2. GIGO: Garbage In, Garbage Out
3. Measurement errors
4. Small numbers problem
5. Confusing percentages and averages
6. Misleading graphs
7. Goodness of fit
8. BIG data and other fancy stuff
5. Logic model: a definition
A logic model spells out the process by which we expect
underlying cause(s) to lead to a problem and produce
certain organizational consequences.
Think of a logic model as a short narrative explaining why
or when a problem occurs and how this leads to a
particular outcome.
8. Absence of a logic model
Formulating a logic model prevents a ‘fishing
expedition’ in which a voluminous amount of data is
captured and exhaustively analyzed – an
inappropriate practice that increases the chance of
detecting non-existing relationships between the
variables.
A logic model help tie assumptions about problems
(or preferred solutions) to ‘real’ tangible relationships
linked by evidence
10. 1. Absence of a logic model
2. GIGO: Garbage In, Garbage Out
3. Measurement errors
4. Small numbers problem
5. Confusing percentages and averages
6. Misleading graphs
7. Goodness of fit
8. BIG data and other fancy stuff
Barriers students need to be aware of
11. Garbage in garbage out
Unreliable data, inaccurate data, irrelevant data
12. Garbage in garbage out
Unreliable data, inaccurate data, irrelevant data
13. 1. Absence of a logic model
2. GIGO: Garbage In, Garbage Out
3. Measurement error
4. Small numbers problem
5. Confusing percentages and averages
6. Misleading graphs
7. Goodness of fit
8. BIG data and other fancy stuff
Barriers students need to be aware of
14. Measurement error
Whenever something is observed and measured
(from profit to intelligence), its score is likely to
deviate somewhat from its true score. This
deviation is measurement error (also known as
unreliability).
Nothing is measured perfectly
15. Measurement error
NB:
Two variables that are measured with little
error can be the origins of a variable with great
measurement error.
Measurement error tends to be greater where the variable is a
difference score (= one variable minus another). A difference
score has lower reliability than the two variables that compose
it when those two variables are positively correlated.
16. 1. Absence of a logic model
2. GIGO: Garbage In, Garbage Out
3. Measurement errors
4. Small numbers problem
5. Confusing percentages and averages
6. Misleading graphs
7. Goodness of fit
8. BIG data and other fancy stuff
Barriers students need to be aware of
17. A certain town is served by two hospitals. In the larger hospital
about 45 babies are born each day, and in the smaller hospital
about 15 babies are born each day. As you know, about 50% of
all babies are boys. However, the exact percentage varies from
day to day. Sometimes it may be higher than 50%, sometimes
more. For a period of 1 year, each hospital recorded the days on
which more than 60% of the babies born were boys. Which
hospital do you think recorded more such days?
1. The larger hospital
2. The smaller hospital
3. About the same (within 5% of each other)
4. I don’t know
Small numbers problem
18. Law of large numbers
The larger the sample size (or the number of
observations), the more accurate the predictions of the
characteristics of the whole population, and smaller
the expected deviation in comparisons of outcomes.
19. The small number problem often arises in
three situations:
1. When organizations compare units (e.g. teams,
departments or divisions) unequal in size.
2. When organizations collect data from a sample rather than
from the whole organization.
3. When organizations have access only to a small sample of
the total market population.
20. 1. Absence of a logic model
2. GIGO: Garbage In, Garbage Out
3. Measurement errors
4. Small numbers problem
5. Confusing percentages and averages
6. Misleading graphs
7. Goodness of fit
8. BIG data and other fancy stuff
Barriers students need to be aware of
21. A pharmaceutical company has tested a new,
experimental drug for Parkinson’s disease. Compared
with drugs currently prescribed, the new drug
decreases symptoms such as tremors, limb stiffness,
impaired balance and slow movement by 30 percent.
However, compared with the existing drugs, the
mortality rate of patients taking the new drug (those
dying because of serious side effects) has increased by
200 percent. Would you decide to bring this new drug
to the market?
Confusing percentages
22. Most people will be inclined to say no, because a 200
percent mortality rate increase sounds pretty
dramatic. However, this depends on the base value. If
the mortality rate of the existing drugs is only 1 in
350,000 patients (0.000003 percent), a relative
increase of 200 percent means an absolute increase of
only two in 350,000 patients (0.000006 percent). In all,
the new drug sounds like it has better outcomes,
especially as a patient’s improvement in health would
be substantial.
Confusing percentages
23. NOTE:
Whenever changes or differences are presented as
percentages, we must make clear whether these
differences are relative or absolute. Ideally both types
– including the number of standardized units they
represent – should be reported.
Confusing percentages
26. Standard deviation > effect size
The standard deviation (often abbreviated SD) is also
helpful in determining the size of a change or difference.
If you take the percentage of change and divide it by the
standard deviation, you get a good impression of its
magnitude.
In the social sciences, a change of 0.2 is usually
considered a small difference, while 0.5 is considered a
moderate difference, and 0.8 is a large difference
27. Standard deviation > effect size
In the past four years, an Italian shoe factory has experienced multiple
restructurings and downsizings, reducing its workforce from 800 to
fewer than 500 factory workers. The HR Director believes that this has
been very stressful for the workers, causing a dramatic productivity
decline. He decides to introduce a stress-reduction program, including
on-site chair massage therapy.
A few months after the program is introduced, organizational data
indicate productivity has gone up: the workers average (mean)
productivity has increased by five percent from 200 shoes to 210
shoes per day, with a standard deviation of 7. A 5 percent change
equals 5/7 = .7 standard deviation, so this suggests that the program
may have had a large impact.
28. 1. Absence of a logic model
2. GIGO: Garbage In, Garbage Out
3. Measurement errors
4. Small numbers problem
5. Confusing percentages and averages
6. Misleading graphs
7. Goodness of fit
8. BIG data and other fancy stuff
Barriers students need to be aware of
29.
30.
31.
32.
33.
34.
35. 1. Absence of a logic model
2. GIGO: Garbage In, Garbage Out
3. Measurement errors
4. Small numbers problem
5. Confusing percentages and averages
6. Misleading graphs
7. Goodness of fit
8. BIG data and other fancy stuff
Barriers students need to be aware of
37. Correlations: r-squared (variance explained)
To get a better idea of how strongly two metrics are correlated, we can
take a look at the r2 (pronounced “r-squared”). The r2 indicates the
extent variation or differences in one metric can be explained by a
variation or differences in a second metric. The r2 is expressed as a
percentage and can easily be calculated by squaring the correlation
coefficient.
For example, if the organizational data show that the correlation
between customer satisfaction and sales performance is r = .5, then the
r-squared is .25, indicating that 25 percent of the variation in sales
(increase or decrease) can be explained by a differences in customer
satisfaction.
38. Regression
Regression
Predicting an outcome variable from one predictor
variable (simple regression) or several predictor
variables (multiple regression)
Example
For every one degree rise in temperature,
1.18 more ice cream bars are sold on average
40. A regression coefficient tells you how much the outcome metric
is expected to increase (if the coefficient is positive) or
decrease (if the coefficient is negative) when the predictor
metric increases by one unit. There are two types of regression
coefficients: unstandardized and standardized. An
unstandardized coefficient concerns predictor and outcome
metrics that represent “real” units (e.g. sales per month, points
on a job satisfaction scale or numbers of errors). In that case,
the coefficient is noted as “b”.
For example, when a predictor metric temperature is regressed
on the number of ice creams sold, a regression coefficient of b
= 8.3 means that for every one degree rise in temperature, 8.3
more ice cream bars are sold on average.
Regression coefficients: unstandardized
41. A standardized coefficient involves predictor and outcome
metrics expressed in standard deviations. In that case, the
coefficient is noted as 𝛃 (pronounced as beta). Betas provide
information about the effect of the predictor metric on the
outcome metric. As explained in Chapter 7, in case of a simple
regression a 𝛃 of .10 is considered a small effect, whereas a
𝛃 of .60 is considered a large effect. In the case of a multiple
regression the thresholds are slightly higher (𝛃 = .20 is
considered small, 𝛃 = .80 is considered large).
Regression coefficients: standardized
43. Regressions: goodness of fit
In a regression analysis, the R2 tells us how close the
observed data are to the regression line. Put differently, it is
the percentage of the outcome metric that, based on the
regression coefficient, is predicted by the predictor metric.
For example, when the unstandardized regression coefficient
b for customer satisfaction and the number of sales is 30.2,
this indicates that for one point of improvement in the level of
customer satisfaction, on average 30.2 more products are
sold. However, when the R2 is only .18, this means that the
level of customer satisfaction can predict only 18 percent of
the number of sales.
44. 1. Absence of a logic model
2. GIGO: Garbage In, Garbage Out
3. Measurement errors
4. Small numbers problem
5. Confusing percentages and averages
6. Misleading graphs
7. Goodness of fit
8. BIG data and other fancy stuff
Barriers students need to be aware of
47. The number of medication errors in Unit 1 were 200%
greater in 2011 than Unit 2. Is patient safety worse in
Unit 1?
Let’s practice
48. The number of medication errors in Unit 1 were 200%
greater in 2011 than Unit 2. Is patient safety worse in
Unit 1? Depends on number of unsafe incidents divided
by # patients or # procedures—needs a control
Let’s practice
49. Unit 1 has 10 employees and 20% turnover while Unit 2
has 55 employees and 10% turnover. Is retention better
in Unit 1?
Let’s practice
50. Unit 1 has 10 employees and 20% turnover while Unit 2
has 55 employees and 10% turnover. Is retention better
in Unit 1? Hard to determine. Small units tend to have
smaller numbers of observations, so its data might
contain more random error.
Let’s practice