SlideShare a Scribd company logo
1 of 79
Quantitative Critique Rubric- 5.25.2020
Student Name:
Article Title:
Areas of critique
Questions to be answered regarding article
Critique Responses
Points achieved
Intent of the
Research (7)
Is the title of the study clear? (1)
What is the research question(s) if stated? What is the
hypothesis if stated? (3)
What are the issues or variables being studied? Are there
Independent & Dependent variables identified? (3)
Significance of study (5)
How is the research problem significant to nursing?
How will the findings improve practice? (5)
Methods (26)
What is the study design? Describe. Was this appropriate? (5)
What is the level of evidence in this research? Describe model
used to evaluate level of research (3)
Was the sample randomized or not randomized? Was the sample
selection addressed?(3)
Was the sample size adequate? Was there a power analysis
done? (3)
What evidence was provided that biases were eliminated or
minimized? What steps were taken to control confounding
participant characteristics that could affect the equivalence of
groups being compared? Were these steps adequate? (6)
What were the inclusion and exclusion criteria? (3)
Describe the instruments used- were they reliable/valid? Is this
addressed? (3)
Procedures (6)
Describe how the data was collected- was it consistent? (3)
Were the dependent variables always obtained in the same
manner? (3)
Analysis (32)
What type of analysis was done? Identify the statistics used-
were they appropriate for level of measurement? All
assumptions met? (5) Was rationale provided for use of
statistical tests?
Was analysis appropriate for the design/methods used? (3)
Were the relevant sample demographics described? (3) Were
they used to answer RQ when inferential statistics would have
been more appropriate? (3)
What were the results of the study? (3) Were any results
significant? What do the tests tell about the RQ or hypotheses?
(3) Were any tests non-significant? Is it plausible that these
reflect a Type II error? (3) What factors might have undermined
the study’s statistical conclusion validity? (3)
Was an appropriate amount of statistical information reported?
Are the findings clearly and logically organized? (3) Were
tables or figures used to summarize large amounts of statistical
information? (3)
Results and Interpretation (24)
What was the researcher's interpretation of the results? (3)
Do the results make sense? Did the researcher develop
reasonable conclusions? (3)
Do the researchers discuss the limitations of the study and their
possible effects on the credibility of the research? (3) Did the
researchers discuss the generalizability of the results? (3) Did
the researchers discuss the implications for clinical practice?
(3)
What is your interpretation of the results? (3)
How would you improve upon this study if you were to conduct
a similar study? (3)
Can the study results make an important contribution? (3)
Total points: 100
Quantitative Critique Rubric 5.25.2020
PART IWelcome to the Free Excel Student Template Version
18.1Dear Student,By using this Template, you hereby agree to
the Copyright terms and conditions. This Template should save
you considerable time and allow for your presentation to be
more professional. Do not mistake this Template for doing all
of the work. Your assignment is to analyze and present
strategies for the next three years. You will still need to do the
research and enter key internal and external information into the
Template. The Template does not gather or prioritize
information. It does however assimilate information you enter
in a professional way and does many calculations for you once
that critical information is entered. Refer to the David & David
textbook for conceptual guidelines for developing all matrices
and analyses included in this Template. Best of luck with your
project. This Template is designed for Textbook editions 17ed
and 18th. Instructions for Using the Template1Please read all
Template instructions below carefully before you start each new
section of this Template. Only type in the green boxes. Refer
to the David, David & David textbook for conceptual guidelines
for every matrix and analysis in this Template.2This Template
is organized into three primary parts: Part I, Part II, and the
respective data output pages for your respective matrices. All
data entered will be entered into Part I or Part II. Part I consists
of data entry in developing matrices, where Part II consists of
data entry for your financial information, including ratios,
financial statements, and projected financial statements. Blue
buttons are provided for navigating within and to Part I, yellow
buttons are for navigating within and to Part II, orange buttons
are for navigating to the respective matrices and pink buttons
are for navigating to your financial output tables. The
navigation buttons along the top of Part I and Part II may not be
visible for Apple users but all other features should work
without any problems.Strengths and Weaknesses1Enter into the
Template exactly 10 strengths and 10 weaknesses, no more and
no less. Your factors should be detailed and actionable rather
than vague. For example, the strength: "Sales up nicely" is too
vague and not actionable; "Sales were up 15% on women's
apparel in China during 2018" is stated far better. Always be
thinking in terms of divisions when writing strengths and
weaknesses. Note women's apparel could be a division for Nike.
All divisions do not need to be treated equally; allow more
coverage for divisions with more revenue and those most
pertinent to your strategic plan.2Weights reveal how important
a factor is to being successful in the industry. All weights are
"industry-based." A factor of 0.10 for example is 5 times more
important than a factor of 0.02 for being successful in the
industry. Do not be afraid to include factors with lower weights
though. To have a factor make your top 10 list (10 strengths for
example out of the 100s the firm likely has), justifies its
importance, yet it still may be relatively a lot less important to
the industry than others factors you include. Also, be mindful
with respect to what industry your firm operates. A moderate
priced casual hamburger restaurant may have more in common
with a moderate priced chicken restaurant than with McDonalds
(cheaper fast-food). Automatically considering McDonalds,
Burger King, and Wendy's as the "industry" just because they
all sell hamburgers may not be appropriate. Here, casual
moderated priced restaurants may serve better as the "industry."
After entering in the weights, check to make sure the sum of
your weights equals 1.0 for your internal factors. Also, arrange
your strengths with highly weighted factors listed first; arrange
your Weaknesses also with highest weighted factors listed
first.3In contrast to weights that are industry-based, ratings are
company-based and reveal how well your firm is performing.
Use the coding scheme given below for ratings in an IFE
Matrix: If your strengths are being cut off, simply drag your
cursor between the two row numbers on the left to widen the
row.1 = "the response is poor"2 = "the response is average3 =
"the response is above average"4 = "the response is
superior"StrengthsWeightRatingActionableQuantitativeCompara
tiveDivisional1Direct owner ship of 51% of stores1yyyy2Q2
2018 Same store sales increase 2% globally/4% in China, record
profit 6B2yyyy3Pay employees well, above average pay, Stock
options, Parental leave options2yyyy4Supply Chain
Management (consistent quality in raw materials, and
flow)2ynyy5Product Quality and consistency2ynyy6Ethical
Business Values2ynyy7Brand Equity - Well known
brand1yyy8Operational efficiency, and solid Financial
Performance - increasing profits (operating margin 6.5% vs
industry avg of 5%)1yyyy9Customer loyalty programs, and
chase visa rewards program (53% of us corp store
sales)3yyyy10Reinvestment Strategy, long term strategic
planning - Multi-faceted strategic plan per
region1yyyyWeaknessesWeightRatingActionableQuantitativeCo
mparativeDivisional1EMEA Market, 11% decline in operating
profits 20181yyyy2SBUX is highly dependent on the financial
performance on North America (77% of profit)yyyy3Higher
prices than competition(38% higher)yyyy4Products are not very
distinct, other franchises have nearly identical products -
McDonalds McCafé, Dunkin Donuts and a greater variety to
draw in customersyyy5Product Recalls have had detrimental
impact on the brandynyy6Issues with European taxes not being
paid ( UK no taxes on 1.2B pounds in 2011-2012)yyyy7Product
Standards - unhealthy products, Starbucks built brand on
flavored and sweetened items, does not meet some cultural
norms and are high calories, overdependence on coffee
products1yyyy8Starbucks rely' s on foot traffic, not pandemic
friendlynyy9volatile supply costsnnyy10Customer base is mid
to upper calls wage earnersyyyyTotal Weight (Must Equal
1.00)0.000.7725550225Opportunities and Threats1Enter into
this Template exactly 10 opportunities and 10 threats, no more
no less. Your factors should be detailed and actionable rather
than vague. Keep in mind both opportunities and threats should
be external in nature. Ask yourself "Does the firm have control
over this factor?" If the answer is yes, then it cannot be an
opportunity or threat. For example, as a clothing retailer you
may have an opportunity to "start selling clothes in China." This
is not an opportunity for two reasons: 1) the firm has internal
control over doing business in China, and 2) the statement is a
strategy. The underlying opportunity may be "Women in China
spent 20% more on athletic apparel in 2018." Note how this
opportunity is specific, actionable, divisional, and external (we
cannot control the culture or demand for female athletic
apparel). All divisions do not need to be treated equally, allow
more coverage for divisions with more revenue and those most
pertinent to your strategic plan.2Weights reveal how important
a factor is to being successful in the industry. Read over the #2
tip under strengths and weaknesses above since the same logic
applies for the external factors. After entering in the weights,
check to make sure your sum of weights equals 1.0 for all 20
external factors. List factors according with highest weight
items first.3Ratings again are company-based and reflect how
well the firm is addressing the particular factor. Use the coding
scheme given below for ratings in an EFE Matrix. If your
opportunities are being cut off, simply drag your cursor between
the two row numbers on the left to widen the row.1 = the
response is poor"2 = "the response is average"3 = "the response
is above average"4 = "the response is
superior"OpportunitiesSFWeightRatingWRActionableQuantitive
ComparableDivsional1Premium Experience at Reserve stores
with Princi, expand bar service, premium food
options50.0430.1063829787YNYy2Coffee subscription (Circle
K- 200% increase in foot traffic, 70% increase if food sales, 90-
95%RenewAL RATE)80.0640.2269503546yYyy3Diversification
into more products beyond Coffee and Tea into more food
products80.0620.1134751773YNYn4Emerging markets - enter
markets with limited competition, adapt to local markets - ex
McDonalds in India does not sell beef, but has ventured into the
vegetarian food market.70.0530.1489361702yyy5competitive
pricing50.0430.1063829787Yyy6Follow latest drink
trends90.0630.1914893617yyy7steady forecast for revenue
growth/consumption growth80.0610.0567375887nnnn8Business
partnerships and alliances (potentially responsible for sales by
1/3)40.0330.085106383ynyy9Faster Service - Corrective
measures to fix long lines - more advanced
Machines?90.0640.2553191489yyyy10Self-service
Machines70.0540.1985815603yyyyThreatsWeightRating1Dunki
n Donuts 2nd in market shares in USA, and growing with coffee
adjacent products70.0540.1985815603yyyy2McDonalds 2nd in
market share globally70.0540.1985815603yyyy3Sales decline
due to decline in customer
traffic90.0630.1914893617nnyy4Brand Relevance - Business
incidents (Unionization)60.0430.1276595745ynyy5evolving
consumer preferences and tastes80.0630.170212766ynyy6Cyber
Security and Data
Privacy40.0330.085106383ynyy7Pandemic/Global Recession -
temporary closed 2K stores in China, 50% of corp stores and
43% of licensed stores-lost 915M+ so far (June
2021)80.0630.170212766nyyy8Increased costs to maintain
supply chains, and raw material costs, and high
50.0440.1418439716yyyy9Competition from local favorite
brands(incumbents) , EMEA has a different coffee
culture90.0630.1914893617nyyy10Executive Changeover -
Chief Executive (Howard Shultz) retiring for the 3rd
time80.0610.0567375887nnyn141Total Weight (Must Equal
1.00)1.00Competitive Profile Matrix (CPM)1To perform the
CPM, enter up to 12 critical success factors. You may use some
of the ones listed below if you like but try to use ones that are
more pertinent to your company. For example, if your case is
Delta Airlines, perhaps include on time arrival, extra fees, and
frequent flyer points as factors, rather than the canned factors
below. In a CPM, factors do not need to be overly specific, but
they should be divisional in nature to the extent possible. If
Pepsi Co. is your firm, your factors should be about the firm's
soda business, Frito Lay business, bottling business, etc. (Pepsi
Co competes in a lot more than just soda) rather than just
general "advertising." Advertising for what division (business)
are you referring to? Frito Lay's advertising, soda marketing,
etc. All divisions do not need to be treated equally; allow more
coverage for divisions with more revenue and those most
pertinent to your strategic plan.2After entering in your critical
success factors, enter in a weight for each factor; weights are
industry-based. Be sure to check the bottom of the "Enter
Weight Below" column, to make sure your sum weight is equal
to 1.00. It is okay for some factors to receive a low weight and
a factor or two to receive a high weight of say 0.20. 3After
entering in your weights, type the name of your company and
two other competitors in the corresponding boxes.4After
entering in the weights and identifying your company and two
rival firms, then enter in a Rating (company-based) in the
"Enter Rating Below" column for each organization. DO NOT
ASSIGN THE COMPANIES THE SAME RATING; TAKE A
STAND; MAKE A CHOICE. In a CPM, use the coding scheme
provided below for ratings.1 = "the response is poor"2 = "the
response is average"3 = "the response is above average"4 = "the
response is superior"Enter 12 Factors Below WeightYour
FirmRivalRivalEnter Ratings BelowAdvertisingDomestic
Market PenetrationCustomer ServiceProduct
VarietyInternational Market Penetration Employee
DedicationFinancial ProfitCustomer LoyaltyMarket
ShareProduct QualityTop ManagementPrice
Competitiveness0.00Boston Consulting Group (BCG)
Matrix1This Template allows for up to 5 divisions. If your
company has more than 5 divisions, combine the divisions with
the least amount of revenue into division 5, and mention the
adjustment to the class during your presentation, or simply
focus on the 5 divisions your 3-year plan centers around; check
with your professor. <See your firm's Form 10K or Annual
Report to find divisional information, and those documents of
your rivals> It is excellent to develop a BCG/IE by geographic
region, and construct another one by product (if you have the
data). 2In each division, enter a name, followed by the dollar
amount in revenues for that division. Do not include M or B for
millions or billions, but do drop off zeros. For example, for
$100,000,000, you could enter $100,000 or $100, just be
consistent.3After completing Step 2 in developing a BCG, enter
in the dollar amount in revenues for the top rival firm for each
division. Note, the top rival may be you and in this situation
enter in your company's revenue for that division. Also, note the
top rival may be different for different divisions. For example,
if your firm is Avon, Avon's top rival in its lipstick division
may be Revlon, but for nail polish, the top rival in the industry
may be L'Oréal, and in makeup, Avon may be the market leader.
There is no need to label the top rival by name, but you could
mention in class as part of your presentation. Be sure to enter in
all numbers in the same $ format you used in Step 2 above. If
you do not have a perfect apples to apples comparison,
(possibly a rival firm combines lipstick and makeup, where your
firm separates the two) then estimate as best you can and make
note in your presentation.4Finally, enter in the industry growth
rate (IGR) for each division. Generally, taking the top 2 or 3
rivals for each division (along with your firm), adding their
numbers together for the current year and the previous year and
using the equation (Current Year - Previous Year) / Previous
Year is sufficient to estimate guess of the industry growth rate.
This is because generally the top 3 players dominate an
industry. Note, using this process also weights larger firms
more, which is exactly what you desire. Do not use total
revenues; instead, use divisional revenues. Division industry
growth rates (IGR) must be between -0.20 and 0.20. If outside
these ranges, simply use -0.20 or 0.20 and mention during your
presentation.5Everything is calculated and positioned for you
(Other than Industry Growth Rate in Step 4) including the
Relative Market Share Position (RMSP). The BCG matrix in
this Template does not produce pie slices to show profits. You
may wish to discuss divisional profits in your
presentation.Enter in division names below (If less than 5, leave
the other spaces blank and no circles will appear)Your Firm's
Division RevenuesTop Firm in Industry Division
RevenuesDivision Market Growth Rate (Step 4)Relative Market
Share PositionHandcrafted beverages
$18.20$18.200.201.00Food$5.16$23.200.200.22Other
(merchandise, grab-and-
go)$1.24$1.240.051.00NANAMcDonalds is top food rival
Internal - External (IE) Matrix1This Template allows for up to 5
divisions. If the company has more than 5 divisions, combine
the divisions with the least amount of revenue into division 5,
and mention the adjustment to the class during your
presentation, or simply focus on the 5 divisions that your 3-year
plan centers around; check with your professor.2Company wide
EFE and IFE scores are automatically entered once you
complete the EFE and IFE Matrices.3Enter in estimated EFE
and IFE Scores for your respective divisions.4This Template's
IE matrix does not produce pie slices to show profits. Enter The
Name Of Your FirmEnter in division names below. If less than
5, leave the other spaces blank and no circles will appear.
Remember you could use divisions by geographic region for the
BCG and by product/service type for the IE (or vice versa).Your
Firm's Division RevenuesEstimated IFE ScoreEstimated EFE
ScoreAmerica$15,6523.23.5CAP$3,2403.03.0EMEA$1,0142.01.
2Channel Development$2,0092.52.8All other
segments$4721.82.0SPACE Matrix1Include up to five factors to
assess each SPACE axis: Financial Position (FP), Stability
Position (SP), Competitive Position (CP), and Industry Position
(IP) and the corresponding rating each factor should
receive.2You may use the factors provided here, but try to
determine key factors related to your company and industry in
the same manner you did with the CPM. The calculations are
done automatically and the rating scale is provided
below.3Enter in the estimated FP, SP, CP, and IP numbers for
up to two competitors. Or, instead of a competitor, you could
show the estimated SPACE values for your firm after your
proposed recommendations are implemented, ie a Before and
After analysis. Or you could do both, just cut and paste the
SPACE into PowerPoint then refill in the new data. It is
important you fill in all information or Excel will place a
circle(s) at the origin of the SPACE since the default will be
(0,0) plot, which is the origin. FP and IPPositive 1 (worst) to
Positive 7 (best)CP and SPNegative 1 (best) to Negative 7
(worst)Starbucks
CorporationRatingsSBUXMcDonaldsKhcFinancial Position
(FP)Current
Ratio41.19691.7782https://www.macrotrends.net/stocks/charts/
SBUX/starbucks/financial-ratiosDebt to Equity7-2.7502-
7.7424https://www.macrotrends.net/stocks/charts/SBUX/starbuc
ks/financial-ratiosNet Income6$ 6,396,200$
12,224,100https://www.macrotrends.net/stocks/charts/SBUX/sta
rbucks/income-statementRevenue7$ 29,060,600$
23,222,900https://www.macrotrends.net/stocks/charts/SBUX/sta
rbucks/income-statementInventory
Turnover75.4484191.4155https://www.macrotrends.net/stocks/c
harts/SBUX/starbucks/financial-ratiosIndustry Position
(IP)Growth Potential6Financial Stability7Ease of Entry into
Market4Resource Utilization6Profit
Potential7RatingsCompetitive Position (CP)Market Share-
1Product Quality-4Customer Loyalty-2Variety of Products
Offered-6Control over Suppliers and Distributors-1Stability
Position (SP)Rate of Inflation-5Technological Changes-5Price
Elasticity of Demand-3Competitive Pressure-4Barriers to Entry
into Market-2Your firm's X-axis3.2Your firm's Y-
axis2.4MCDonaldsEstimated FP6Estimated IP7Estimated CP-
2Estimated SP -2Competitor 1's X-axis5.0Competitor 1's Y-
axis4.0Maxwell HouseEstimated FP2Estimated IP4Estimated
CP-6Estimated SP -1Competitor 2's X-axis-2.0Competitor 2's
Y-axis1.0Perceptual Map1In this Template's Perceptual Map,
you may include for up to 10 product categories. 2Enter in the
X axis and Y axis dimensions. For example, if developing a map
for frozen foods your X axis could range from "low calorie" to
"high calorie," while the Y axis ranges from "low cost" to "high
cost."3Enter in the products you wish to compare (up to 10); in
the example, these products would be different brands of frozen
foods available for purchase. After entering in the products, rate
each factor on a scale of 1 to 9. In our example, extremely low
calorie would receive a score of 1 or 2, and likewise extremely
high calorie should receive a score of 8 or 9.4To enhance this
analysis, you could mentally draw a line (or two lines) of best
fit (through products) and identify areas along the line that do
not have (in this example) frozen food products near the line. In
this analysis, blank areas of the map are typically the most
advantageous for new product creation. Any products that fall
well above or below the line, may be over or under serving
customers and should be examined closely. Do not blindly
follow this rule of thumb however since, for example, a very
expensive product may be well off the projected best fit line and
yet serve its small customer base quite well. You may with this
Template wish to develop several perceptual maps changing
your X and Y dimensions. For example, if you are a large food
processor, you could examine frozen foods on dimensions other
than the ones used here, or you could examine dairy products or
any other related products. Simply cut and paste your existing
map into Power Point then enter your data for a new map.Enter
The Name of the Dimensions on the X-axisEnter The Name of
the Dimensions on the Y-axisEnter in up to 10 productsX - axis
RatingY - axis RatingGrand Strategy Matrix1The Grand
Strategy Matrix allows for entry of your firm and up to 5
divisions2Rank the X axis from 1 (Extremely Weak Competitive
Position) to 9 (Extremely Strong Competitive Position)3Rank
the Y axis from 1 (Extremely Slow Market Growth) to 9
(Extremely Rapid Market Growth)X-axis scoreY-axis
scoreSWOT1Click on the SWOT Hyperlink below and add your
SLOWEST, and WT Strategies.QSPM1.To perform a QSPM,
enter two strategies in the corresponding green boxes below.
These two strategies should be derived from your BCG, IE,
SPACE, GRAND, and SWOT. In your oral or written project,
you will need to provide a recommendations page(s) on your
own with the expected cost of each recommendation, ie after
performing the QSPM. The recommendations page is followed
by an EPS/EBIT Analysis to reveal where best to obtain the
needed capital (debt vs equity). You should have multiple
recommendations, including perhaps both strategies included in
the QSPM, and other strategies for the firm - but no firm can do
everything that would benefit the firm due to limited
resources.2.In developing a QSPM, after entering in your
strategies, then rate each strategy based on the strengths,
weaknesses, opportunities, and threats (factors). Do not give
two strategies the same rating for a particular strength,
weakness, opportunity, or threat. (the exception is if you enter 0
to signify a factor "not impacting the choice between strategies"
then you MUST enter 0 for both strategies. For example, if
Strategy 1 deserves a rating of 4 on a given factor, but that
factor has little to do with Strategy 2, just assign a rating of 1 to
Strategy 2. (Note QSPM's will have 0's across about one half of
the rows). Across each row in performing QSPM analysis, use
the rating scale below for AS scores.0 = Not applicableStrategy
OneStrategy Two1 = Not attractive2 = Somewhat attractive3 =
Reasonably attractive4 = Highly attractiveAS RatingsAS
RatingsStrengths1Direct owner ship of 51% of stores2Q2 2018
Same store sales increase 2% globally/4% in China, record
profit 6B3Pay employees well, above average pay, Stock
options, Parental leave options4Supply Chain Management
(consistent quality in raw materials, and flow)5Product Quality
and consistency6Ethical Business Values7Brand Equity - Well
known brand8Operational efficiency, and solid Financial
Performance - increasing profits (operating margin 6.5% vs
industry avg of 5%)9Customer loyalty programs, and chase visa
rewards program (53% of us corp store sales)10Reinvestment
Strategy, long term strategic planning - Multi-faceted strategic
plan per regionAS RatingsAS RatingsWeaknesses1EMEA
Market, 11% decline in operating profits 20182SBUX is highly
dependent on the financial performance on North America (77%
of profit)3Higher prices than competition(38% higher)4Products
are not very distinct, other franchises have nearly identical
products - McDonalds McCafé, Dunkin Donuts and a greater
variety to draw in customers5Product Recalls have had
detrimental impact on the brand6Issues with European taxes not
being paid ( UK no taxes on 1.2B pounds in 2011-
2012)7Product Standards - unhealthy products, Starbucks built
brand on flavored and sweetened items, does not meet some
cultural norms and are high calories, overdependence on coffee
products8Starbucks rely' s on foot traffic, not pandemic
friendly9volatile supply costs10Customer base is mid to upper
calls wage earnersAS RatingsAS
RatingsOpportunities1Premium Experience at Reserve stores
with Princi, expand bar service, premium food options2Coffee
subscription (Circle K- 200% increase in foot traffic, 70%
increase if food sales, 90-95%RenewAL RATE)3Diversification
into more products beyond Coffee and Tea into more food
products4Emerging markets - enter markets with limited
competition, adapt to local markets - ex McDonalds in India
does not sell beef, but has ventured into the vegetarian food
market.5competitive pricing6Follow latest drink trends7steady
forecast for revenue growth/consumption growth8Business
partnerships and alliances (potentially responsible for sales by
1/3)9Faster Service - Corrective measures to fix long lines -
more advanced Machines?10Self-service MachinesAS
RatingsAS RatingsThreats1Dunkin Donuts 2nd in market shares
in USA, and growing with coffee adjacent products2McDonalds
2nd in market share globally3Sales decline due to decline in
customer traffic4Brand Relevance - Business incidents
(Unionization)5evolving consumer preferences and tastes6Cyber
Security and Data Privacy7Pandemic/Global Recession -
temporary closed 2K stores in China, 50% of corp stores and
43% of licensed stores-lost 915M+ so far (June
2021)8Increased costs to maintain supply chains, and raw
material costs, and high 9Competition from local favorite
brands(incumbents) , EMEA has a different coffee
culture10Executive Changeover - Chief Executive (Howard
Shultz) retiring for the 3rd timeYou have completed Part 1.
Click The Blue Buttons Below to Navigate Part 1 More
Efficiently
Strengths
/xl/drawings/drawing1.xml#'PART%20I'!B13
Perceptual Maps
/xl/drawings/drawing1.xml#'PART%20I'!B255
Weaknesses
/xl/drawings/drawing1.xml#'PART%20I'!B39
Opportunities
/xl/drawings/drawing1.xml#'PART%20I'!B55
Threats
/xl/drawings/drawing1.xml#'PART%20I'!B81
SWOT
/xl/drawings/drawing1.xml#'PART%20I'!B311
CPM
/xl/drawings/drawing1.xml#'PART%20I'!B99
IE Matrix
/xl/drawings/drawing1.xml#'PART%20I'!B155
BCG Matrix
/xl/drawings/drawing1.xml#'PART%20I'!B131
SPACE Matrix
/xl/drawings/drawing1.xml#'PART%20I'!B181
GRAND
/xl/drawings/drawing1.xml#'PART%20I'!B294
QSPM
/xl/drawings/drawing1.xml#'PART%20I'!B317
View IFE Matrix/xl/drawings/drawing1.xml#'IFE%20'!A1
HOME/xl/drawings/drawing1.xml#'PART%20I'!A2
View EFE Matrix/xl/drawings/drawing1.xml#'EFE%20'!A1
View CPM Matrix/xl/drawings/drawing1.xml#CPM!C2
BCG/xl/drawings/drawing1.xml#BCG!B5
IE
/xl/drawings/drawing1.xml#IE!B2
IE
/xl/drawings/drawing1.xml#IE!B2
SPACE
/xl/drawings/drawing1.xml#SPACE!B2
SPACE
/xl/drawings/drawing1.xml#SPACE!B2
Perceptual Map
/xl/drawings/drawing1.xml#'Perceptual%20Map'!B2
Perceptual Map
/xl/drawings/drawing1.xml#'Perceptual%20Map'!B2
SWOT
/xl/drawings/drawing1.xml#SWOT!A2
QSPM
/xl/drawings/drawing1.xml#QSPM!B2
GRAND
/xl/drawings/drawing1.xml#GRAND!B2
GRAND
/xl/drawings/drawing1.xml#GRAND!B2
QSPM
/xl/drawings/drawing1.xml#QSPM!B2
PART IIPreliminary Financial Data1Enter in your preliminary
financial data below for your company. This data is used to
construct financial statements, financial ratios, and much more.
Income Statement InformationEnter all as Dollar Amounts.
Make sure the oldest year is entered into Column 1 throughout
this Template. You may NOT Change this sequence as the
preset equations will not adjust.Read the Note to the left
CAREFULLY Reporting DateRevenueCost of Goods
SoldOperating expensesInterest ExpenseNote: If receiving
interest credit, enter as NEGATIVE numberNon-recurring
EventsNote: If NEGATIVE enter as negative number. Generally
this line is for "discontinued operations" and 90% of the time
you will enter 0TaxNote: If receiving a tax credit, enter as
NEGATIVE numberBalance Sheet InformationCurrent
Assets12/31/9912/31/99Cash and equivalents and Short Term
InvestmentsAccounts ReceivableInventoryOther Current
AssetsLong Term AssetsProperty, plant &
equipmentGoodwillIntangiblesOther Long-term AssetsCurrent
LiabilitiesAccounts PayableOther Current LiabilitiesLong Term
LiabilitiesLong-term DebtOther Long-term LiabilitiesEquity
Common StockRetained EarningsTreasury StockNote: Enter as
negative numberPaid in Capital & OtherCompany
Valuation1Enter in the corresponding data below for your firm,
and for a rival firm if you desire. The rival can be a firm you
wish to acquire or simply just to compare to your case
company.Stockholders' Equity0Note: Determined after you
complete the preliminary section.Net Income0Note: Determined
after you complete the preliminary
section.EPSERROR:#DIV/0!Note: Determined after you
complete the preliminary section and enter in # shares
outstanding below.# Shares OutstandingNote: Using Current #
shares outstanding is okay or # of shares outstanding (issued)
on the last day of the fiscal year.Stock PriceNote: Current Stock
price is fine, or the closing price on the last day of the fiscal
year.Goodwill & Intangibles0Note: Determined after you
complete the preliminary section.Rival Firm's
NameStockholders' EquityNet IncomeEPS# Shares
OutstandingStock PriceGoodwill & IntangiblesEPS/EBIT
Analysis1Enter in the corresponding data below for your
firm.2If you notice little to no change in EPS with stock vs debt
financing, the total amount of your recommendations is likely
too low. Unless of course, you are recommending defensive
strategies where you are not acquiring substantial new
capital.PessimisticRealisticOptimisticEBITEPS/EBIT
DataAmounted NeededNote: This number is the total cost of
your recommendations.Interest RateNote: Enter as a
decimal.Tax RateNote: Enter as a decimal.Shares
Outstanding0Note: Enter in under Company Valuation on this
page.# New Shares OutstandingERROR:#DIV/0!Note:
Calculated automaticallyStock Price$0.00Note: Enter in under
Company Valuation on this page.Combination Financing
DataPercent Equity Used to FinanceNote: Enter as a
decimal.Percent Debt Used to Finance Note: Enter as a
decimal.Total Equity and Debt0.00Note: Must equal 1.0. Check
the two line items above.Projected Financial Statements1Start
with the income statement and work your way from top to
bottom. Take extreme care to read and understand all notes
provided by each line item. See Chapter 8 in the David & David
textbook for examples and guidelines in developing projected
financial statements.2After completing the income statement,
begin the balance sheet starting with the "dividends to pay"
line near the bottom; finish the equity section of the balance
sheet first, then work your way up the statement to the
liabilities section, then onto the assets, using the top row (Cash)
as the plug figure. A detailed note beside the cash line item
explains further.3Take care to read all notes to the right of the
line items. Consult Chapter 8 of the David & David textbook for
excellent explanations and tips for constructing projected
statements.Percentages in the Projected Income Statement will
be multiplied by the most recent year. For example, if you
enter in 10% for projected revenues in projected year 2, the
Template will use the equation (1.10 x projected year 1
revenues) = projected year 2 revenues. For line items in the
projected income statement requesting dollar amounts, please
read the note below for the balance sheet. The calculations work
the same way as described there.Projected Years (earliest to
latest)Income StatementHistorical Numbers (see notes)
Projected Reporting DateHistorical Percent Notes Below. Enter
your data in the EXACT same format as the Notes
describe.RevenuesERROR:#DIV/0!Historical Note: Difference
the two most recent years of data. Enter percent increases you
expect based on your recommendations. Do not blindly use the
historical number provided. Enter as percent.Cost of Goods
SoldERROR:#DIV/0!Historical Note: Percent of Sales in the
most recent year. Use a similar percent across all three
projected years unless you believe COGS to sales percent will
change drastically. Enter as percent.Operating
ExpensesERROR:#DIV/0!Historical Note: Percent of Sales in
the most recent year. Use a similar percent across all three
projected years unless you believe Operating Expenses to sales
percent will change drastically. Enter as percent.Interest
Expense$0Historical Note: Dollar amount of interest paid in the
most recent year. Enter in the NEW NET dollar amounts of
interest you will forecasted for each year. If your most recent
interest payment was $500 and you plan on a $20 net increase in
interest for projected year 1, simply enter in $20 for year one. If
financing through debt, the number is more likely to increase
more than if financing through equity. Enter as dollar amount.
If you anticipate less interest expense than the year before,
enter as a negative number.TaxERROR:#DIV/0!Historical Note:
Tax Rate in most recent year. You can likely use the same tax
rate throughout unless you expect a large increase/decrease in
revenues and subsequently EBT. Enter as percent.Non-
Recurring Events0Historical Note: Dollar amount of Non-
Recurring Events for each year, this number is not cumulative.
Safe to forecast this number as $0 in ever year. Enter as dollar
amount.Scroll Down for Balance SheetWork from the bottom of
the Projected Balance Sheet to the top Projected Years (earliest
to latest)Balance Sheet (Start at the bottom)Historical
Dollar Amount PaidThe projected Balance Sheet is designed for
you to enter in the NET ADDITIONAL DOLLAR VALUES (for
PPE, Goodwill, and Intangibles). The Template will add these
values to the existing numbers. For Example, if you are adding
$1,000 in inventory in projected year 1, (but you estimate your
firm used $800 of its existing inventory from the prior year)
just enter in $200 ($1,000-$800) in the corresponding box and
the Template will use the equation ($200 + most recent
historical year Inventory number) = projected year 1
inventory.Read the message to the right, then start at the bottom
with dividends.Assets12/31/9912/31/9912/31/99Cash and
Equivalents$0$0$0$0Historical Note: If your cash number
appears too high or low, consult Chapter 8 of the textbook for
more information. Also, compare your projected ratios to
historical ratios. You may need to make adjustments to your
recommendations and/or your projected statements. It is rare
for any firm to have acceptal projected statements after the first
attempt. Accounts ReceivableERROR:#DIV/0! Historical Note:
Percent of revenues in the most recent year. Use a similar
percent across all three projected years unless you believe the
current assets to revenues percent will change drastically. Enter
as percentInventoryERROR:#DIV/0!Other Current
AssetsERROR:#DIV/0!Property Plant & Equipment$0
Historical Note: The values are for the most recent year
reported. Enter in the net new (not cumulative) dollar amounts
for each item for each forecasted year (Except for the Cash and
Equivalents line). If you are purchasing $200 of Property, Plant
& Equipment in Projected Year 1, simply enter $200 into the
first projected year. If you plan to also reduce existing PP&E by
$300, then you would enter in a negative $100 into Projected
Year 1 (assuming you still plan to purchase the other $200).
Take care with each line time, it is not how fast you get the
numbers entered. Reread the hints in red writing a few lines
above.Goodwill$0Intangibles$0Other Long-Term
AssetsERROR:#DIV/0!Historical Note: Percent of revenues in
the most recent year. Use a similar percent across all three
projected years unless you believe the other long-term asets to
revenues percent will change drastically. Enter as
percentLiabilities12/31/9912/31/9912/31/99Accounts
PayableERROR:#DIV/0!Historical Note: Percent of revenues in
the most recent year. Use a similar percent across all three
projected years unless you believe the current liabilities to
revenues percent will change drastically. Enter as percent.Other
Current LiabilitiesERROR:#DIV/0!Long-Term Debt$0Historical
Note: The values are for the most recent year reported. Enter in
the net new (not cumulative) dollar amounts for each item for
each forecasted year. For example, if you do not plan to take on
any additional long term debt in Projected Year 1, but do plan
to pay off $1,000 in debt in Projected Year 1, enter in ($1,000)
in Projected Year 1 long term debt column. Other Long-Term
LiabilitiesERROR:#DIV/0!Historical Note: Percent of revenues
in the most recent year. Use a similar percent across all three
projected years unless you believe the other long-term liabilities
to revenues percent will change drastically. Enter as
percent.Equity12/31/9912/31/9912/31/99Common
Stock0Historical Note: The values are for the most recent year
reported. Enter in the new (additional, not cumulative) Dollar
amounts for each Item for each forecasted year. If you change
Treasury Stock, you may need to make an adjustment to Paid in
Capital. Enter Treasury Stock as a negative number. Read over
Chapter 8 of the David, David and David textbook.Treasury
Stock0Paid in Capital & Other0Retained
Earnings0000Historical Note: The Retained Earnings value is
for the most recent year reported. The new additional (not
cumulative) Retained Earnings are calculated
automatically.Total Dividends to PaySTART HEREStart HERE.
Enter the total dollar amount you wish to pay in dividends each
forecasted year. If none, enter 0. This line is not cumulative, it
does not add the value to any existing value for dividends. For
example, if the firm paid $1,000 in dividends and you wish to
stop dividend payments, enter $0 in projected year 1 box. If you
wish to increase dividends by 10% enter $1,100 into projected
year 1 box. Check on your own to see historically what the firm
was paying.
Preliminary Financial Data
/xl/drawings/drawing2.xml#'PART%20II'!B2
Income Statement
/xl/drawings/drawing2.xml#'Financial%20Statements'!B5
Balance Sheet
/xl/drawings/drawing2.xml#'Financial%20Statements'!B18
Company Valuation
/xl/drawings/drawing2.xml#'Company%20Valuation'!B3
Rival Firm Valuation
/xl/drawings/drawing2.xml#'Company%20Valuation'!B14
Company Valuation
/xl/drawings/drawing2.xml#'PART%20II'!B71
EPS/EBIT Analysis
/xl/drawings/drawing2.xml#'PART%20II'!B107
Projected Financial Statements
/xl/drawings/drawing2.xml#'PART%20II'!B139
HOME
/xl/drawings/drawing2.xml#'PART%20II'!A2
Balance Sheet
/xl/drawings/drawing2.xml#'Financial%20Statements'!B18
EPS/EBIT Analysis
/xl/drawings/drawing2.xml#EPS_EBIT!C4
IFE IFE Matrix1 If data is missing here, recheck "Part I"
2Check to make sure your text is not cut off in the matrix.
Double click (or drag) between the Cell Numbers.3To transfer
into Word or Power Point, highlight the matrix, then paste
special as "picture"StrengthsWeightRatingWeighted
Score1Direct owner ship of 51% of stores0.0010.002Q2 2018
Same store sales increase 2% globally/4% in China, record
profit 6B0.0020.003Pay employees well, above average pay,
Stock options, Parental leave options0.0020.004Supply Chain
Management (consistent quality in raw materials, and
flow)0.0020.005Product Quality and
consistency0.0020.006Ethical Business Values0.0020.007Brand
Equity - Well known brand0.0010.008Operational efficiency,
and solid Financial Performance - increasing profits (operating
margin 6.5% vs industry avg of 5%)0.0010.009Customer loyalty
programs, and chase visa rewards program (53% of us corp
store sales)0.0030.0010Reinvestment Strategy, long term
strategic planning - Multi-faceted strategic plan per
region0.0010.00WeaknessesWeightRatingWeighted
Score1EMEA Market, 11% decline in operating profits
20180.0010.002SBUX is highly dependent on the financial
performance on North America (77% of
profit)0.0000.003Higher prices than competition(38%
higher)0.0000.004Products are not very distinct, other
franchises have nearly identical products - McDonalds McCafé,
Dunkin Donuts and a greater variety to draw in
customers0.0000.005Product Recalls have had detrimental
impact on the brand0.0000.006Issues with European taxes not
being paid ( UK no taxes on 1.2B pounds in 2011-
2012)0.0000.007Product Standards - unhealthy products,
Starbucks built brand on flavored and sweetened items, does not
meet some cultural norms and are high calories, overdependence
on coffee products0.0010.008Starbucks rely' s on foot traffic,
not pandemic friendly0.0000.009volatile supply
costs0.0000.0010Customer base is mid to upper calls wage
earners0.0000.00Total IFE Score0.000.00
Return to Part I/xl/drawings/drawing3.xml#'PART%20I'!B26
EFE EFE Matrix1 If data is missing here, recheck "Part I"
2Check to make sure your text is not cut off in the matrix.
Double click (or drag) between the Cell Numbers.3To transfer
into Word or Power Point, highlight the matrix, then paste
special as "picture"OpportunitiesWeightRatingWeighted
Score1Premium Experience at Reserve stores with Princi,
expand bar service, premium food
options0.0430.10638297872Coffee subscription (Circle K-
200% increase in foot traffic, 70% increase if food sales, 90-
95%RenewAL RATE)0.0640.22695035463Diversification into
more products beyond Coffee and Tea into more food
products0.0620.11347517734Emerging markets - enter markets
with limited competition, adapt to local markets - ex McDonalds
in India does not sell beef, but has ventured into the vegetarian
food market.0.0530.14893617025competitive
pricing0.0430.10638297876Follow latest drink
trends0.0630.19148936177steady forecast for revenue
growth/consumption growth0.0610.05673758878Business
partnerships and alliances (potentially responsible for sales by
1/3)0.0330.0851063839Faster Service - Corrective measures to
fix long lines - more advanced
Machines?0.0640.255319148910Self-service
Machines0.0540.1985815603ThreatsWeightRatingWeighted
Score1Dunkin Donuts 2nd in market shares in USA, and
growing with coffee adjacent products0.0540.202McDonalds
2nd in market share globally0.0540.203Sales decline due to
decline in customer traffic0.0630.194Brand Relevance -
Business incidents (Unionization)0.0430.135evolving consumer
preferences and tastes0.0630.176Cyber Security and Data
Privacy0.0330.097Pandemic/Global Recession - temporary
closed 2K stores in China, 50% of corp stores and 43% of
licensed stores-lost 915M+ so far (June
2021)0.0630.178Increased costs to maintain supply chains, and
raw material costs, and high 0.0440.149Competition from local
favorite brands(incumbents) , EMEA has a different coffee
culture0.0630.1910Executive Changeover - Chief Executive
(Howard Shultz) retiring for the 3rd time0.0610.06Total EFE
Score1.003.02
Return to Part I/xl/drawings/drawing4.xml#'PART%20I'!B68
Return to Part I/xl/drawings/drawing4.xml#'PART%20I'!B66
CPMCPM Matrix1If data is missing here, recheck the "Part I"
page.2Check to make sure your text is not cut off in the matrix.
Double click (or drag) between the Cell Numbers.3To transfer
into Word or Power Point, highlight the matrix, then paste
special as "picture"Your FirmRivalRivalCritical Success
Factors WeightRating ScoreRating Score Rating Score
Advertising0.0000.0000.0000.00Domestic Market
Penetration0.0000.0000.0000.00Customer
Service0.0000.0000.0000.00Product
Variety0.0000.0000.0000.00International Market Penetration
0.0000.0000.0000.00Employee
Dedication0.0000.0000.0000.00Financial
Profit0.0000.0000.0000.00Customer
Loyalty0.0000.0000.0000.00Market
Share0.0000.0000.0000.00Product
Quality0.0000.0000.0000.00Top
Management0.0000.0000.0000.00Price
Competitiveness0.0000.0000.0000.00Totals0.000.000.000.00
Return to Part I/xl/drawings/drawing5.xml#'PART%20I'!D99
BCGBCG1If data is missing here, recheck the "Part I" page and
read step 3.2Highlight the entire matrix (not just the inside
box), and then paste as paste special picture.3If you do not see
your circle, either you did not enter in the information or you
entered a number for the "Top Firm in the Industry Revenues"
smaller than your firm. This number can only be larger or the
same (if your firm's division is the largest revenue generator in
the industry). It is also possible your bubble is behind another
bubble if the information was close to the same, this is unlikely
however.Please Scroll down for the BCG Matrix and Table
Relative Market Share PositionHigh 1.0Low 0.0Industry Sales
Growth RateHigh 0.20Low -0.20DivisionYour Firm's Division
RevenuesTop Firm in Industry Division RevenuesIndustry Sales
Growth Rate Relative Market Share PositionHandcrafted
beverages $18$180.201.00Food$5$230.200.22Other
(merchandise, grab-and-
go)$1$10.051.000$0$00.00NA0$0$00.00NA
Handcrafted beverages 1 0.2 18.2 Food
0.22241379310344828 0.2 5.16 Other (merchandise, grab-
and-go)
1 0.05 1.24
NA
NA Handcrafted beverages
1 0.2 18.2
Question Marks
Stars
Cash Cows
Dogs
s
Return to Part I/xl/drawings/drawing6.xml#'PART%20I'!D132
Return to Part I/xl/drawings/drawing6.xml#'PART%20I'!B144
IEIE1If data is missing here, recheck the "Part I" page and read
step 3.2Highlight the entire matrix (not just the inside box), and
then paste as paste special picture.3If you do not see your
circle, either you did not enter in the corresponding EFE or IFE
information. It is also possible your bubble is behind another
bubble if the EFE and IFE information was close to the
same.Scroll down for IE Matrix and Table THE IFE TOTAL
WEIGHTED SCORESStrongWeak 4.01.0High4.0THE EFE
WEIGHTED SCORESLow1.0Division Firm's Division
RevenuesEstimated IFE ScoreEstimated EFE
ScoreAmerica$15,6523.23.5CAP$3,2403.03.0EMEA$1,0142.01.
2Channel Development$2,0092.52.8All other
segments$4721.82.0
0 3.0212765957446805 1 America
3.2 3.5 15652 CAP
3 3 3240 EMEA
2 1.2 1014 Channel Development
2.5 2.8 2009 All other segments
1.8 2 472
Return to Part I/xl/drawings/drawing8.xml#'PART%20I'!B171
SPACESPACE1If data is missing here, recheck the "Part I"
page and read step 3.2Highlight the entire matrix (not just the
inside box), and then paste as paste special picture. Be sure to
also include the table below the chart also in your
presentation.3If you do not see your bubble either you did not
enter in the information or, it is also possible your bubble is
behind another bubble if the X and Y information were close to
the same.0MCDonaldsMaxwell HouseX Axis3.25.0-2.0Y
Axis2.44.01.0Internal Analysis: External Analysis:Financial
Position (FP)Stability Position (SP)Current Ratio4Rate of
Inflation-5Debt to Equity7Technological Changes-5Net
Income6Price Elasticity of Demand-3Revenue7Competitive
Pressure-4Inventory Turnover7Barriers to Entry into Market-
2Financial Position (FP) Average 6.2Stability Position (SP)
Average-3.8Internal Analysis: External Analysis:Competitive
Position (CP)Industry Position (IP)Market Share-1Growth
Potential6Product Quality-4Financial Stability7Customer
Loyalty-2Ease of Entry into Market4Variety of Products
Offered-6Resource Utilization6Control over Suppliers and
Distributors-1Profit Potential7Competitive Position (CP)
Average-2.8Industry Position (IP) Average6.0
Return to Part
I/xl/drawings/drawing10.xml#'PART%20I'!B1823.2
2.4000000000000004 1 MCDonalds 5 4 1
Maxwell House
-2 1 1
FP
SP
CP
IP
IPIP
Defensive
Conservative
Aggressive
Competitive
GRANDGRAND1 If data is missing here, recheck the "Part I"
page and read Step 3.2Highlight the entire matrix (not just the
inside box), and then paste as paste special picture.3If you do
not see your circle, either you did not enter in the corresponding
information or it is also possible your bubble is behind another
bubble if the axis information was close to the same.
Return to Part I/xl/drawings/drawing11.xml#'PART%20I'!B2991
1 1 1 1 1
Quadrant II
Quadrant I
Quadrant III
I
Quadrant IV
Rapid Market Growth
Slow Market Growth
Strong Competitive Position
Weak Competitive Position
Perceptual MapPerceptual Maps1If data is missing here, recheck
the "Part I" page and read Step 3.2Highlight the entire matrix
(not just the inside box), and then paste as paste special
picture.3If you do not see your circle, either you did not enter
in the corresponding information or it is also possible your
bubble is behind another bubble if the axis information was
close to the same.0000
1 1 1 1 1 1 1 1 1 1
Return to Part I/xl/drawings/drawing12.xml#'PART%20I'!B256
Financial Statements1Complete Part II to Construct the
Financial Statements. Income
Statement12/31/9912/31/99Percent ChangeRevenue
(Sales)$0$0NANACost of Goods Sold00NANAGross
Profit00NANAOperating Expenses00NANAEBIT (Operating
Income)00NANAInterest
Expense00NANAEBT00NANATax00NANANon-Recurring
Events00NANANet Income00NANABalance
Sheet12/31/9912/31/99Percent ChangeAssetsCash and Short
Term Investments$0$0NANAAccounts
Receivable00NANAInventory00NANAOther Current
Assets00NANATotal Current Assets00NANAProperty Plant &
Equipment00NANAGoodwill00NANAIntangibles00NANAOther
Long-Term Assets00NANATotal
Assets00NANALiabilitiesAccounts Payable00NANAOther
Current Liabilities00NANATotal Current
Liabilities00NANALong-Term Debt00NANAOther Long-Term
Liabilities00NANATotal Liabilities00NANAEquityCommon
Stock00NANARetained Earnings00NANATreasury
Stock00NANAPaid in Capital & Other00NANATotal
Equity00NANATotal Liabilities and Equity00NANA
Return to Part II/xl/drawings/drawing14.xml#'PART%20II'!B2
SWOTSWOTSO Strategies1Supply Chain Management -
Starbucks has a great SCM Story, they can us this to take
advantage of shortfall in the shipping logistics arena
(S4)2Starbucks Equity/Loyalty Programs - Starbucks can use
their brand value/loyalty programs to enter into partnerships
with other companies (S9,O1)3Starbucks solid financials - This
offers Starbucks the opportunity and flexibility to take risks in
some product introductions and markets (S1,S2,03,04)4Solid
Reinvestment strategy - This allows Starbucks to plan expansion
over a multi-year time period without major concerns about
short revenue(S8,O7)ST Strategies1Product Quality and
Consistency - Maintaining a standard of quality helps Starbucks
as customers come to expect and receive the same quality
consistently. When going to local shops or smaller coffee chains
this is not the case as they have a harder time controlling
quality because they cannot manage the supply chain as well.
(S5,T1,T2,T9)2Employee compensation - Maintaining better
than average pay and benefits allows Starbucks to retain quality
employees ( S6,S3,T3)3Direct Ownership on 51% if stores -
Allows Starbucks company stores to set high standard that
franchisees need to follow. (S1,T1,T2,T7)4Ethical Business
Practices - Makes customers secure that the are not being
mislead, and that they are doing better for others and this
attracts customers. (S6,T9)WO Strategies1Weak overseas
markets - Starbucks needs t o access what those local markets
require terms of coffee/teas and other drinks to integrate better
to those markets. European coffee shops are about atmosphere
and not the factory approach taken in North America.
(W1,W2,O4)2Health Standard - Starbucks needs to introduce
healthier product offerings to compete in other markets.
(W7,O6)3Product variety - Starbucks can expand more into
breakfast and lunch food market (W4,O3,O4)4Starbucks Time
of day offerings - Starbucks has peak business hours at the
beginning of the work day, and around break times. They need
to offer products that can draw customers at other times of the
day. (W8,O9,O10)WT Strategies1Expensive products - expand
customer base by adding some cheaper product offerings (W3,
T5,T8)2Relys on foot traffic - Partner with catering companies
and deilvery services to offer offiste starbucks offering. Offer a
catered starbucks barista station for events (W8,T3,T5)3Supply
Chain Management - better control the SCM and logistics
aspects to control direct costs and well as direct costs.
(W9,T8)4Product offerings - Include more seasonal offerings to
attract a different set of customers, with foods and coffee's
(W4,T1)
Return to Part I/xl/drawings/drawing15.xml#'PART%20I'!B296
QSPMQSPM1If data is missing here, recheck the "Part I" page.
3Check to make sure your text is not cut off in the matrix.
Double click (or drag) between the Cell
Numbers.00StrengthsWeightASTASAS TAS 1Direct owner
ship of 51% of stores0.0000.0000.002Q2 2018 Same store sales
increase 2% globally/4% in China, record profit
6B0.0000.0000.003Pay employees well, above average pay,
Stock options, Parental leave options0.0000.0000.004Supply
Chain Management (consistent quality in raw materials, and
flow)0.0000.0000.005Product Quality and
consistency0.0000.0000.006Ethical Business
Values0.0000.0000.007Brand Equity - Well known
brand0.0000.0000.008Operational efficiency, and solid
Financial Performance - increasing profits (operating margin
6.5% vs industry avg of 5%)0.0000.0000.009Customer loyalty
programs, and chase visa rewards program (53% of us corp
store sales)0.0000.0000.0010Reinvestment Strategy, long term
strategic planning - Multi-faceted strategic plan per
region0.0000.0000.0000WeaknessesWeightASTASAS TAS
1EMEA Market, 11% decline in operating profits
20180.0000.0000.002SBUX is highly dependent on the financial
performance on North America (77% of
profit)0.0000.0000.003Higher prices than competition(38%
higher)0.0000.0000.004Products are not very distinct, other
franchises have nearly identical products - McDonalds McCafé,
Dunkin Donuts and a greater variety to draw in
customers0.0000.0000.005Product Recalls have had detrimental
impact on the brand0.0000.0000.006Issues with European taxes
not being paid ( UK no taxes on 1.2B pounds in 2011-
2012)0.0000.0000.007Product Standards - unhealthy products,
Starbucks built brand on flavored and sweetened items, does not
meet some cultural norms and are high calories, overdependence
on coffee products0.0000.0000.008Starbucks rely' s on foot
traffic, not pandemic friendly0.0000.0000.009volatile supply
costs0.0000.0000.0010Customer base is mid to upper calls wage
earners0.0000.0000.0000OpportunitiesWeightASTASAS TAS
1Premium Experience at Reserve stores with Princi, expand bar
service, premium food options0.0400.0000.002Coffee
subscription (Circle K- 200% increase in foot traffic, 70%
increase if food sales, 90-95%RenewAL
RATE)0.0600.0000.003Diversification into more products
beyond Coffee and Tea into more food
products0.0600.0000.004Emerging markets - enter markets with
limited competition, adapt to local markets - ex McDonalds in
India does not sell beef, but has ventured into the vegetarian
food market.0.0500.0000.005competitive
pricing0.0400.0000.006Follow latest drink
trends0.0600.0000.007steady forecast for revenue
growth/consumption growth0.0600.0000.008Business
partnerships and alliances (potentially responsible for sales by
1/3)0.0300.0000.009Faster Service - Corrective measures to fix
long lines - more advanced Machines?0.0600.0000.0010Self-
service Machines0.0500.0000.0000ThreatsWeightASTASAS
TAS 1Dunkin Donuts 2nd in market shares in USA, and
growing with coffee adjacent
products0.0500.0000.002McDonalds 2nd in market share
globally0.0500.0000.003Sales decline due to decline in
customer traffic0.0600.0000.004Brand Relevance - Business
incidents (Unionization)0.0400.0000.005evolving consumer
preferences and tastes0.0600.0000.006Cyber Security and Data
Privacy0.0300.0000.007Pandemic/Global Recession - temporary
closed 2K stores in China, 50% of corp stores and 43% of
licensed stores-lost 915M+ so far (June
2021)0.0600.0000.008Increased costs to maintain supply chains,
and raw material costs, and high 0.0400.0000.009Competition
from local favorite brands(incumbents) , EMEA has a different
coffee culture0.0600.0000.0010Executive Changeover - Chief
Executive (Howard Shultz) retiring for the 3rd
time0.0600.0000.00TOTALS0.000.00
Return to Part I/xl/drawings/drawing16.xml#'PART%20I'!B317
Company Valuation1Complete Part II to Construct the Company
Valuation 0Stockholders' Equity - (Goodwill +
Intangibles)$0Net Income x 5$0(Share Price/EPS) x Net
IncomeERROR:#DIV/0!Number of Shares Outstanding x Share
Price$0Method AverageERROR:#DIV/0!Rival Firm's
NameStockholders' Equity - (Goodwill + Intangibles)$0Net
Income x 5$0(Share Price/EPS) x Net
IncomeERROR:#DIV/0!Number of Shares Outstanding x Share
Price$0Method AverageERROR:#DIV/0!
Return to Part II
/xl/drawings/drawing17.xml#'PART%20II'!B71
EPS_EBIT1Complete Part II to Construct the EPS/EBIT Charts
Common Stock FinancingDebt
FinancingPessimisticRealisticOptimisticPessimisticRealisticOpt
imisticEBIT$0$0$0$0$0$0Interest
000000EBT000000Taxes000000EAT000000#
SharesERROR:#DIV/0!ERROR:#DIV/0!ERROR:#DIV/0!000EP
SERROR:#DIV/0!ERROR:#DIV/0!ERROR:#DIV/0!ERROR:#DI
V/0!ERROR:#DIV/0!ERROR:#DIV/0!Amount Needed$0Interest
Rate0% Stock0%Debt0%Tax
Rate0%PessimisticRealisticOptimistic# Shares
Outstanding0.0EBIT$0$0$0Additional Shares Outstanding
NeededNAInterest 000Stock
Price$0.00EBT000Taxes000EAT000#
SharesERROR:#DIV/0!ERROR:#DIV/0!ERROR:#DIV/0!EPSER
ROR:#DIV/0!ERROR:#DIV/0!ERROR:#DIV/0!
Common Stock Financing0 0 0 0 0 0 Debt
Financing 0 0 0 0 0 0
Return to Part
II/xl/drawings/drawing18.xml#'PART%20II'!B107
Retained Earnings TableComplete Part II to Construct the RE
TableDividend InformationBalance Sheet
InformationSteps12345YearCurrent Year's Net IncomeLess
Current Year's Dividends PaidNew REPlus Prior Year's
RECurrent Year's Balance Sheet
RE12/31/99$0$0$0$0$012/31/99$0$0$0$0$012/31/99$0$0$0$0
$0
Projected Statements1Complete Part II to Construct the
Projected Financial Statements.Projected Income
Statement12/31/9912/31/9912/31/99Revenues
(Sales)$0$0$0Cost of Goods Sold000Gross Profit000Operating
Expenses (Operating Income)000EBIT000Interest
Expense000EBT000Tax000Non-Recurring Events000Net
Income000Projected Balance
Sheet12/31/9912/31/9912/31/99AssetsCash and
Equivalents$0$0$0Accounts Receivable000Inventory000Other
Current Assets000Total Current Assets000Property Plant &
Equipment000Goodwill000Intangibles000Other Long-Term
Assets000Total Assets000LiabilitiesAccounts Payable000Other
Current Liabilities000Total Current Liabilities000Long-Term
Debt000Other Long-Term Liabilities000Total
Liabilities000EquityCommon Stock000Retained
Earnings000Treasury Stock000Paid in Capital & Other000Total
Equity000Total Liabilities and Equity000
Return to Part II
/xl/drawings/drawing19.xml#'PART%20II'!B139
Ratios1Complete Part II to Construct the Ratios Historical
RatiosProjected
Ratios12/31/9912/31/9912/31/9912/31/9912/31/99Current
RatioERROR:#DIV/0!ERROR:#DIV/0!Current
RatioERROR:#DIV/0!ERROR:#DIV/0!ERROR:#DIV/0!Quick
RatioERROR:#DIV/0!ERROR:#DIV/0!Quick
RatioERROR:#DIV/0!ERROR:#DIV/0!ERROR:#DIV/0!Total
Debt-to-Total-Assets
RatioERROR:#DIV/0!ERROR:#DIV/0!Debt-to-Total-Assets
RatioERROR:#DIV/0!ERROR:#DIV/0!ERROR:#DIV/0!Total
Debt-to-Equity RatioERROR:#DIV/0!ERROR:#DIV/0!Debt-to-
Equity
RatioERROR:#DIV/0!ERROR:#DIV/0!ERROR:#DIV/0!Times-
Interest-Earned RatioNANATimes-Interest-Earned
RatioNANANAInventory
TurnoverERROR:#DIV/0!ERROR:#DIV/0!Inventory
TurnoverERROR:#DIV/0!ERROR:#DIV/0!ERROR:#DIV/0!Fixe
d Assets TurnoverERROR:#DIV/0!ERROR:#DIV/0!Fixed
Assets
TurnoverERROR:#DIV/0!ERROR:#DIV/0!ERROR:#DIV/0!Tota
l Assets TurnoverNANATotal Assets
TurnoverERROR:#DIV/0!ERROR:#DIV/0!ERROR:#DIV/0!Acc
ounts Receivable TurnoverNANAAccounts Receivable
TurnoverNANANAAverage Collection
PeriodERROR:#DIV/0!ERROR:#DIV/0!Average Collection
PeriodERROR:#DIV/0!ERROR:#DIV/0!ERROR:#DIV/0!Gross
Profit Margin %ERROR:#DIV/0!ERROR:#DIV/0!Gross Profit
Margin
%ERROR:#DIV/0!ERROR:#DIV/0!ERROR:#DIV/0!Operating
Profit Margin %ERROR:#DIV/0!ERROR:#DIV/0!Operating
Profit Margin
%ERROR:#DIV/0!ERROR:#DIV/0!ERROR:#DIV/0!ROA
%ERROR:#DIV/0!ERROR:#DIV/0!ROA
%ERROR:#DIV/0!ERROR:#DIV/0!ERROR:#DIV/0!ROE
%ERROR:#DIV/0!ERROR:#DIV/0!ROE
%ERROR:#DIV/0!ERROR:#DIV/0!ERROR:#DIV/0!
Return to Part II
/xl/drawings/drawing20.xml#'PART%20II'!A1
Johns Hopkins Nursing Evidence-Based Practice
Appendix D
Evidence Level and Quality Guide
© 2017 The Johns Hopkins Hospital/ Johns Hopkins University
School of Nursing
Evidence Levels Quality Ratings
Level I
Experimental study, randomized controlled trial
(RCT)
Explanatory mixed method design that includes
only a level I quaNtitative study
Systematic review of RCTs, with or without meta-
analysis
QuaNtitative Studies
A High quality: Consistent, generalizable results; sufficient
sample size for the study design; adequate
control; definitive conclusions; consistent recommendations
based on comprehensive literature review that
includes thorough reference to scientific evidence.
B Good quality: Reasonably consistent results; sufficient
sample size for the study design; some control,
fairly definitive conclusions; reasonably consistent
recommendations based on fairly comprehensive
literature review that includes some reference to scientific
evidence.
C Low quality or major flaws: Little evidence with inconsistent
results; insufficient sample size for the
study design; conclusions cannot be drawn.
QuaLitative Studies
No commonly agreed-on principles exist for judging the quality
of quaLitative studies. It is a subjective
process based on the extent to which study data contributes to
synthesis and how much information is known
about the researchers’ efforts to meet the appraisal criteria.
For meta-synthesis, there is preliminary agreement that quality
assessments of individual studies should be
made before synthesis to screen out poor-quality studies1.
A/B High/Good quality is used for single studies and meta-
syntheses2.
The report discusses efforts to enhance or evaluate the quality
of the data and the overall inquiry in
sufficient detail; and it describes the specific techniques used to
enhance the quality of the inquiry.
Evidence of some or all of the following is found in the report:
• Transparency: Describes how information was documented to
justify decisions, how data were
reviewed by others, and how themes and categories were
formulated.
• Diligence: Reads and rereads data to check interpretations;
seeks opportunity to find multiple
sources to corroborate evidence.
• Verification: The process of checking, confirming, and
ensuring methodologic coherence.
• Self-reflection and scrutiny: Being continuously aware of how
a researcher’s experiences,
background, or prejudices might shape and bias analysis and
interpretations.
• Participant-driven inquiry: Participants shape the scope and
breadth of questions; analysis and
interpretation give voice to those who participated.
• Insightful interpretation: Data and knowledge are linked in
meaningful ways to relevant literature.
C Low quality studies contribute little to the overall review of
findings and have few, if any, of the features
listed for high/good quality.
Level II
Quasi-experimental study
Explanatory mixed method design that includes
only a level II quaNtitative study
Systematic review of a combination of RCTs and
quasi-experimental studies, or quasi-
experimental studies only, with or without meta-
analysis
Level III
Nonexperimental study
Systematic review of a combination of RCTs,
quasi-experimental and nonexperimental studies,
or nonexperimental studies only, with or without
meta-analysis
Exploratory, convergent, or multiphasic mixed
methods studies
Explanatory mixed method design that includes
only a level III quaNtitative study
QuaLitative study Meta-synthesis
Johns Hopkins Nursing Evidence-Based Practice
Appendix D
Evidence Level and Quality Guide
© 2017 The Johns Hopkins Hospital/ Johns Hopkins University
School of Nursing
1
https://www.york.ac.uk/crd/SysRev/!SSL!/WebHelp/6_4_ASSE
SSMENT_OF_QUALITATIVE_RESEARCH.htm
2 Adapted from Polit & Beck (2017).
Evidence Levels Quality Ratings
Level IV
Opinion of respected authorities and/or
nationally recognized expert committees or
consensus panels based on scientific evidence
Includes:
• Clinical practice guidelines
• Consensus panels/position statements
A High quality: Material officially sponsored by a professional,
public, or private organization or a government
agency; documentation of a systematic literature search
strategy; consistent results with sufficient numbers of
well-designed studies; criteria-based evaluation of overall
scientific strength and quality of included studies and
definitive conclusions; national expertise clearly evident;
developed or revised within the past five years
B Good quality: Material officially sponsored by a professional,
public, or private organization or a government
agency; reasonably thorough and appropriate systematic
literature search strategy; reasonably consistent
results, sufficient numbers of well-designed studies; evaluation
of strengths and limitations of included studies
with fairly definitive conclusions; national expertise clearly
evident; developed or revised within the past five
years
C Low quality or major flaws: Material not sponsored by an
official organization or agency; undefined, poorly
defined, or limited literature search strategy; no evaluation of
strengths and limitations of included studies,
insufficient evidence with inconsistent results, conclusions
cannot be drawn; not revised within the past five
years
Level V
Based on experiential and nonresearch evidence
Includes:
• Integrative reviews
• Literature reviews
• Quality improvement, program, or financial
evaluation
• Case reports
• Opinion of nationally recognized expert(s)
based on experiential evidence
Organizational Experience (quality improvement, program or
financial evaluation)
A High quality: Clear aims and objectives; consistent results
across multiple settings; formal quality
improvement, financial, or program evaluation methods used;
definitive conclusions; consistent
recommendations with thorough reference to scientific evidence
B Good quality: Clear aims and objectives; consistent results in
a single setting; formal quality improvement,
financial, or program evaluation methods used; reasonably
consistent recommendations with some reference to
scientific evidence
C Low quality or major flaws: Unclear or missing aims and
objectives; inconsistent results; poorly defined
quality improvement, financial, or program evaluation methods;
recommendations cannot be made
Integrative Review, Literature Review, Expert Opinion, Case
Report, Community Standard,
Clinician Experience, Consumer Preference
A High quality: Expertise is clearly evident; draws definitive
conclusions; provides scientific rationale; thought
leader(s) in the field
B Good quality: Expertise appears to be credible; draws fairly
definitive conclusions; provides logical argument
for opinions
C Low quality or major flaws: Expertise is not discernable or is
dubious; conclusions cannot be drawn
http://www.york.ac.uk/crd/SysRev/!SSL!/WebHelp/6_4_ASSES
SMENT_OF_QUALITATIVE_RESEARCH.htm
http://www.york.ac.uk/crd/SysRev/!SSL!/WebHelp/6_4_ASSES
SMENT_OF_QUALITATIVE_RESEARCH.htm
Johns Hopkins Nursing Evidence-Based Practice
Appendix D
Evidence Level and Quality Guide
© 2017 The Johns Hopkins Hospital/ Johns Hopkins University
School of Nursing
Evidence Levels Quality Ratings
Level I
Experimental study, randomized controlled trial
(RCT)
Explanatory mixed method design that includes
only a level I quaNtitative study
Systematic review of RCTs, with or without meta-
analysis
QuaNtitative Studies
A High quality: Consistent, generalizable results; sufficient
sample size for the study design; adequate
control; definitive conclusions; consistent recommendations
based on comprehensive literature review that
includes thorough reference to scientific evidence.
B Good quality: Reasonably consistent results; sufficient
sample size for the study design; some control,
fairly definitive conclusions; reasonably consistent
recommendations based on fairly comprehensive
literature review that includes some reference to scientific
evidence.
C Low quality or major flaws: Little evidence with inconsistent
results; insufficient sample size for the
study design; conclusions cannot be drawn.
QuaLitative Studies
No commonly agreed-on principles exist for judging the quality
of quaLitative studies. It is a subjective
process based on the extent to which study data contributes to
synthesis and how much information is known
about the researchers’ efforts to meet the appraisal criteria.
For meta-synthesis, there is preliminary agreement that quality
assessments of individual studies should be
made before synthesis to screen out poor-quality studies1.
A/B High/Good quality is used for single studies and meta-
syntheses2.
The report discusses efforts to enhance or evaluate the quality
of the data and the overall inquiry in
sufficient detail; and it describes the specific techniques used to
enhance the quality of the inquiry.
Evidence of some or all of the following is found in the report:
• Transparency: Describes how information was documented to
justify decisions, how data were
reviewed by others, and how themes and categories were
formulated.
• Diligence: Reads and rereads data to check interpretations;
seeks opportunity to find multiple
sources to corroborate evidence.
• Verification: The process of checking, confirming, and
ensuring methodologic coherence.
• Self-reflection and scrutiny: Being continuously aware of how
a researcher’s experiences,
background, or prejudices might shape and bias analysis and
interpretations.
• Participant-driven inquiry: Participants shape the scope and
breadth of questions; analysis and
interpretation give voice to those who participated.
• Insightful interpretation: Data and knowledge are linked in
meaningful ways to relevant literature.
C Low quality studies contribute little to the overall review of
findings and have few, if any, of the features
listed for high/good quality.
Level II
Quasi-experimental study
Explanatory mixed method design that includes
only a level II quaNtitative study
Systematic review of a combination of RCTs and
quasi-experimental studies, or quasi-
experimental studies only, with or without meta-
analysis
Level III
Nonexperimental study
Systematic review of a combination of RCTs,
quasi-experimental and nonexperimental studies,
or nonexperimental studies only, with or without
meta-analysis
Exploratory, convergent, or multiphasic mixed
methods studies
Explanatory mixed method design that includes
only a level III quaNtitative study
QuaLitative study Meta-synthesis
Johns Hopkins Nursing Evidence-Based Practice
Appendix D
Evidence Level and Quality Guide
© 2017 The Johns Hopkins Hospital/ Johns Hopkins University
School of Nursing
1
https://www.york.ac.uk/crd/SysRev/!SSL!/WebHelp/6_4_ASSE
SSMENT_OF_QUALITATIVE_RESEARCH.htm
2 Adapted from Polit & Beck (2017).
Evidence Levels Quality Ratings
Level IV
Opinion of respected authorities and/or
nationally recognized expert committees or
consensus panels based on scientific evidence
Includes:
• Clinical practice guidelines
• Consensus panels/position statements
A High quality: Material officially sponsored by a professional,
public, or private organization or a government
agency; documentation of a systematic literature search
strategy; consistent results with sufficient numbers of
well-designed studies; criteria-based evaluation of overall
scientific strength and quality of included studies and
definitive conclusions; national expertise clearly evident;
developed or revised within the past five years
B Good quality: Material officially sponsored by a professional,
public, or private organization or a government
agency; reasonably thorough and appropriate systematic
literature search strategy; reasonably consistent
results, sufficient numbers of well-designed studies; evaluation
of strengths and limitations of included studies
with fairly definitive conclusions; national expertise clearly
evident; developed or revised within the past five
years
C Low quality or major flaws: Material not sponsored by an
official organization or agency; undefined, poorly
defined, or limited literature search strategy; no evaluation of
strengths and limitations of included studies,
insufficient evidence with inconsistent results, conclusions
cannot be drawn; not revised within the past five
years
Level V
Based on experiential and nonresearch evidence
Includes:
• Integrative reviews
• Literature reviews
• Quality improvement, program, or financial
evaluation
• Case reports
• Opinion of nationally recognized expert(s)
based on experiential evidence
Organizational Experience (quality improvement, program or
financial evaluation)
A High quality: Clear aims and objectives; consistent results
across multiple settings; formal quality
improvement, financial, or program evaluation methods used;
definitive conclusions; consistent
recommendations with thorough reference to scientific evidence
B Good quality: Clear aims and objectives; consistent results in
a single setting; formal quality improvement,
financial, or program evaluation methods used; reasonably
consistent recommendations with some reference to
scientific evidence
C Low quality or major flaws: Unclear or missing aims and
objectives; inconsistent results; poorly defined
quality improvement, financial, or program evaluation methods;
recommendations cannot be made
Integrative Review, Literature Review, Expert Opinion, Case
Report, Community Standard,
Clinician Experience, Consumer Preference
A High quality: Expertise is clearly evident; draws definitive
conclusions; provides scientific rationale; thought
leader(s) in the field
B Good quality: Expertise appears to be credible; draws fairly
definitive conclusions; provides logical argument
for opinions
C Low quality or major flaws: Expertise is not discernable or is
dubious; conclusions cannot be drawn
http://www.york.ac.uk/crd/SysRev/!SSL!/WebHelp/6_4_ASSES
SMENT_OF_QUALITATIVE_RESEARCH.htm
http://www.york.ac.uk/crd/SysRev/!SSL!/WebHelp/6_4_ASSES
SMENT_OF_QUALITATIVE_RESEARCH.htm
RUBRIC FOR WEEK 4
Quantitative Critique Rubric:5.25.20
Criteria
Ratings
Pts
This criterion is linked to a Learning OutcomeIntent of the
research: is the title clear?
1 pts
This criterion is linked to a Learning OutcomeWhat is the RQ if
stated? What is the hypothesis if stated? (3) What are the issues
or variables being studied? What are the IV and DV variables?
(3)
6 pts
This criterion is linked to a Learning OutcomeSignificance of
the study: How is the research problem significant to nursing,
How will the findings improve practice (5 points)
5 pts
This criterion is linked to a Learning OutcomeMethods: What is
the study design? Describe. Was this appropriate? (5) What is
the level of evidence in this research? Describe the model used
to evaluate level of research. (3)
8 pts
This criterion is linked to a Learning OutcomeWas the sample
randomized or not randomized? (3) Was the process of sample
selection addressed? Was the sample size adequate? Was a
power analysis done? (3) What evidence was provided that
biases were eliminated or minimized? What steps were taken to
control confounding participant characteristics that could affect
the equivalence of groups being compared? Were these steps
adequate? (6)
12 pts
This criterion is linked to a Learning OutcomeMethods: What
were the inclusion and exclusion criteria? (3) Describe the
instrument used- was it reliable/valid? Is this addressed? (3)
6 pts
This criterion is linked to a Learning OutcomeProcedures:
Describe how the data was collected. Was it consistent? (3) Was
the DV always obtained in the same manner? (3)
6 pts
This criterion is linked to a Learning OutcomeAnalysis: What
type of analysis was done? Identify the statistics used-
appropriate for level of measurement? All assumptions met? (5)
Was analysis appropriate for the design/methods used? Was
rational provided for the use of statistical tests? (3)
8 pts
This criterion is linked to a Learning OutcomeWere the relevant
sample demographics described? (3) Were they used to answer
RQ when inferential statistics would have been more
appropriate? (3) What were the results of the study? (3) Were
any results significant? What do the tests tell about the RQ or
hypotheses? (3) Were any tests non-significant? Is it plausible
that these reflect a Type II error? (3) What factors might have
undermined the study’s statistical conclusion validity? (3)
18 pts
This criterion is linked to a Learning OutcomeWas an
appropriate amount of statistical information reported? Are the
findings clearly and logically organized? (3) Were tables or
figures used to summarize large amounts of statistical
information? (3)
6 pts
This criterion is linked to a Learning OutcomeResults and
interpretation: What was the researcher's interpretation of the
results? Do the results make sense? (3) Did the researcher draw
reasonable conclusions? (3)
6 pts
This criterion is linked to a Learning OutcomeDo the
researchers discuss the limitations of the study and their
possible effects on the credibility of the research? (3) Did the
researchers discuss the generalizability of the results? (3) Did
the researchers discuss the implications for clinical practice?
(3)
9 pts
This criterion is linked to a Learning OutcomeWhat is your
interpretation of the results? (3) How would you improve upon
this study if you were to conduct a similar study? (3)
6 pts
This criterion is linked to a Learning OutcomeCan the study
results make an important contribution? (3)
3 pts
Total Points: 100
D
ow
nloaded
from
https://journals-lw
w
-com
.proxy1.nku.edu/jaanp
by
BhD
M
f5ePH
Kav1zEoum
1tQ
fN
4a+kJLhEZkD
2PQ
TEnA3Z5k45N
O
+rAW
97pzN
D
e/ZLw
aQ
vBaym
kdfkXhckm
SxLPM
FzBM
Q
PVR
81VLrL7Sp4W
m
X/97IK1XYfd82hEzjiG
c40Ytw
buZ0LX/gn7cEN
9w
gdyN
Q
==
on
04/29/2020
Downloadedfromhttps://journals-lww-
com.proxy1.nku.edu/jaanpbyBhDMf5ePHKav1zEoum1tQfN4a+
kJLhEZkD2PQTEnA3Z5k45NO+rAW97pzNDe/ZLwaQvBaymkd
fkXhckmSxLPMFzBMQPVR81VLrL7Sp4WmX/97IK1XYfd82h
EzjiGc40YtwbuZ0LX/gn7cEN9wgdyNQ==on04/29/2020 Results
and implications from a gender minority health
education module for advance practice nursing students
Ralph J. Klotzbaugh, PhD (Assistant Professor)1, Suha Ballout,
RN, PhD (PhDAssistant Professor)2, &
Gale Spencer, RN, PhD (Distinguished Teaching Professor)3
ABSTRACT
Nursing literature has recognized deficits in lesbian, gay,
bisexual, transgender, queer-specific care. Of particular
concern is lack of knowledge about genderminorities. Lack of
knowledge remains despite this populations’ increased
health disparities. This pilot study investigates pre- and post-
knowledge of medical guidelines, disparities, policies,
and attitudes specific to gender minorities among advanced
practice nursing students attending a gender minority
health module. All participants in this pilot study completed a
questionnaire on content and a transphobia scale to
evaluate its effect on attitudes. Students were also surveyed on
previous experience with gender minority patients.
Students indicated sex and gender identity as female, with a
mean age of 33.5 years. Twenty-seven percent of the
students reported experience with gender minority patients.
Wilcoxon signed rank test indicated statistically sig-
nificant improvement in knowledge and improved scores on
transphobia. This study demonstrated a module on the
health of gender minorities is an effective method for increasing
student knowledge of gender minority health care.
Keywords: Advance practice education; cultural competency;
gender minority; transgender.
Journal of the American Association of Nurse Practitioners 32
(2020) 332–338, © 2019 American Association of Nurse
Practitioners
DOI# 10.1097/JXX.0000000000000249
Background
Nursing literature has recognized deficits in knowledge of
lesbian, gay, bisexual, transgender, queer (LGBTQ)-
specific care needs and considerations among nursing
students, educators, and care providers (Cornelius,
Enweana, Alston, & Baldwin, 2017; Lim, Johnson, & Eliason,
2015). In their study on perspectives of provider behaviors
among LGBTQ-identified clients, Rounds, Mcgrath, and
Walsh (2013) determined that although antidiscrimina-
tion laws have gradually improved attitudes and accep-
tance of LGBTQ individuals, knowledge related to the
LGBTQhealth needs continues to be lacking. This deficit is
particularly true of point-of-care providers, such as
physicians and nurse practitioners (Rounds et al., 2013;
Yingling, Cotler, & Hughes, 2017). Of particular concern is
lack of knowledge specific to transgender and gender
nonconforming populations. In their study of advanced
practice nurses’ knowledge and attitudes on caring for
transgender and gender nonconforming clients, Paradiso
and Lally (2018) found that all participants agreed that both
personal and professional deficits in knowledge can nega-
tively affect patient care. Participants also acknowledged
that improvement in advanced practice nursing curriculum
specific to the needs of genderminority health is necessary.
In fact, both the Institute of Medicine (2011) and the U.S.
Department of Health and Human Services (2016) have
called for prioritization in addressing gender minority
health disparities. Both institutions have cited lack of
training in gender minority health among health care pro-
viders as a critical barrier to health care delivery and well-
ness for this population. Lack of competent, knowledgeable
providers have accounted for gender minorities avoiding
health care services altogether. This avoidance contributes
to ongoing health care disparities and associated negative
health outcomes faced by gender minority populations.
In the interest of appropriate terminology and mean-
ing, transgender and gender nonconforming people are
those whose gender identity differs from the sex on their
birth certificate. This might include those who have made
or are making the transition from one gender identity to
the other. It might also include those who are questioning
their gender identity, those who identify with more than
one gender, or those who express their gender in ways
that might not typically be associated with that sex.
1College of Nursing, University of New Mexico, Albuquerque,
New
Mexico, 2Department of Nursing, College of Nursing and
Health
Sciences, University of Massachusetts, Boston, Massachusetts,
3Decker School of Nursing, Binghamton University, State
University of
New York, Binghamton, New York
Correspondence: Ralph J. Klotzbaugh, PhD, College of Nursing,
University of New Mexico, MSCO7 4380 Box 9, Albuquerque,
NM 87131.
Tel: 505272 0733; 607 761 1800; Fax: 505.272.9345; E-mail:
[email protected]
salud.unm.edu
Received: 10 January 2019; revised: 22 April 2019; accepted 24
April 2019
332 April 2020 · Volume 32 · Number 4 Journal of the
American Association of Nurse Practitioners
Education
© 2019 American Association of Nurse Practitioners.
Unauthorized reproduction of this article is prohibited.
Although there are a number of acceptable terms for this
group of individuals, the term gender minority (minori-
ties) will be used throughout in the interest of consistency
and inclusion.
Lack of knowledge among medical professionals
remains despite gender minorities’ increased health dis-
parities related to risk behaviors, chronic health complica-
tions, social factors, and access to quality health care. Risk
behaviors and chronic health complications are related to
much higher rates of substance abuse, HIV, and other sex-
ually transmitted infections, as well as psychological dis-
tress and attempted suicide. The 2015 US Transgender
Survey showed rates of HIV among gender minority pop-
ulations as nearly five times greater than in the general US
population. In addition, attempted suicide rates among
gender minorities are nearly nine times the rate in the
general US population (James et al., 2016).
In terms of social factors contributing to health dis-
parities among gender minorities, gender minority indi-
viduals experience higher rates of unemployment, housing
discrimination, and homelessness. Gender minorities also
face pervasive violence and harassment, including verbal
harassment, physical attack, and sexual assault.
Finally, gender minorities face multiple difficulties
accessing health care that is knowledgeable, welcoming,
and appropriate. Gender minorities often put off seeking
necessary health care for fear of mistreatment. Those
who do seek medical care report negative experiences
related to refusal of treatment or harassment (Kosenko,
Rintamaki, Raney, & Maness, 2013). In many reported
cases, gender minorities often have to teach their pro-
viders about transgender-specific health care needs to
obtain appropriate care (James et al., 2016).
Research has demonstrated that high levels of pro-
vider knowledge and the quality of their communication
continues to contribute toward improvements in patient
experiences and perceptions of care within the general
population with the potential to improve patient out-
comes (Mohammed et al., 2016). However, existing re-
search related to the health care of gender minority
populations has consistently demonstrated that in-
sufficiency of specific provider knowledge and competent
communication among health care providers continues
to play a significant role in the persistent health dis-
parities experienced by genderminorities (Kosenko, et al.,
2013; Park & Safer, 2018). It should therefore be of par-
ticular importance in nursing education to address these
disparities by familiarizing students with gender minority
health care needs. This knowledge can simultaneously
improve student behaviors and comfort levels to posi-
tively affect meaningful interventions for gender minority
populations (Rounds et al., 2013). Meaningful inter-
ventions might include (but not be limited to) in-
corporating considerations of the gender minority client
in existing courses such as advanced health assessment,
risk prevention, pharmacology, reproductive health, and
health policy. In their study on practicing nurses’ knowl-
edge of transgender patient needs, Carabez, Eliason, and
Martinson (2016) determined that most nurses have
insecurities and/or misconceptions related to gender
minority patients and their specific health care needs.
Despite the need to educate nurses on health care spe-
cific to gender minorities, findings from a national survey
of 1,000 nursing faculty show that nursing lags behind
other disciplines in terms of LGBTQ-related curricular
content (Lim et al., 2015). Specifically, findings demon-
strated an allotted mean of 2.12 hours of LGBTQ-related
content in nursing versus a mean of 5 hours of LGBTQ-
related content allotted by undergraduate medical edu-
cation (Lim et al., 2015; Obedin-Maliver et al., 2011).
Addressing gender minority health care needs within
nursing education is in keeping with the current position
statement by the American Nurses Association (2018) that
specifically encourages nurses to deliver culturally
competent care and advocacy for transgender clients.
Considering that much of the discrimination faced by
gender minorities has occurred with point-of-care pro-
viders, it might be especially critical to integrate gender
minority–specific health care content in advanced practice
nursing programs to begin to mitigate some of the dis-
crimination and negative experiences faced by gender mi-
nority clients in the health care environment. To date, even
less research on lesbian, gay, bisexual, transgender-in-
clusive curricular content is available specific to advanced
practice nursing (Manzer, O’Sullivan, & Doucet, 2018).
In this study, we sought to determine the knowledge of
medical guidelines, health disparities, and policies spe-
cific to gender minorities both before and after
attending a module on gender minority health among
advanced practice nursing students in an advanced
pharmacology course. In addition, we sought to de-
termine what effect attending the same module might
have on transphobia scores both before and after the
module presentation. Although there have been a num-
ber of studies examining attitudes and beliefs of students
enrolled in various health professions related to homo-
phobia, very few have looked at student attitudes and
beliefs regarding transphobia. In addition, there are very
few studies about students in health care professions
being exposed to gender minority content during their
formal education (Acker, 2017). Therefore, we sought to
address the educational needs evidenced in existing lit-
erature to determine whether advanced practice nursing
students’ knowledge, attitudes, and beliefs about gender
minorities might improve after participating in a gender
minority health care module.
Methods
Before presenting the module and collecting data, this
pilot study was submitted to the university’s institutional
Journal of the American Association of Nurse Practitioners
April 2020 · Volume 32 · Number 4 333
R. J. Klotzbaugh et al.
© 2019 American Association of Nurse Practitioners.
Unauthorized reproduction of this article is prohibited.
review board and was qualified as exempt from review
because of educational settings and practices. Eleven
students (representing one of a number of advanced
pharmacology course sections for students enrolled in
the advanced practice nursing program) participated in a
module on gender minority health as part of the ad-
vanced pharmacology course for advanced practice
nursing students. The module was approximately 90
minutes long and included gender minority–specific
content related to medical knowledge and health dis-
parities, as well as local and national policies. The ap-
proach to the module content was informed by current
studies reflecting themajor health issues, disparities, and
concerns among genderminorities. Themodule beganwith
an introduction to appropriate terminology, as well as a
discussion regarding the difference between sexual ori-
entation and gender identity. The importance of providing a
gender affirmative clinical practice such as intake forms
that include both sex assigned at birth and gender identity,
use of a clients preferred pronouns, and the provision of
gender neutral bathrooms was also discussed. In addition,
background related to gender minority health disparities
were also presented as a way to stress the importance of a
gender minority-specific health module. Both local and
national policies were also discussed, particularly because
they relate to insurance coverage or lack of insurance
coverage for transgender health-related services.
Given the focus of the course, however, the majority of
the presentationwas related to initiation and appropriate
management of gender affirmation hormone therapy for
the gender minority client. After presenting an overview
of gender affirmation therapy, students participated in
three different case studies to review, consider, and dis-
cuss. The module concluded with an open dialogue for
students to address any questions or particular concerns
about any of the content including the provision of gen-
der affirmation therapy. It is important that students were
provided with a copy of the presentation and suggested
further readings and appropriate online resources.
Participating students were enrolled in either the family
or adult-gerontology concentration. Students in this section
were all enrolled part-time in a program located in a large
urban area with a focus on the health of urban populations.
All of the students had previous experience working as
registered nurses before entering the advance practice
nursing program of study. To evaluate student learning, all
participants completed a questionnaire on the module
content both before and after attending the presentation.
The questionnaire covered concepts related to each gender
minority–specific content area. In addition, all participants
completed a transphobia scale both before and immedi-
ately after themodule presentation to evaluate its effect on
attitudes and beliefs about gender minorities. Finally, all
students were initially surveyed to obtain information re-
lated to their previous experience with gender minority
patients and whether they felt their curriculum adequately
covered gender minority health.
The questionnaire was an adaptation from an existing
questionnaire by Braun, Garcia-Grossman, Quiñones-
Rivera, and Deutsch (2017). Validity and reliability were
not reported for the questionnaire. The questionnaire
was adapted in part to reflect appropriate local health
policies for gender minorities. Maximum scores in
medical knowledge, health disparities, and local and
national policies were 11, 2, and 3, respectively, with 1
point given for each correct response in each of the
domains. Higher scores indicated greater knowledge in
each module domain (Table 1). The transphobia scale,
which is a 9-item scale developed by Nagoshi et al.
(2008) to measure prejudice against gender minorities,
was also used. Items were scored on a scale of 1 (dis-
agree) to 3 (agree), with 2 indicating neutrality. The
transphobia scale was selected for this study because it
demonstrated high internal consistency, with a re-
liability coefficient of 0.82 and a test-retest stability
correlation of 0.88. Lower scores indicated less trans-
phobia (Table 2).
Statistical analysis was performed using Statistical
Package for the Social Sciences (SPSS) 25.0 for Macintosh
(IBM, Armonk, NY). Nonparametric paired samples sta-
tistical analyses were used to analyze pretest and post-
test medical knowledge, health disparity, and policy
knowledge, as well as attitudes and beliefs about gender
minorities. Nonparametric tests were chosen because of
the small sample size.
Results
Demographic data collected for this sample were limited
to sex assigned at birth, gender identity, age, and previous
experience with gender minority patients. All students
indicated their sex and gender identity as female, with a
mean age of 33.5 years. Three students (27.3%) reported
having had previous experience with gender minority
patients, whereas 8 (72.7%) indicated they did not. Two
students (18.2%) indicated that the program had ade-
quately covered the topic, whereas 9 (81.8%) indicated
that the program had not.
The Wilcoxon signed rank test was conducted to
evaluate whether students showed improved medical
knowledge after participating in the gender minority
health module. Results indicated a significant difference
(Z = 22.98; p = .003). The mean of the ranks for pretest
medical knowledge was 4.73, whereas the mean for
posttest knowledge was 7.55.
A Wilcoxon signed rank test showed a significant dif-
ference in health disparity knowledge after participating
in the module (Z =22.74; p = .006). The mean of the ranks
for pretest health disparity knowledge was 0.55, whereas
themean posttest was 1.82. In terms of policy, a significant
difference was again indicated (Z = 22.98; p = .003). The
334 April 2020 · Volume 32 · Number 4 www.jaanp.com
Gender minority health education moduleEducation
© 2019 American Association of Nurse Practitioners.
Unauthorized reproduction of this article is prohibited.
www.jaanp.com
Table 1. Questionnaire items by domain of knowledge
Medical considerations
1. Match the following medications with the correct population
next to each drug. Populations codes are as follows:
M = female-to-male
F = male-to-female
N = not used
a. Spironolactone (F)
b. Estradiol (F)
c. Testosterone (M)
d. Antiestrogens (N)
e. Progestogens (F)
f. Premarin (N)
2. Which of the following statements regarding the medical care
of transgender patients is true?
a. After vaginoplasty, transgender women no longer need
prostate exams
b. Oral estrogen use among nonsmoking transgender women
still places them at high risk for DVT
c. Elevated cholesterol in transgender men should have their
testosterone immediately discontinued
d. Cervical cancer screening recommendations apply to
transgender men
e. Transgender women are at increased risk for breast cancer
and should be screened annually while on estrogen
3. What professional organization publishes the standards of
care of transgender and gender-nonconforming people for the
use by
primary care providers?
a. Institute of Medicine
b. World Health Organization
c. US Preventative Services
d. World Professional Association for Transgender Health
4. Which of the following are terms used to describe gender
identity?
a. Trans man
b. Lesbian
c. Male
d. Gay
e. Trans female
5. All transgender people have at least some surgery to alter
their bodies.
a. True
b. False
c. Uncertain
6. Which one of the following is a contraindication to estrogen
Quantitative Critique Rubric- 5.25.2020Student Name            .docx

More Related Content

Similar to Quantitative Critique Rubric- 5.25.2020Student Name .docx

Project Plans Each student will submit two project plan.docx
Project Plans  Each student will submit two project plan.docxProject Plans  Each student will submit two project plan.docx
Project Plans Each student will submit two project plan.docxwkyra78
 
· The 4 to 5-page limit refers to your analysis. The page limit do.docx
· The 4 to 5-page limit refers to your analysis. The page limit do.docx· The 4 to 5-page limit refers to your analysis. The page limit do.docx
· The 4 to 5-page limit refers to your analysis. The page limit do.docxalinainglis
 
10Appendix 1Student Guide to Case Analysis Using the Ameri.docx
10Appendix 1Student Guide to Case Analysis Using the Ameri.docx10Appendix 1Student Guide to Case Analysis Using the Ameri.docx
10Appendix 1Student Guide to Case Analysis Using the Ameri.docxdrennanmicah
 
NEW PRODUCT DEVELOPMENT FOR THE COMPANY DELL INC.ANALYZING THE.docx
NEW PRODUCT DEVELOPMENT FOR THE COMPANY DELL INC.ANALYZING THE.docxNEW PRODUCT DEVELOPMENT FOR THE COMPANY DELL INC.ANALYZING THE.docx
NEW PRODUCT DEVELOPMENT FOR THE COMPANY DELL INC.ANALYZING THE.docxhenrymartin15260
 
PART IWelcome to the Free Excel Student Template Version 16.1.11De.docx
PART IWelcome to the Free Excel Student Template Version 16.1.11De.docxPART IWelcome to the Free Excel Student Template Version 16.1.11De.docx
PART IWelcome to the Free Excel Student Template Version 16.1.11De.docxkarlhennesey
 
C o l o r a d o S t a t e U n i v e r s i t y - P u e b l o .docx
C o l o r a d o  S t a t e  U n i v e r s i t y - P u e b l o .docxC o l o r a d o  S t a t e  U n i v e r s i t y - P u e b l o .docx
C o l o r a d o S t a t e U n i v e r s i t y - P u e b l o .docxclairbycraft
 
Davenport university hcmg 770
Davenport university hcmg 770Davenport university hcmg 770
Davenport university hcmg 770leesa marteen
 
Itsnotthesizeofthedataitshowyouuseitsmartermarketingwithanalyticsanddashboards
ItsnotthesizeofthedataitshowyouuseitsmartermarketingwithanalyticsanddashboardsItsnotthesizeofthedataitshowyouuseitsmartermarketingwithanalyticsanddashboards
ItsnotthesizeofthedataitshowyouuseitsmartermarketingwithanalyticsanddashboardsKoen Pauwels
 
1 ECO 500 Final Project Guidelines and Rubric .docx
1  ECO 500 Final Project Guidelines and Rubric  .docx1  ECO 500 Final Project Guidelines and Rubric  .docx
1 ECO 500 Final Project Guidelines and Rubric .docxhoney725342
 
QUESTION 11. Discuss the differences between attributes and vari.docx
QUESTION 11. Discuss the differences between attributes and vari.docxQUESTION 11. Discuss the differences between attributes and vari.docx
QUESTION 11. Discuss the differences between attributes and vari.docxIRESH3
 
PSY 616 Milestone Three Guidelines and Rubric StrategyOverview.docx
PSY 616 Milestone Three Guidelines and Rubric StrategyOverview.docxPSY 616 Milestone Three Guidelines and Rubric StrategyOverview.docx
PSY 616 Milestone Three Guidelines and Rubric StrategyOverview.docxpotmanandrea
 
Strategic Thinking, TCF and Action Plans
Strategic Thinking, TCF and Action PlansStrategic Thinking, TCF and Action Plans
Strategic Thinking, TCF and Action PlansRupinder K Gill
 
1 6Researching Marketing QuestionsMKT57120.docx
1     6Researching Marketing QuestionsMKT57120.docx1     6Researching Marketing QuestionsMKT57120.docx
1 6Researching Marketing QuestionsMKT57120.docxhoney725342
 
Question 1 Which of the following is NOT one of the three main.docx
Question 1 Which of the following is NOT one of the three main.docxQuestion 1 Which of the following is NOT one of the three main.docx
Question 1 Which of the following is NOT one of the three main.docxaudeleypearl
 
Assignment 1 Models for Competitive DynamicsDue Week 2 and wort.docx
Assignment 1 Models for Competitive DynamicsDue Week 2 and wort.docxAssignment 1 Models for Competitive DynamicsDue Week 2 and wort.docx
Assignment 1 Models for Competitive DynamicsDue Week 2 and wort.docxfelicitytaft14745
 
BUSI 331Marketing Research Report Part 4 Instructions.docx
BUSI 331Marketing Research Report Part 4 Instructions.docxBUSI 331Marketing Research Report Part 4 Instructions.docx
BUSI 331Marketing Research Report Part 4 Instructions.docxhumphrieskalyn
 
How much does management matter?, Nicholas Bloom
How much does management matter?, Nicholas BloomHow much does management matter?, Nicholas Bloom
How much does management matter?, Nicholas BloomStructuralpolicyanalysis
 

Similar to Quantitative Critique Rubric- 5.25.2020Student Name .docx (20)

Project Plans Each student will submit two project plan.docx
Project Plans  Each student will submit two project plan.docxProject Plans  Each student will submit two project plan.docx
Project Plans Each student will submit two project plan.docx
 
· The 4 to 5-page limit refers to your analysis. The page limit do.docx
· The 4 to 5-page limit refers to your analysis. The page limit do.docx· The 4 to 5-page limit refers to your analysis. The page limit do.docx
· The 4 to 5-page limit refers to your analysis. The page limit do.docx
 
10Appendix 1Student Guide to Case Analysis Using the Ameri.docx
10Appendix 1Student Guide to Case Analysis Using the Ameri.docx10Appendix 1Student Guide to Case Analysis Using the Ameri.docx
10Appendix 1Student Guide to Case Analysis Using the Ameri.docx
 
NEW PRODUCT DEVELOPMENT FOR THE COMPANY DELL INC.ANALYZING THE.docx
NEW PRODUCT DEVELOPMENT FOR THE COMPANY DELL INC.ANALYZING THE.docxNEW PRODUCT DEVELOPMENT FOR THE COMPANY DELL INC.ANALYZING THE.docx
NEW PRODUCT DEVELOPMENT FOR THE COMPANY DELL INC.ANALYZING THE.docx
 
PART IWelcome to the Free Excel Student Template Version 16.1.11De.docx
PART IWelcome to the Free Excel Student Template Version 16.1.11De.docxPART IWelcome to the Free Excel Student Template Version 16.1.11De.docx
PART IWelcome to the Free Excel Student Template Version 16.1.11De.docx
 
C o l o r a d o S t a t e U n i v e r s i t y - P u e b l o .docx
C o l o r a d o  S t a t e  U n i v e r s i t y - P u e b l o .docxC o l o r a d o  S t a t e  U n i v e r s i t y - P u e b l o .docx
C o l o r a d o S t a t e U n i v e r s i t y - P u e b l o .docx
 
Davenport university hcmg 770
Davenport university hcmg 770Davenport university hcmg 770
Davenport university hcmg 770
 
Part_II.pptx
Part_II.pptxPart_II.pptx
Part_II.pptx
 
Itsnotthesizeofthedataitshowyouuseitsmartermarketingwithanalyticsanddashboards
ItsnotthesizeofthedataitshowyouuseitsmartermarketingwithanalyticsanddashboardsItsnotthesizeofthedataitshowyouuseitsmartermarketingwithanalyticsanddashboards
Itsnotthesizeofthedataitshowyouuseitsmartermarketingwithanalyticsanddashboards
 
1 ECO 500 Final Project Guidelines and Rubric .docx
1  ECO 500 Final Project Guidelines and Rubric  .docx1  ECO 500 Final Project Guidelines and Rubric  .docx
1 ECO 500 Final Project Guidelines and Rubric .docx
 
QUESTION 11. Discuss the differences between attributes and vari.docx
QUESTION 11. Discuss the differences between attributes and vari.docxQUESTION 11. Discuss the differences between attributes and vari.docx
QUESTION 11. Discuss the differences between attributes and vari.docx
 
PSY 616 Milestone Three Guidelines and Rubric StrategyOverview.docx
PSY 616 Milestone Three Guidelines and Rubric StrategyOverview.docxPSY 616 Milestone Three Guidelines and Rubric StrategyOverview.docx
PSY 616 Milestone Three Guidelines and Rubric StrategyOverview.docx
 
23234
2323423234
23234
 
Denise Rousseau's Generic EBMgt Class 4
Denise Rousseau's Generic EBMgt Class 4Denise Rousseau's Generic EBMgt Class 4
Denise Rousseau's Generic EBMgt Class 4
 
Strategic Thinking, TCF and Action Plans
Strategic Thinking, TCF and Action PlansStrategic Thinking, TCF and Action Plans
Strategic Thinking, TCF and Action Plans
 
1 6Researching Marketing QuestionsMKT57120.docx
1     6Researching Marketing QuestionsMKT57120.docx1     6Researching Marketing QuestionsMKT57120.docx
1 6Researching Marketing QuestionsMKT57120.docx
 
Question 1 Which of the following is NOT one of the three main.docx
Question 1 Which of the following is NOT one of the three main.docxQuestion 1 Which of the following is NOT one of the three main.docx
Question 1 Which of the following is NOT one of the three main.docx
 
Assignment 1 Models for Competitive DynamicsDue Week 2 and wort.docx
Assignment 1 Models for Competitive DynamicsDue Week 2 and wort.docxAssignment 1 Models for Competitive DynamicsDue Week 2 and wort.docx
Assignment 1 Models for Competitive DynamicsDue Week 2 and wort.docx
 
BUSI 331Marketing Research Report Part 4 Instructions.docx
BUSI 331Marketing Research Report Part 4 Instructions.docxBUSI 331Marketing Research Report Part 4 Instructions.docx
BUSI 331Marketing Research Report Part 4 Instructions.docx
 
How much does management matter?, Nicholas Bloom
How much does management matter?, Nicholas BloomHow much does management matter?, Nicholas Bloom
How much does management matter?, Nicholas Bloom
 

More from simonlbentley59018

Allison RogersProfessor KoenigCOMM 3313October 12th, 2018H.docx
Allison RogersProfessor KoenigCOMM 3313October 12th, 2018H.docxAllison RogersProfessor KoenigCOMM 3313October 12th, 2018H.docx
Allison RogersProfessor KoenigCOMM 3313October 12th, 2018H.docxsimonlbentley59018
 
Allen 1Kiah AllenProfessor HirschENG1018 Feb. 2018Defo.docx
Allen 1Kiah AllenProfessor HirschENG1018 Feb. 2018Defo.docxAllen 1Kiah AllenProfessor HirschENG1018 Feb. 2018Defo.docx
Allen 1Kiah AllenProfessor HirschENG1018 Feb. 2018Defo.docxsimonlbentley59018
 
All workings, when appropriate, must be shown to substantiate your.docx
All workings, when appropriate, must be shown to substantiate your.docxAll workings, when appropriate, must be shown to substantiate your.docx
All workings, when appropriate, must be shown to substantiate your.docxsimonlbentley59018
 
All yellow highlight is missing answer, please answer all of t.docx
All yellow highlight is missing answer, please answer all of t.docxAll yellow highlight is missing answer, please answer all of t.docx
All yellow highlight is missing answer, please answer all of t.docxsimonlbentley59018
 
All models are wrong. Some models are useful.—George E. P. B.docx
All models are wrong. Some models are useful.—George E. P. B.docxAll models are wrong. Some models are useful.—George E. P. B.docx
All models are wrong. Some models are useful.—George E. P. B.docxsimonlbentley59018
 
allclasses-frame.htmlAll ClassesAIBoardPlacementRandomModeRotati.docx
allclasses-frame.htmlAll ClassesAIBoardPlacementRandomModeRotati.docxallclasses-frame.htmlAll ClassesAIBoardPlacementRandomModeRotati.docx
allclasses-frame.htmlAll ClassesAIBoardPlacementRandomModeRotati.docxsimonlbentley59018
 
ALL WORK MUST BE ORIGINAL, CITED, IN APA FORMAT & WILL BE SUBMITTED .docx
ALL WORK MUST BE ORIGINAL, CITED, IN APA FORMAT & WILL BE SUBMITTED .docxALL WORK MUST BE ORIGINAL, CITED, IN APA FORMAT & WILL BE SUBMITTED .docx
ALL WORK MUST BE ORIGINAL, CITED, IN APA FORMAT & WILL BE SUBMITTED .docxsimonlbentley59018
 
ALL WORK MUST BE ORIGINAL, CITED IN APA FORMAT AND WILL BE SUBMITTED.docx
ALL WORK MUST BE ORIGINAL, CITED IN APA FORMAT AND WILL BE SUBMITTED.docxALL WORK MUST BE ORIGINAL, CITED IN APA FORMAT AND WILL BE SUBMITTED.docx
ALL WORK MUST BE ORIGINAL, CITED IN APA FORMAT AND WILL BE SUBMITTED.docxsimonlbentley59018
 
All views expressed in this paper are those of the authors a.docx
All views expressed in this paper are those of the authors a.docxAll views expressed in this paper are those of the authors a.docx
All views expressed in this paper are those of the authors a.docxsimonlbentley59018
 
All Wet! Legacy of Juniper Utility has residents stewingBy Eri.docx
All Wet! Legacy of Juniper Utility has residents stewingBy Eri.docxAll Wet! Legacy of Juniper Utility has residents stewingBy Eri.docx
All Wet! Legacy of Juniper Utility has residents stewingBy Eri.docxsimonlbentley59018
 
All three of the Aristotle, Hobbes, and Douglass readings discussed .docx
All three of the Aristotle, Hobbes, and Douglass readings discussed .docxAll three of the Aristotle, Hobbes, and Douglass readings discussed .docx
All three of the Aristotle, Hobbes, and Douglass readings discussed .docxsimonlbentley59018
 
All rights reserved. No part of this report, including t.docx
All rights reserved. No part of this report, including t.docxAll rights reserved. No part of this report, including t.docx
All rights reserved. No part of this report, including t.docxsimonlbentley59018
 
All PrinciplesEvidence on Persuasion Principles This provides som.docx
All PrinciplesEvidence on Persuasion Principles This provides som.docxAll PrinciplesEvidence on Persuasion Principles This provides som.docx
All PrinciplesEvidence on Persuasion Principles This provides som.docxsimonlbentley59018
 
All papers may be subject to submission for textual similarity revie.docx
All papers may be subject to submission for textual similarity revie.docxAll papers may be subject to submission for textual similarity revie.docx
All papers may be subject to submission for textual similarity revie.docxsimonlbentley59018
 
All of us live near some major industry. Describe the history of an .docx
All of us live near some major industry. Describe the history of an .docxAll of us live near some major industry. Describe the history of an .docx
All of us live near some major industry. Describe the history of an .docxsimonlbentley59018
 
All of Us Research Program—Protocol v1.12 IRB Approval Dat.docx
All of Us Research Program—Protocol v1.12 IRB Approval Dat.docxAll of Us Research Program—Protocol v1.12 IRB Approval Dat.docx
All of Us Research Program—Protocol v1.12 IRB Approval Dat.docxsimonlbentley59018
 
All participants must read the following article ATTACHED Agwu.docx
All participants must read the following article ATTACHED Agwu.docxAll participants must read the following article ATTACHED Agwu.docx
All participants must read the following article ATTACHED Agwu.docxsimonlbentley59018
 
ALL of the requirements are contained in the attached document.  T.docx
ALL of the requirements are contained in the attached document.  T.docxALL of the requirements are contained in the attached document.  T.docx
ALL of the requirements are contained in the attached document.  T.docxsimonlbentley59018
 
All five honorees cared greatly about the success of Capella lea.docx
All five honorees cared greatly about the success of Capella lea.docxAll five honorees cared greatly about the success of Capella lea.docx
All five honorees cared greatly about the success of Capella lea.docxsimonlbentley59018
 
All of the instructions will be given to you in a document. One docu.docx
All of the instructions will be given to you in a document. One docu.docxAll of the instructions will be given to you in a document. One docu.docx
All of the instructions will be given to you in a document. One docu.docxsimonlbentley59018
 

More from simonlbentley59018 (20)

Allison RogersProfessor KoenigCOMM 3313October 12th, 2018H.docx
Allison RogersProfessor KoenigCOMM 3313October 12th, 2018H.docxAllison RogersProfessor KoenigCOMM 3313October 12th, 2018H.docx
Allison RogersProfessor KoenigCOMM 3313October 12th, 2018H.docx
 
Allen 1Kiah AllenProfessor HirschENG1018 Feb. 2018Defo.docx
Allen 1Kiah AllenProfessor HirschENG1018 Feb. 2018Defo.docxAllen 1Kiah AllenProfessor HirschENG1018 Feb. 2018Defo.docx
Allen 1Kiah AllenProfessor HirschENG1018 Feb. 2018Defo.docx
 
All workings, when appropriate, must be shown to substantiate your.docx
All workings, when appropriate, must be shown to substantiate your.docxAll workings, when appropriate, must be shown to substantiate your.docx
All workings, when appropriate, must be shown to substantiate your.docx
 
All yellow highlight is missing answer, please answer all of t.docx
All yellow highlight is missing answer, please answer all of t.docxAll yellow highlight is missing answer, please answer all of t.docx
All yellow highlight is missing answer, please answer all of t.docx
 
All models are wrong. Some models are useful.—George E. P. B.docx
All models are wrong. Some models are useful.—George E. P. B.docxAll models are wrong. Some models are useful.—George E. P. B.docx
All models are wrong. Some models are useful.—George E. P. B.docx
 
allclasses-frame.htmlAll ClassesAIBoardPlacementRandomModeRotati.docx
allclasses-frame.htmlAll ClassesAIBoardPlacementRandomModeRotati.docxallclasses-frame.htmlAll ClassesAIBoardPlacementRandomModeRotati.docx
allclasses-frame.htmlAll ClassesAIBoardPlacementRandomModeRotati.docx
 
ALL WORK MUST BE ORIGINAL, CITED, IN APA FORMAT & WILL BE SUBMITTED .docx
ALL WORK MUST BE ORIGINAL, CITED, IN APA FORMAT & WILL BE SUBMITTED .docxALL WORK MUST BE ORIGINAL, CITED, IN APA FORMAT & WILL BE SUBMITTED .docx
ALL WORK MUST BE ORIGINAL, CITED, IN APA FORMAT & WILL BE SUBMITTED .docx
 
ALL WORK MUST BE ORIGINAL, CITED IN APA FORMAT AND WILL BE SUBMITTED.docx
ALL WORK MUST BE ORIGINAL, CITED IN APA FORMAT AND WILL BE SUBMITTED.docxALL WORK MUST BE ORIGINAL, CITED IN APA FORMAT AND WILL BE SUBMITTED.docx
ALL WORK MUST BE ORIGINAL, CITED IN APA FORMAT AND WILL BE SUBMITTED.docx
 
All views expressed in this paper are those of the authors a.docx
All views expressed in this paper are those of the authors a.docxAll views expressed in this paper are those of the authors a.docx
All views expressed in this paper are those of the authors a.docx
 
All Wet! Legacy of Juniper Utility has residents stewingBy Eri.docx
All Wet! Legacy of Juniper Utility has residents stewingBy Eri.docxAll Wet! Legacy of Juniper Utility has residents stewingBy Eri.docx
All Wet! Legacy of Juniper Utility has residents stewingBy Eri.docx
 
All three of the Aristotle, Hobbes, and Douglass readings discussed .docx
All three of the Aristotle, Hobbes, and Douglass readings discussed .docxAll three of the Aristotle, Hobbes, and Douglass readings discussed .docx
All three of the Aristotle, Hobbes, and Douglass readings discussed .docx
 
All rights reserved. No part of this report, including t.docx
All rights reserved. No part of this report, including t.docxAll rights reserved. No part of this report, including t.docx
All rights reserved. No part of this report, including t.docx
 
All PrinciplesEvidence on Persuasion Principles This provides som.docx
All PrinciplesEvidence on Persuasion Principles This provides som.docxAll PrinciplesEvidence on Persuasion Principles This provides som.docx
All PrinciplesEvidence on Persuasion Principles This provides som.docx
 
All papers may be subject to submission for textual similarity revie.docx
All papers may be subject to submission for textual similarity revie.docxAll papers may be subject to submission for textual similarity revie.docx
All papers may be subject to submission for textual similarity revie.docx
 
All of us live near some major industry. Describe the history of an .docx
All of us live near some major industry. Describe the history of an .docxAll of us live near some major industry. Describe the history of an .docx
All of us live near some major industry. Describe the history of an .docx
 
All of Us Research Program—Protocol v1.12 IRB Approval Dat.docx
All of Us Research Program—Protocol v1.12 IRB Approval Dat.docxAll of Us Research Program—Protocol v1.12 IRB Approval Dat.docx
All of Us Research Program—Protocol v1.12 IRB Approval Dat.docx
 
All participants must read the following article ATTACHED Agwu.docx
All participants must read the following article ATTACHED Agwu.docxAll participants must read the following article ATTACHED Agwu.docx
All participants must read the following article ATTACHED Agwu.docx
 
ALL of the requirements are contained in the attached document.  T.docx
ALL of the requirements are contained in the attached document.  T.docxALL of the requirements are contained in the attached document.  T.docx
ALL of the requirements are contained in the attached document.  T.docx
 
All five honorees cared greatly about the success of Capella lea.docx
All five honorees cared greatly about the success of Capella lea.docxAll five honorees cared greatly about the success of Capella lea.docx
All five honorees cared greatly about the success of Capella lea.docx
 
All of the instructions will be given to you in a document. One docu.docx
All of the instructions will be given to you in a document. One docu.docxAll of the instructions will be given to you in a document. One docu.docx
All of the instructions will be given to you in a document. One docu.docx
 

Recently uploaded

CELL CYCLE Division Science 8 quarter IV.pptx
CELL CYCLE Division Science 8 quarter IV.pptxCELL CYCLE Division Science 8 quarter IV.pptx
CELL CYCLE Division Science 8 quarter IV.pptxJiesonDelaCerna
 
Types of Journalistic Writing Grade 8.pptx
Types of Journalistic Writing Grade 8.pptxTypes of Journalistic Writing Grade 8.pptx
Types of Journalistic Writing Grade 8.pptxEyham Joco
 
Solving Puzzles Benefits Everyone (English).pptx
Solving Puzzles Benefits Everyone (English).pptxSolving Puzzles Benefits Everyone (English).pptx
Solving Puzzles Benefits Everyone (English).pptxOH TEIK BIN
 
Framing an Appropriate Research Question 6b9b26d93da94caf993c038d9efcdedb.pdf
Framing an Appropriate Research Question 6b9b26d93da94caf993c038d9efcdedb.pdfFraming an Appropriate Research Question 6b9b26d93da94caf993c038d9efcdedb.pdf
Framing an Appropriate Research Question 6b9b26d93da94caf993c038d9efcdedb.pdfUjwalaBharambe
 
Software Engineering Methodologies (overview)
Software Engineering Methodologies (overview)Software Engineering Methodologies (overview)
Software Engineering Methodologies (overview)eniolaolutunde
 
CARE OF CHILD IN INCUBATOR..........pptx
CARE OF CHILD IN INCUBATOR..........pptxCARE OF CHILD IN INCUBATOR..........pptx
CARE OF CHILD IN INCUBATOR..........pptxGaneshChakor2
 
call girls in Kamla Market (DELHI) 🔝 >༒9953330565🔝 genuine Escort Service 🔝✔️✔️
call girls in Kamla Market (DELHI) 🔝 >༒9953330565🔝 genuine Escort Service 🔝✔️✔️call girls in Kamla Market (DELHI) 🔝 >༒9953330565🔝 genuine Escort Service 🔝✔️✔️
call girls in Kamla Market (DELHI) 🔝 >༒9953330565🔝 genuine Escort Service 🔝✔️✔️9953056974 Low Rate Call Girls In Saket, Delhi NCR
 
ECONOMIC CONTEXT - PAPER 1 Q3: NEWSPAPERS.pptx
ECONOMIC CONTEXT - PAPER 1 Q3: NEWSPAPERS.pptxECONOMIC CONTEXT - PAPER 1 Q3: NEWSPAPERS.pptx
ECONOMIC CONTEXT - PAPER 1 Q3: NEWSPAPERS.pptxiammrhaywood
 
Roles & Responsibilities in Pharmacovigilance
Roles & Responsibilities in PharmacovigilanceRoles & Responsibilities in Pharmacovigilance
Roles & Responsibilities in PharmacovigilanceSamikshaHamane
 
“Oh GOSH! Reflecting on Hackteria's Collaborative Practices in a Global Do-It...
“Oh GOSH! Reflecting on Hackteria's Collaborative Practices in a Global Do-It...“Oh GOSH! Reflecting on Hackteria's Collaborative Practices in a Global Do-It...
“Oh GOSH! Reflecting on Hackteria's Collaborative Practices in a Global Do-It...Marc Dusseiller Dusjagr
 
Capitol Tech U Doctoral Presentation - April 2024.pptx
Capitol Tech U Doctoral Presentation - April 2024.pptxCapitol Tech U Doctoral Presentation - April 2024.pptx
Capitol Tech U Doctoral Presentation - April 2024.pptxCapitolTechU
 
Alper Gobel In Media Res Media Component
Alper Gobel In Media Res Media ComponentAlper Gobel In Media Res Media Component
Alper Gobel In Media Res Media ComponentInMediaRes1
 
ECONOMIC CONTEXT - LONG FORM TV DRAMA - PPT
ECONOMIC CONTEXT - LONG FORM TV DRAMA - PPTECONOMIC CONTEXT - LONG FORM TV DRAMA - PPT
ECONOMIC CONTEXT - LONG FORM TV DRAMA - PPTiammrhaywood
 
Organic Name Reactions for the students and aspirants of Chemistry12th.pptx
Organic Name Reactions  for the students and aspirants of Chemistry12th.pptxOrganic Name Reactions  for the students and aspirants of Chemistry12th.pptx
Organic Name Reactions for the students and aspirants of Chemistry12th.pptxVS Mahajan Coaching Centre
 
Hierarchy of management that covers different levels of management
Hierarchy of management that covers different levels of managementHierarchy of management that covers different levels of management
Hierarchy of management that covers different levels of managementmkooblal
 
How to Make a Pirate ship Primary Education.pptx
How to Make a Pirate ship Primary Education.pptxHow to Make a Pirate ship Primary Education.pptx
How to Make a Pirate ship Primary Education.pptxmanuelaromero2013
 
Crayon Activity Handout For the Crayon A
Crayon Activity Handout For the Crayon ACrayon Activity Handout For the Crayon A
Crayon Activity Handout For the Crayon AUnboundStockton
 
Meghan Sutherland In Media Res Media Component
Meghan Sutherland In Media Res Media ComponentMeghan Sutherland In Media Res Media Component
Meghan Sutherland In Media Res Media ComponentInMediaRes1
 

Recently uploaded (20)

TataKelola dan KamSiber Kecerdasan Buatan v022.pdf
TataKelola dan KamSiber Kecerdasan Buatan v022.pdfTataKelola dan KamSiber Kecerdasan Buatan v022.pdf
TataKelola dan KamSiber Kecerdasan Buatan v022.pdf
 
CELL CYCLE Division Science 8 quarter IV.pptx
CELL CYCLE Division Science 8 quarter IV.pptxCELL CYCLE Division Science 8 quarter IV.pptx
CELL CYCLE Division Science 8 quarter IV.pptx
 
Types of Journalistic Writing Grade 8.pptx
Types of Journalistic Writing Grade 8.pptxTypes of Journalistic Writing Grade 8.pptx
Types of Journalistic Writing Grade 8.pptx
 
Solving Puzzles Benefits Everyone (English).pptx
Solving Puzzles Benefits Everyone (English).pptxSolving Puzzles Benefits Everyone (English).pptx
Solving Puzzles Benefits Everyone (English).pptx
 
Framing an Appropriate Research Question 6b9b26d93da94caf993c038d9efcdedb.pdf
Framing an Appropriate Research Question 6b9b26d93da94caf993c038d9efcdedb.pdfFraming an Appropriate Research Question 6b9b26d93da94caf993c038d9efcdedb.pdf
Framing an Appropriate Research Question 6b9b26d93da94caf993c038d9efcdedb.pdf
 
Software Engineering Methodologies (overview)
Software Engineering Methodologies (overview)Software Engineering Methodologies (overview)
Software Engineering Methodologies (overview)
 
CARE OF CHILD IN INCUBATOR..........pptx
CARE OF CHILD IN INCUBATOR..........pptxCARE OF CHILD IN INCUBATOR..........pptx
CARE OF CHILD IN INCUBATOR..........pptx
 
call girls in Kamla Market (DELHI) 🔝 >༒9953330565🔝 genuine Escort Service 🔝✔️✔️
call girls in Kamla Market (DELHI) 🔝 >༒9953330565🔝 genuine Escort Service 🔝✔️✔️call girls in Kamla Market (DELHI) 🔝 >༒9953330565🔝 genuine Escort Service 🔝✔️✔️
call girls in Kamla Market (DELHI) 🔝 >༒9953330565🔝 genuine Escort Service 🔝✔️✔️
 
ECONOMIC CONTEXT - PAPER 1 Q3: NEWSPAPERS.pptx
ECONOMIC CONTEXT - PAPER 1 Q3: NEWSPAPERS.pptxECONOMIC CONTEXT - PAPER 1 Q3: NEWSPAPERS.pptx
ECONOMIC CONTEXT - PAPER 1 Q3: NEWSPAPERS.pptx
 
Roles & Responsibilities in Pharmacovigilance
Roles & Responsibilities in PharmacovigilanceRoles & Responsibilities in Pharmacovigilance
Roles & Responsibilities in Pharmacovigilance
 
“Oh GOSH! Reflecting on Hackteria's Collaborative Practices in a Global Do-It...
“Oh GOSH! Reflecting on Hackteria's Collaborative Practices in a Global Do-It...“Oh GOSH! Reflecting on Hackteria's Collaborative Practices in a Global Do-It...
“Oh GOSH! Reflecting on Hackteria's Collaborative Practices in a Global Do-It...
 
Capitol Tech U Doctoral Presentation - April 2024.pptx
Capitol Tech U Doctoral Presentation - April 2024.pptxCapitol Tech U Doctoral Presentation - April 2024.pptx
Capitol Tech U Doctoral Presentation - April 2024.pptx
 
Alper Gobel In Media Res Media Component
Alper Gobel In Media Res Media ComponentAlper Gobel In Media Res Media Component
Alper Gobel In Media Res Media Component
 
ECONOMIC CONTEXT - LONG FORM TV DRAMA - PPT
ECONOMIC CONTEXT - LONG FORM TV DRAMA - PPTECONOMIC CONTEXT - LONG FORM TV DRAMA - PPT
ECONOMIC CONTEXT - LONG FORM TV DRAMA - PPT
 
Organic Name Reactions for the students and aspirants of Chemistry12th.pptx
Organic Name Reactions  for the students and aspirants of Chemistry12th.pptxOrganic Name Reactions  for the students and aspirants of Chemistry12th.pptx
Organic Name Reactions for the students and aspirants of Chemistry12th.pptx
 
Hierarchy of management that covers different levels of management
Hierarchy of management that covers different levels of managementHierarchy of management that covers different levels of management
Hierarchy of management that covers different levels of management
 
How to Make a Pirate ship Primary Education.pptx
How to Make a Pirate ship Primary Education.pptxHow to Make a Pirate ship Primary Education.pptx
How to Make a Pirate ship Primary Education.pptx
 
Crayon Activity Handout For the Crayon A
Crayon Activity Handout For the Crayon ACrayon Activity Handout For the Crayon A
Crayon Activity Handout For the Crayon A
 
Meghan Sutherland In Media Res Media Component
Meghan Sutherland In Media Res Media ComponentMeghan Sutherland In Media Res Media Component
Meghan Sutherland In Media Res Media Component
 
9953330565 Low Rate Call Girls In Rohini Delhi NCR
9953330565 Low Rate Call Girls In Rohini  Delhi NCR9953330565 Low Rate Call Girls In Rohini  Delhi NCR
9953330565 Low Rate Call Girls In Rohini Delhi NCR
 

Quantitative Critique Rubric- 5.25.2020Student Name .docx

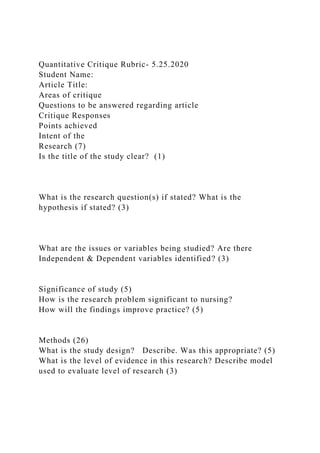
  • 1. Quantitative Critique Rubric- 5.25.2020 Student Name: Article Title: Areas of critique Questions to be answered regarding article Critique Responses Points achieved Intent of the Research (7) Is the title of the study clear? (1) What is the research question(s) if stated? What is the hypothesis if stated? (3) What are the issues or variables being studied? Are there Independent & Dependent variables identified? (3) Significance of study (5) How is the research problem significant to nursing? How will the findings improve practice? (5) Methods (26) What is the study design? Describe. Was this appropriate? (5) What is the level of evidence in this research? Describe model used to evaluate level of research (3)
  • 2. Was the sample randomized or not randomized? Was the sample selection addressed?(3) Was the sample size adequate? Was there a power analysis done? (3) What evidence was provided that biases were eliminated or minimized? What steps were taken to control confounding participant characteristics that could affect the equivalence of groups being compared? Were these steps adequate? (6) What were the inclusion and exclusion criteria? (3) Describe the instruments used- were they reliable/valid? Is this addressed? (3) Procedures (6) Describe how the data was collected- was it consistent? (3) Were the dependent variables always obtained in the same manner? (3) Analysis (32)
  • 3. What type of analysis was done? Identify the statistics used- were they appropriate for level of measurement? All assumptions met? (5) Was rationale provided for use of statistical tests? Was analysis appropriate for the design/methods used? (3) Were the relevant sample demographics described? (3) Were they used to answer RQ when inferential statistics would have been more appropriate? (3)
  • 4. What were the results of the study? (3) Were any results significant? What do the tests tell about the RQ or hypotheses? (3) Were any tests non-significant? Is it plausible that these reflect a Type II error? (3) What factors might have undermined the study’s statistical conclusion validity? (3) Was an appropriate amount of statistical information reported? Are the findings clearly and logically organized? (3) Were tables or figures used to summarize large amounts of statistical information? (3) Results and Interpretation (24) What was the researcher's interpretation of the results? (3) Do the results make sense? Did the researcher develop reasonable conclusions? (3) Do the researchers discuss the limitations of the study and their possible effects on the credibility of the research? (3) Did the researchers discuss the generalizability of the results? (3) Did the researchers discuss the implications for clinical practice? (3) What is your interpretation of the results? (3)
  • 5. How would you improve upon this study if you were to conduct a similar study? (3) Can the study results make an important contribution? (3) Total points: 100 Quantitative Critique Rubric 5.25.2020 PART IWelcome to the Free Excel Student Template Version 18.1Dear Student,By using this Template, you hereby agree to the Copyright terms and conditions. This Template should save you considerable time and allow for your presentation to be more professional. Do not mistake this Template for doing all of the work. Your assignment is to analyze and present strategies for the next three years. You will still need to do the research and enter key internal and external information into the Template. The Template does not gather or prioritize information. It does however assimilate information you enter in a professional way and does many calculations for you once that critical information is entered. Refer to the David & David textbook for conceptual guidelines for developing all matrices and analyses included in this Template. Best of luck with your project. This Template is designed for Textbook editions 17ed and 18th. Instructions for Using the Template1Please read all Template instructions below carefully before you start each new section of this Template. Only type in the green boxes. Refer to the David, David & David textbook for conceptual guidelines for every matrix and analysis in this Template.2This Template is organized into three primary parts: Part I, Part II, and the
  • 6. respective data output pages for your respective matrices. All data entered will be entered into Part I or Part II. Part I consists of data entry in developing matrices, where Part II consists of data entry for your financial information, including ratios, financial statements, and projected financial statements. Blue buttons are provided for navigating within and to Part I, yellow buttons are for navigating within and to Part II, orange buttons are for navigating to the respective matrices and pink buttons are for navigating to your financial output tables. The navigation buttons along the top of Part I and Part II may not be visible for Apple users but all other features should work without any problems.Strengths and Weaknesses1Enter into the Template exactly 10 strengths and 10 weaknesses, no more and no less. Your factors should be detailed and actionable rather than vague. For example, the strength: "Sales up nicely" is too vague and not actionable; "Sales were up 15% on women's apparel in China during 2018" is stated far better. Always be thinking in terms of divisions when writing strengths and weaknesses. Note women's apparel could be a division for Nike. All divisions do not need to be treated equally; allow more coverage for divisions with more revenue and those most pertinent to your strategic plan.2Weights reveal how important a factor is to being successful in the industry. All weights are "industry-based." A factor of 0.10 for example is 5 times more important than a factor of 0.02 for being successful in the industry. Do not be afraid to include factors with lower weights though. To have a factor make your top 10 list (10 strengths for example out of the 100s the firm likely has), justifies its importance, yet it still may be relatively a lot less important to the industry than others factors you include. Also, be mindful with respect to what industry your firm operates. A moderate priced casual hamburger restaurant may have more in common with a moderate priced chicken restaurant than with McDonalds (cheaper fast-food). Automatically considering McDonalds, Burger King, and Wendy's as the "industry" just because they all sell hamburgers may not be appropriate. Here, casual
  • 7. moderated priced restaurants may serve better as the "industry." After entering in the weights, check to make sure the sum of your weights equals 1.0 for your internal factors. Also, arrange your strengths with highly weighted factors listed first; arrange your Weaknesses also with highest weighted factors listed first.3In contrast to weights that are industry-based, ratings are company-based and reveal how well your firm is performing. Use the coding scheme given below for ratings in an IFE Matrix: If your strengths are being cut off, simply drag your cursor between the two row numbers on the left to widen the row.1 = "the response is poor"2 = "the response is average3 = "the response is above average"4 = "the response is superior"StrengthsWeightRatingActionableQuantitativeCompara tiveDivisional1Direct owner ship of 51% of stores1yyyy2Q2 2018 Same store sales increase 2% globally/4% in China, record profit 6B2yyyy3Pay employees well, above average pay, Stock options, Parental leave options2yyyy4Supply Chain Management (consistent quality in raw materials, and flow)2ynyy5Product Quality and consistency2ynyy6Ethical Business Values2ynyy7Brand Equity - Well known brand1yyy8Operational efficiency, and solid Financial Performance - increasing profits (operating margin 6.5% vs industry avg of 5%)1yyyy9Customer loyalty programs, and chase visa rewards program (53% of us corp store sales)3yyyy10Reinvestment Strategy, long term strategic planning - Multi-faceted strategic plan per region1yyyyWeaknessesWeightRatingActionableQuantitativeCo mparativeDivisional1EMEA Market, 11% decline in operating profits 20181yyyy2SBUX is highly dependent on the financial performance on North America (77% of profit)yyyy3Higher prices than competition(38% higher)yyyy4Products are not very distinct, other franchises have nearly identical products - McDonalds McCafé, Dunkin Donuts and a greater variety to draw in customersyyy5Product Recalls have had detrimental impact on the brandynyy6Issues with European taxes not being paid ( UK no taxes on 1.2B pounds in 2011-2012)yyyy7Product
  • 8. Standards - unhealthy products, Starbucks built brand on flavored and sweetened items, does not meet some cultural norms and are high calories, overdependence on coffee products1yyyy8Starbucks rely' s on foot traffic, not pandemic friendlynyy9volatile supply costsnnyy10Customer base is mid to upper calls wage earnersyyyyTotal Weight (Must Equal 1.00)0.000.7725550225Opportunities and Threats1Enter into this Template exactly 10 opportunities and 10 threats, no more no less. Your factors should be detailed and actionable rather than vague. Keep in mind both opportunities and threats should be external in nature. Ask yourself "Does the firm have control over this factor?" If the answer is yes, then it cannot be an opportunity or threat. For example, as a clothing retailer you may have an opportunity to "start selling clothes in China." This is not an opportunity for two reasons: 1) the firm has internal control over doing business in China, and 2) the statement is a strategy. The underlying opportunity may be "Women in China spent 20% more on athletic apparel in 2018." Note how this opportunity is specific, actionable, divisional, and external (we cannot control the culture or demand for female athletic apparel). All divisions do not need to be treated equally, allow more coverage for divisions with more revenue and those most pertinent to your strategic plan.2Weights reveal how important a factor is to being successful in the industry. Read over the #2 tip under strengths and weaknesses above since the same logic applies for the external factors. After entering in the weights, check to make sure your sum of weights equals 1.0 for all 20 external factors. List factors according with highest weight items first.3Ratings again are company-based and reflect how well the firm is addressing the particular factor. Use the coding scheme given below for ratings in an EFE Matrix. If your opportunities are being cut off, simply drag your cursor between the two row numbers on the left to widen the row.1 = the response is poor"2 = "the response is average"3 = "the response is above average"4 = "the response is superior"OpportunitiesSFWeightRatingWRActionableQuantitive
  • 9. ComparableDivsional1Premium Experience at Reserve stores with Princi, expand bar service, premium food options50.0430.1063829787YNYy2Coffee subscription (Circle K- 200% increase in foot traffic, 70% increase if food sales, 90- 95%RenewAL RATE)80.0640.2269503546yYyy3Diversification into more products beyond Coffee and Tea into more food products80.0620.1134751773YNYn4Emerging markets - enter markets with limited competition, adapt to local markets - ex McDonalds in India does not sell beef, but has ventured into the vegetarian food market.70.0530.1489361702yyy5competitive pricing50.0430.1063829787Yyy6Follow latest drink trends90.0630.1914893617yyy7steady forecast for revenue growth/consumption growth80.0610.0567375887nnnn8Business partnerships and alliances (potentially responsible for sales by 1/3)40.0330.085106383ynyy9Faster Service - Corrective measures to fix long lines - more advanced Machines?90.0640.2553191489yyyy10Self-service Machines70.0540.1985815603yyyyThreatsWeightRating1Dunki n Donuts 2nd in market shares in USA, and growing with coffee adjacent products70.0540.1985815603yyyy2McDonalds 2nd in market share globally70.0540.1985815603yyyy3Sales decline due to decline in customer traffic90.0630.1914893617nnyy4Brand Relevance - Business incidents (Unionization)60.0430.1276595745ynyy5evolving consumer preferences and tastes80.0630.170212766ynyy6Cyber Security and Data Privacy40.0330.085106383ynyy7Pandemic/Global Recession - temporary closed 2K stores in China, 50% of corp stores and 43% of licensed stores-lost 915M+ so far (June 2021)80.0630.170212766nyyy8Increased costs to maintain supply chains, and raw material costs, and high 50.0440.1418439716yyyy9Competition from local favorite brands(incumbents) , EMEA has a different coffee culture90.0630.1914893617nyyy10Executive Changeover - Chief Executive (Howard Shultz) retiring for the 3rd time80.0610.0567375887nnyn141Total Weight (Must Equal
  • 10. 1.00)1.00Competitive Profile Matrix (CPM)1To perform the CPM, enter up to 12 critical success factors. You may use some of the ones listed below if you like but try to use ones that are more pertinent to your company. For example, if your case is Delta Airlines, perhaps include on time arrival, extra fees, and frequent flyer points as factors, rather than the canned factors below. In a CPM, factors do not need to be overly specific, but they should be divisional in nature to the extent possible. If Pepsi Co. is your firm, your factors should be about the firm's soda business, Frito Lay business, bottling business, etc. (Pepsi Co competes in a lot more than just soda) rather than just general "advertising." Advertising for what division (business) are you referring to? Frito Lay's advertising, soda marketing, etc. All divisions do not need to be treated equally; allow more coverage for divisions with more revenue and those most pertinent to your strategic plan.2After entering in your critical success factors, enter in a weight for each factor; weights are industry-based. Be sure to check the bottom of the "Enter Weight Below" column, to make sure your sum weight is equal to 1.00. It is okay for some factors to receive a low weight and a factor or two to receive a high weight of say 0.20. 3After entering in your weights, type the name of your company and two other competitors in the corresponding boxes.4After entering in the weights and identifying your company and two rival firms, then enter in a Rating (company-based) in the "Enter Rating Below" column for each organization. DO NOT ASSIGN THE COMPANIES THE SAME RATING; TAKE A STAND; MAKE A CHOICE. In a CPM, use the coding scheme provided below for ratings.1 = "the response is poor"2 = "the response is average"3 = "the response is above average"4 = "the response is superior"Enter 12 Factors Below WeightYour FirmRivalRivalEnter Ratings BelowAdvertisingDomestic Market PenetrationCustomer ServiceProduct VarietyInternational Market Penetration Employee DedicationFinancial ProfitCustomer LoyaltyMarket ShareProduct QualityTop ManagementPrice
  • 11. Competitiveness0.00Boston Consulting Group (BCG) Matrix1This Template allows for up to 5 divisions. If your company has more than 5 divisions, combine the divisions with the least amount of revenue into division 5, and mention the adjustment to the class during your presentation, or simply focus on the 5 divisions your 3-year plan centers around; check with your professor. <See your firm's Form 10K or Annual Report to find divisional information, and those documents of your rivals> It is excellent to develop a BCG/IE by geographic region, and construct another one by product (if you have the data). 2In each division, enter a name, followed by the dollar amount in revenues for that division. Do not include M or B for millions or billions, but do drop off zeros. For example, for $100,000,000, you could enter $100,000 or $100, just be consistent.3After completing Step 2 in developing a BCG, enter in the dollar amount in revenues for the top rival firm for each division. Note, the top rival may be you and in this situation enter in your company's revenue for that division. Also, note the top rival may be different for different divisions. For example, if your firm is Avon, Avon's top rival in its lipstick division may be Revlon, but for nail polish, the top rival in the industry may be L'Oréal, and in makeup, Avon may be the market leader. There is no need to label the top rival by name, but you could mention in class as part of your presentation. Be sure to enter in all numbers in the same $ format you used in Step 2 above. If you do not have a perfect apples to apples comparison, (possibly a rival firm combines lipstick and makeup, where your firm separates the two) then estimate as best you can and make note in your presentation.4Finally, enter in the industry growth rate (IGR) for each division. Generally, taking the top 2 or 3 rivals for each division (along with your firm), adding their numbers together for the current year and the previous year and using the equation (Current Year - Previous Year) / Previous Year is sufficient to estimate guess of the industry growth rate. This is because generally the top 3 players dominate an industry. Note, using this process also weights larger firms
  • 12. more, which is exactly what you desire. Do not use total revenues; instead, use divisional revenues. Division industry growth rates (IGR) must be between -0.20 and 0.20. If outside these ranges, simply use -0.20 or 0.20 and mention during your presentation.5Everything is calculated and positioned for you (Other than Industry Growth Rate in Step 4) including the Relative Market Share Position (RMSP). The BCG matrix in this Template does not produce pie slices to show profits. You may wish to discuss divisional profits in your presentation.Enter in division names below (If less than 5, leave the other spaces blank and no circles will appear)Your Firm's Division RevenuesTop Firm in Industry Division RevenuesDivision Market Growth Rate (Step 4)Relative Market Share PositionHandcrafted beverages $18.20$18.200.201.00Food$5.16$23.200.200.22Other (merchandise, grab-and- go)$1.24$1.240.051.00NANAMcDonalds is top food rival Internal - External (IE) Matrix1This Template allows for up to 5 divisions. If the company has more than 5 divisions, combine the divisions with the least amount of revenue into division 5, and mention the adjustment to the class during your presentation, or simply focus on the 5 divisions that your 3-year plan centers around; check with your professor.2Company wide EFE and IFE scores are automatically entered once you complete the EFE and IFE Matrices.3Enter in estimated EFE and IFE Scores for your respective divisions.4This Template's IE matrix does not produce pie slices to show profits. Enter The Name Of Your FirmEnter in division names below. If less than 5, leave the other spaces blank and no circles will appear. Remember you could use divisions by geographic region for the BCG and by product/service type for the IE (or vice versa).Your Firm's Division RevenuesEstimated IFE ScoreEstimated EFE ScoreAmerica$15,6523.23.5CAP$3,2403.03.0EMEA$1,0142.01. 2Channel Development$2,0092.52.8All other segments$4721.82.0SPACE Matrix1Include up to five factors to assess each SPACE axis: Financial Position (FP), Stability
  • 13. Position (SP), Competitive Position (CP), and Industry Position (IP) and the corresponding rating each factor should receive.2You may use the factors provided here, but try to determine key factors related to your company and industry in the same manner you did with the CPM. The calculations are done automatically and the rating scale is provided below.3Enter in the estimated FP, SP, CP, and IP numbers for up to two competitors. Or, instead of a competitor, you could show the estimated SPACE values for your firm after your proposed recommendations are implemented, ie a Before and After analysis. Or you could do both, just cut and paste the SPACE into PowerPoint then refill in the new data. It is important you fill in all information or Excel will place a circle(s) at the origin of the SPACE since the default will be (0,0) plot, which is the origin. FP and IPPositive 1 (worst) to Positive 7 (best)CP and SPNegative 1 (best) to Negative 7 (worst)Starbucks CorporationRatingsSBUXMcDonaldsKhcFinancial Position (FP)Current Ratio41.19691.7782https://www.macrotrends.net/stocks/charts/ SBUX/starbucks/financial-ratiosDebt to Equity7-2.7502- 7.7424https://www.macrotrends.net/stocks/charts/SBUX/starbuc ks/financial-ratiosNet Income6$ 6,396,200$ 12,224,100https://www.macrotrends.net/stocks/charts/SBUX/sta rbucks/income-statementRevenue7$ 29,060,600$ 23,222,900https://www.macrotrends.net/stocks/charts/SBUX/sta rbucks/income-statementInventory Turnover75.4484191.4155https://www.macrotrends.net/stocks/c harts/SBUX/starbucks/financial-ratiosIndustry Position (IP)Growth Potential6Financial Stability7Ease of Entry into Market4Resource Utilization6Profit Potential7RatingsCompetitive Position (CP)Market Share- 1Product Quality-4Customer Loyalty-2Variety of Products Offered-6Control over Suppliers and Distributors-1Stability Position (SP)Rate of Inflation-5Technological Changes-5Price Elasticity of Demand-3Competitive Pressure-4Barriers to Entry
  • 14. into Market-2Your firm's X-axis3.2Your firm's Y- axis2.4MCDonaldsEstimated FP6Estimated IP7Estimated CP- 2Estimated SP -2Competitor 1's X-axis5.0Competitor 1's Y- axis4.0Maxwell HouseEstimated FP2Estimated IP4Estimated CP-6Estimated SP -1Competitor 2's X-axis-2.0Competitor 2's Y-axis1.0Perceptual Map1In this Template's Perceptual Map, you may include for up to 10 product categories. 2Enter in the X axis and Y axis dimensions. For example, if developing a map for frozen foods your X axis could range from "low calorie" to "high calorie," while the Y axis ranges from "low cost" to "high cost."3Enter in the products you wish to compare (up to 10); in the example, these products would be different brands of frozen foods available for purchase. After entering in the products, rate each factor on a scale of 1 to 9. In our example, extremely low calorie would receive a score of 1 or 2, and likewise extremely high calorie should receive a score of 8 or 9.4To enhance this analysis, you could mentally draw a line (or two lines) of best fit (through products) and identify areas along the line that do not have (in this example) frozen food products near the line. In this analysis, blank areas of the map are typically the most advantageous for new product creation. Any products that fall well above or below the line, may be over or under serving customers and should be examined closely. Do not blindly follow this rule of thumb however since, for example, a very expensive product may be well off the projected best fit line and yet serve its small customer base quite well. You may with this Template wish to develop several perceptual maps changing your X and Y dimensions. For example, if you are a large food processor, you could examine frozen foods on dimensions other than the ones used here, or you could examine dairy products or any other related products. Simply cut and paste your existing map into Power Point then enter your data for a new map.Enter The Name of the Dimensions on the X-axisEnter The Name of the Dimensions on the Y-axisEnter in up to 10 productsX - axis RatingY - axis RatingGrand Strategy Matrix1The Grand Strategy Matrix allows for entry of your firm and up to 5
  • 15. divisions2Rank the X axis from 1 (Extremely Weak Competitive Position) to 9 (Extremely Strong Competitive Position)3Rank the Y axis from 1 (Extremely Slow Market Growth) to 9 (Extremely Rapid Market Growth)X-axis scoreY-axis scoreSWOT1Click on the SWOT Hyperlink below and add your SLOWEST, and WT Strategies.QSPM1.To perform a QSPM, enter two strategies in the corresponding green boxes below. These two strategies should be derived from your BCG, IE, SPACE, GRAND, and SWOT. In your oral or written project, you will need to provide a recommendations page(s) on your own with the expected cost of each recommendation, ie after performing the QSPM. The recommendations page is followed by an EPS/EBIT Analysis to reveal where best to obtain the needed capital (debt vs equity). You should have multiple recommendations, including perhaps both strategies included in the QSPM, and other strategies for the firm - but no firm can do everything that would benefit the firm due to limited resources.2.In developing a QSPM, after entering in your strategies, then rate each strategy based on the strengths, weaknesses, opportunities, and threats (factors). Do not give two strategies the same rating for a particular strength, weakness, opportunity, or threat. (the exception is if you enter 0 to signify a factor "not impacting the choice between strategies" then you MUST enter 0 for both strategies. For example, if Strategy 1 deserves a rating of 4 on a given factor, but that factor has little to do with Strategy 2, just assign a rating of 1 to Strategy 2. (Note QSPM's will have 0's across about one half of the rows). Across each row in performing QSPM analysis, use the rating scale below for AS scores.0 = Not applicableStrategy OneStrategy Two1 = Not attractive2 = Somewhat attractive3 = Reasonably attractive4 = Highly attractiveAS RatingsAS RatingsStrengths1Direct owner ship of 51% of stores2Q2 2018 Same store sales increase 2% globally/4% in China, record profit 6B3Pay employees well, above average pay, Stock options, Parental leave options4Supply Chain Management (consistent quality in raw materials, and flow)5Product Quality
  • 16. and consistency6Ethical Business Values7Brand Equity - Well known brand8Operational efficiency, and solid Financial Performance - increasing profits (operating margin 6.5% vs industry avg of 5%)9Customer loyalty programs, and chase visa rewards program (53% of us corp store sales)10Reinvestment Strategy, long term strategic planning - Multi-faceted strategic plan per regionAS RatingsAS RatingsWeaknesses1EMEA Market, 11% decline in operating profits 20182SBUX is highly dependent on the financial performance on North America (77% of profit)3Higher prices than competition(38% higher)4Products are not very distinct, other franchises have nearly identical products - McDonalds McCafé, Dunkin Donuts and a greater variety to draw in customers5Product Recalls have had detrimental impact on the brand6Issues with European taxes not being paid ( UK no taxes on 1.2B pounds in 2011- 2012)7Product Standards - unhealthy products, Starbucks built brand on flavored and sweetened items, does not meet some cultural norms and are high calories, overdependence on coffee products8Starbucks rely' s on foot traffic, not pandemic friendly9volatile supply costs10Customer base is mid to upper calls wage earnersAS RatingsAS RatingsOpportunities1Premium Experience at Reserve stores with Princi, expand bar service, premium food options2Coffee subscription (Circle K- 200% increase in foot traffic, 70% increase if food sales, 90-95%RenewAL RATE)3Diversification into more products beyond Coffee and Tea into more food products4Emerging markets - enter markets with limited competition, adapt to local markets - ex McDonalds in India does not sell beef, but has ventured into the vegetarian food market.5competitive pricing6Follow latest drink trends7steady forecast for revenue growth/consumption growth8Business partnerships and alliances (potentially responsible for sales by 1/3)9Faster Service - Corrective measures to fix long lines - more advanced Machines?10Self-service MachinesAS RatingsAS RatingsThreats1Dunkin Donuts 2nd in market shares in USA, and growing with coffee adjacent products2McDonalds
  • 17. 2nd in market share globally3Sales decline due to decline in customer traffic4Brand Relevance - Business incidents (Unionization)5evolving consumer preferences and tastes6Cyber Security and Data Privacy7Pandemic/Global Recession - temporary closed 2K stores in China, 50% of corp stores and 43% of licensed stores-lost 915M+ so far (June 2021)8Increased costs to maintain supply chains, and raw material costs, and high 9Competition from local favorite brands(incumbents) , EMEA has a different coffee culture10Executive Changeover - Chief Executive (Howard Shultz) retiring for the 3rd timeYou have completed Part 1. Click The Blue Buttons Below to Navigate Part 1 More Efficiently Strengths /xl/drawings/drawing1.xml#'PART%20I'!B13 Perceptual Maps /xl/drawings/drawing1.xml#'PART%20I'!B255 Weaknesses /xl/drawings/drawing1.xml#'PART%20I'!B39 Opportunities /xl/drawings/drawing1.xml#'PART%20I'!B55 Threats /xl/drawings/drawing1.xml#'PART%20I'!B81 SWOT /xl/drawings/drawing1.xml#'PART%20I'!B311 CPM
  • 18. /xl/drawings/drawing1.xml#'PART%20I'!B99 IE Matrix /xl/drawings/drawing1.xml#'PART%20I'!B155 BCG Matrix /xl/drawings/drawing1.xml#'PART%20I'!B131 SPACE Matrix /xl/drawings/drawing1.xml#'PART%20I'!B181 GRAND /xl/drawings/drawing1.xml#'PART%20I'!B294 QSPM /xl/drawings/drawing1.xml#'PART%20I'!B317 View IFE Matrix/xl/drawings/drawing1.xml#'IFE%20'!A1 View IFE Matrix/xl/drawings/drawing1.xml#'IFE%20'!A1 HOME/xl/drawings/drawing1.xml#'PART%20I'!A2 View EFE Matrix/xl/drawings/drawing1.xml#'EFE%20'!A1 View EFE Matrix/xl/drawings/drawing1.xml#'EFE%20'!A1 View CPM Matrix/xl/drawings/drawing1.xml#CPM!C2 View CPM Matrix/xl/drawings/drawing1.xml#CPM!C2 BCG/xl/drawings/drawing1.xml#BCG!B5 BCG/xl/drawings/drawing1.xml#BCG!B5 IE
  • 19. /xl/drawings/drawing1.xml#IE!B2 IE /xl/drawings/drawing1.xml#IE!B2 SPACE /xl/drawings/drawing1.xml#SPACE!B2 SPACE /xl/drawings/drawing1.xml#SPACE!B2 Perceptual Map /xl/drawings/drawing1.xml#'Perceptual%20Map'!B2 Perceptual Map /xl/drawings/drawing1.xml#'Perceptual%20Map'!B2 SWOT /xl/drawings/drawing1.xml#SWOT!A2 QSPM /xl/drawings/drawing1.xml#QSPM!B2 GRAND /xl/drawings/drawing1.xml#GRAND!B2 GRAND /xl/drawings/drawing1.xml#GRAND!B2 QSPM /xl/drawings/drawing1.xml#QSPM!B2 PART IIPreliminary Financial Data1Enter in your preliminary financial data below for your company. This data is used to construct financial statements, financial ratios, and much more. Income Statement InformationEnter all as Dollar Amounts. Make sure the oldest year is entered into Column 1 throughout this Template. You may NOT Change this sequence as the
  • 20. preset equations will not adjust.Read the Note to the left CAREFULLY Reporting DateRevenueCost of Goods SoldOperating expensesInterest ExpenseNote: If receiving interest credit, enter as NEGATIVE numberNon-recurring EventsNote: If NEGATIVE enter as negative number. Generally this line is for "discontinued operations" and 90% of the time you will enter 0TaxNote: If receiving a tax credit, enter as NEGATIVE numberBalance Sheet InformationCurrent Assets12/31/9912/31/99Cash and equivalents and Short Term InvestmentsAccounts ReceivableInventoryOther Current AssetsLong Term AssetsProperty, plant & equipmentGoodwillIntangiblesOther Long-term AssetsCurrent LiabilitiesAccounts PayableOther Current LiabilitiesLong Term LiabilitiesLong-term DebtOther Long-term LiabilitiesEquity Common StockRetained EarningsTreasury StockNote: Enter as negative numberPaid in Capital & OtherCompany Valuation1Enter in the corresponding data below for your firm, and for a rival firm if you desire. The rival can be a firm you wish to acquire or simply just to compare to your case company.Stockholders' Equity0Note: Determined after you complete the preliminary section.Net Income0Note: Determined after you complete the preliminary section.EPSERROR:#DIV/0!Note: Determined after you complete the preliminary section and enter in # shares outstanding below.# Shares OutstandingNote: Using Current # shares outstanding is okay or # of shares outstanding (issued) on the last day of the fiscal year.Stock PriceNote: Current Stock price is fine, or the closing price on the last day of the fiscal year.Goodwill & Intangibles0Note: Determined after you complete the preliminary section.Rival Firm's NameStockholders' EquityNet IncomeEPS# Shares OutstandingStock PriceGoodwill & IntangiblesEPS/EBIT Analysis1Enter in the corresponding data below for your firm.2If you notice little to no change in EPS with stock vs debt financing, the total amount of your recommendations is likely too low. Unless of course, you are recommending defensive
  • 21. strategies where you are not acquiring substantial new capital.PessimisticRealisticOptimisticEBITEPS/EBIT DataAmounted NeededNote: This number is the total cost of your recommendations.Interest RateNote: Enter as a decimal.Tax RateNote: Enter as a decimal.Shares Outstanding0Note: Enter in under Company Valuation on this page.# New Shares OutstandingERROR:#DIV/0!Note: Calculated automaticallyStock Price$0.00Note: Enter in under Company Valuation on this page.Combination Financing DataPercent Equity Used to FinanceNote: Enter as a decimal.Percent Debt Used to Finance Note: Enter as a decimal.Total Equity and Debt0.00Note: Must equal 1.0. Check the two line items above.Projected Financial Statements1Start with the income statement and work your way from top to bottom. Take extreme care to read and understand all notes provided by each line item. See Chapter 8 in the David & David textbook for examples and guidelines in developing projected financial statements.2After completing the income statement, begin the balance sheet starting with the "dividends to pay" line near the bottom; finish the equity section of the balance sheet first, then work your way up the statement to the liabilities section, then onto the assets, using the top row (Cash) as the plug figure. A detailed note beside the cash line item explains further.3Take care to read all notes to the right of the line items. Consult Chapter 8 of the David & David textbook for excellent explanations and tips for constructing projected statements.Percentages in the Projected Income Statement will be multiplied by the most recent year. For example, if you enter in 10% for projected revenues in projected year 2, the Template will use the equation (1.10 x projected year 1 revenues) = projected year 2 revenues. For line items in the projected income statement requesting dollar amounts, please read the note below for the balance sheet. The calculations work the same way as described there.Projected Years (earliest to latest)Income StatementHistorical Numbers (see notes) Projected Reporting DateHistorical Percent Notes Below. Enter
  • 22. your data in the EXACT same format as the Notes describe.RevenuesERROR:#DIV/0!Historical Note: Difference the two most recent years of data. Enter percent increases you expect based on your recommendations. Do not blindly use the historical number provided. Enter as percent.Cost of Goods SoldERROR:#DIV/0!Historical Note: Percent of Sales in the most recent year. Use a similar percent across all three projected years unless you believe COGS to sales percent will change drastically. Enter as percent.Operating ExpensesERROR:#DIV/0!Historical Note: Percent of Sales in the most recent year. Use a similar percent across all three projected years unless you believe Operating Expenses to sales percent will change drastically. Enter as percent.Interest Expense$0Historical Note: Dollar amount of interest paid in the most recent year. Enter in the NEW NET dollar amounts of interest you will forecasted for each year. If your most recent interest payment was $500 and you plan on a $20 net increase in interest for projected year 1, simply enter in $20 for year one. If financing through debt, the number is more likely to increase more than if financing through equity. Enter as dollar amount. If you anticipate less interest expense than the year before, enter as a negative number.TaxERROR:#DIV/0!Historical Note: Tax Rate in most recent year. You can likely use the same tax rate throughout unless you expect a large increase/decrease in revenues and subsequently EBT. Enter as percent.Non- Recurring Events0Historical Note: Dollar amount of Non- Recurring Events for each year, this number is not cumulative. Safe to forecast this number as $0 in ever year. Enter as dollar amount.Scroll Down for Balance SheetWork from the bottom of the Projected Balance Sheet to the top Projected Years (earliest to latest)Balance Sheet (Start at the bottom)Historical Dollar Amount PaidThe projected Balance Sheet is designed for you to enter in the NET ADDITIONAL DOLLAR VALUES (for PPE, Goodwill, and Intangibles). The Template will add these values to the existing numbers. For Example, if you are adding $1,000 in inventory in projected year 1, (but you estimate your
  • 23. firm used $800 of its existing inventory from the prior year) just enter in $200 ($1,000-$800) in the corresponding box and the Template will use the equation ($200 + most recent historical year Inventory number) = projected year 1 inventory.Read the message to the right, then start at the bottom with dividends.Assets12/31/9912/31/9912/31/99Cash and Equivalents$0$0$0$0Historical Note: If your cash number appears too high or low, consult Chapter 8 of the textbook for more information. Also, compare your projected ratios to historical ratios. You may need to make adjustments to your recommendations and/or your projected statements. It is rare for any firm to have acceptal projected statements after the first attempt. Accounts ReceivableERROR:#DIV/0! Historical Note: Percent of revenues in the most recent year. Use a similar percent across all three projected years unless you believe the current assets to revenues percent will change drastically. Enter as percentInventoryERROR:#DIV/0!Other Current AssetsERROR:#DIV/0!Property Plant & Equipment$0 Historical Note: The values are for the most recent year reported. Enter in the net new (not cumulative) dollar amounts for each item for each forecasted year (Except for the Cash and Equivalents line). If you are purchasing $200 of Property, Plant & Equipment in Projected Year 1, simply enter $200 into the first projected year. If you plan to also reduce existing PP&E by $300, then you would enter in a negative $100 into Projected Year 1 (assuming you still plan to purchase the other $200). Take care with each line time, it is not how fast you get the numbers entered. Reread the hints in red writing a few lines above.Goodwill$0Intangibles$0Other Long-Term AssetsERROR:#DIV/0!Historical Note: Percent of revenues in the most recent year. Use a similar percent across all three projected years unless you believe the other long-term asets to revenues percent will change drastically. Enter as percentLiabilities12/31/9912/31/9912/31/99Accounts PayableERROR:#DIV/0!Historical Note: Percent of revenues in the most recent year. Use a similar percent across all three
  • 24. projected years unless you believe the current liabilities to revenues percent will change drastically. Enter as percent.Other Current LiabilitiesERROR:#DIV/0!Long-Term Debt$0Historical Note: The values are for the most recent year reported. Enter in the net new (not cumulative) dollar amounts for each item for each forecasted year. For example, if you do not plan to take on any additional long term debt in Projected Year 1, but do plan to pay off $1,000 in debt in Projected Year 1, enter in ($1,000) in Projected Year 1 long term debt column. Other Long-Term LiabilitiesERROR:#DIV/0!Historical Note: Percent of revenues in the most recent year. Use a similar percent across all three projected years unless you believe the other long-term liabilities to revenues percent will change drastically. Enter as percent.Equity12/31/9912/31/9912/31/99Common Stock0Historical Note: The values are for the most recent year reported. Enter in the new (additional, not cumulative) Dollar amounts for each Item for each forecasted year. If you change Treasury Stock, you may need to make an adjustment to Paid in Capital. Enter Treasury Stock as a negative number. Read over Chapter 8 of the David, David and David textbook.Treasury Stock0Paid in Capital & Other0Retained Earnings0000Historical Note: The Retained Earnings value is for the most recent year reported. The new additional (not cumulative) Retained Earnings are calculated automatically.Total Dividends to PaySTART HEREStart HERE. Enter the total dollar amount you wish to pay in dividends each forecasted year. If none, enter 0. This line is not cumulative, it does not add the value to any existing value for dividends. For example, if the firm paid $1,000 in dividends and you wish to stop dividend payments, enter $0 in projected year 1 box. If you wish to increase dividends by 10% enter $1,100 into projected year 1 box. Check on your own to see historically what the firm was paying. Preliminary Financial Data /xl/drawings/drawing2.xml#'PART%20II'!B2 Income Statement
  • 25. /xl/drawings/drawing2.xml#'Financial%20Statements'!B5 Balance Sheet /xl/drawings/drawing2.xml#'Financial%20Statements'!B18 Company Valuation /xl/drawings/drawing2.xml#'Company%20Valuation'!B3 Rival Firm Valuation /xl/drawings/drawing2.xml#'Company%20Valuation'!B14 Company Valuation /xl/drawings/drawing2.xml#'PART%20II'!B71 EPS/EBIT Analysis /xl/drawings/drawing2.xml#'PART%20II'!B107 Projected Financial Statements /xl/drawings/drawing2.xml#'PART%20II'!B139 HOME /xl/drawings/drawing2.xml#'PART%20II'!A2 Balance Sheet /xl/drawings/drawing2.xml#'Financial%20Statements'!B18 EPS/EBIT Analysis /xl/drawings/drawing2.xml#EPS_EBIT!C4 IFE IFE Matrix1 If data is missing here, recheck "Part I" 2Check to make sure your text is not cut off in the matrix. Double click (or drag) between the Cell Numbers.3To transfer into Word or Power Point, highlight the matrix, then paste special as "picture"StrengthsWeightRatingWeighted
  • 26. Score1Direct owner ship of 51% of stores0.0010.002Q2 2018 Same store sales increase 2% globally/4% in China, record profit 6B0.0020.003Pay employees well, above average pay, Stock options, Parental leave options0.0020.004Supply Chain Management (consistent quality in raw materials, and flow)0.0020.005Product Quality and consistency0.0020.006Ethical Business Values0.0020.007Brand Equity - Well known brand0.0010.008Operational efficiency, and solid Financial Performance - increasing profits (operating margin 6.5% vs industry avg of 5%)0.0010.009Customer loyalty programs, and chase visa rewards program (53% of us corp store sales)0.0030.0010Reinvestment Strategy, long term strategic planning - Multi-faceted strategic plan per region0.0010.00WeaknessesWeightRatingWeighted Score1EMEA Market, 11% decline in operating profits 20180.0010.002SBUX is highly dependent on the financial performance on North America (77% of profit)0.0000.003Higher prices than competition(38% higher)0.0000.004Products are not very distinct, other franchises have nearly identical products - McDonalds McCafé, Dunkin Donuts and a greater variety to draw in customers0.0000.005Product Recalls have had detrimental impact on the brand0.0000.006Issues with European taxes not being paid ( UK no taxes on 1.2B pounds in 2011- 2012)0.0000.007Product Standards - unhealthy products, Starbucks built brand on flavored and sweetened items, does not meet some cultural norms and are high calories, overdependence on coffee products0.0010.008Starbucks rely' s on foot traffic, not pandemic friendly0.0000.009volatile supply costs0.0000.0010Customer base is mid to upper calls wage earners0.0000.00Total IFE Score0.000.00 Return to Part I/xl/drawings/drawing3.xml#'PART%20I'!B26 EFE EFE Matrix1 If data is missing here, recheck "Part I" 2Check to make sure your text is not cut off in the matrix. Double click (or drag) between the Cell Numbers.3To transfer into Word or Power Point, highlight the matrix, then paste
  • 27. special as "picture"OpportunitiesWeightRatingWeighted Score1Premium Experience at Reserve stores with Princi, expand bar service, premium food options0.0430.10638297872Coffee subscription (Circle K- 200% increase in foot traffic, 70% increase if food sales, 90- 95%RenewAL RATE)0.0640.22695035463Diversification into more products beyond Coffee and Tea into more food products0.0620.11347517734Emerging markets - enter markets with limited competition, adapt to local markets - ex McDonalds in India does not sell beef, but has ventured into the vegetarian food market.0.0530.14893617025competitive pricing0.0430.10638297876Follow latest drink trends0.0630.19148936177steady forecast for revenue growth/consumption growth0.0610.05673758878Business partnerships and alliances (potentially responsible for sales by 1/3)0.0330.0851063839Faster Service - Corrective measures to fix long lines - more advanced Machines?0.0640.255319148910Self-service Machines0.0540.1985815603ThreatsWeightRatingWeighted Score1Dunkin Donuts 2nd in market shares in USA, and growing with coffee adjacent products0.0540.202McDonalds 2nd in market share globally0.0540.203Sales decline due to decline in customer traffic0.0630.194Brand Relevance - Business incidents (Unionization)0.0430.135evolving consumer preferences and tastes0.0630.176Cyber Security and Data Privacy0.0330.097Pandemic/Global Recession - temporary closed 2K stores in China, 50% of corp stores and 43% of licensed stores-lost 915M+ so far (June 2021)0.0630.178Increased costs to maintain supply chains, and raw material costs, and high 0.0440.149Competition from local favorite brands(incumbents) , EMEA has a different coffee culture0.0630.1910Executive Changeover - Chief Executive (Howard Shultz) retiring for the 3rd time0.0610.06Total EFE Score1.003.02 Return to Part I/xl/drawings/drawing4.xml#'PART%20I'!B68 Return to Part I/xl/drawings/drawing4.xml#'PART%20I'!B66
  • 28. CPMCPM Matrix1If data is missing here, recheck the "Part I" page.2Check to make sure your text is not cut off in the matrix. Double click (or drag) between the Cell Numbers.3To transfer into Word or Power Point, highlight the matrix, then paste special as "picture"Your FirmRivalRivalCritical Success Factors WeightRating ScoreRating Score Rating Score Advertising0.0000.0000.0000.00Domestic Market Penetration0.0000.0000.0000.00Customer Service0.0000.0000.0000.00Product Variety0.0000.0000.0000.00International Market Penetration 0.0000.0000.0000.00Employee Dedication0.0000.0000.0000.00Financial Profit0.0000.0000.0000.00Customer Loyalty0.0000.0000.0000.00Market Share0.0000.0000.0000.00Product Quality0.0000.0000.0000.00Top Management0.0000.0000.0000.00Price Competitiveness0.0000.0000.0000.00Totals0.000.000.000.00 Return to Part I/xl/drawings/drawing5.xml#'PART%20I'!D99 BCGBCG1If data is missing here, recheck the "Part I" page and read step 3.2Highlight the entire matrix (not just the inside box), and then paste as paste special picture.3If you do not see your circle, either you did not enter in the information or you entered a number for the "Top Firm in the Industry Revenues" smaller than your firm. This number can only be larger or the same (if your firm's division is the largest revenue generator in the industry). It is also possible your bubble is behind another bubble if the information was close to the same, this is unlikely however.Please Scroll down for the BCG Matrix and Table Relative Market Share PositionHigh 1.0Low 0.0Industry Sales Growth RateHigh 0.20Low -0.20DivisionYour Firm's Division RevenuesTop Firm in Industry Division RevenuesIndustry Sales Growth Rate Relative Market Share PositionHandcrafted beverages $18$180.201.00Food$5$230.200.22Other (merchandise, grab-and- go)$1$10.051.000$0$00.00NA0$0$00.00NA
  • 29. Handcrafted beverages 1 0.2 18.2 Food 0.22241379310344828 0.2 5.16 Other (merchandise, grab- and-go) 1 0.05 1.24 NA NA Handcrafted beverages 1 0.2 18.2 Question Marks Stars Cash Cows Dogs s Return to Part I/xl/drawings/drawing6.xml#'PART%20I'!D132 Return to Part I/xl/drawings/drawing6.xml#'PART%20I'!B144 IEIE1If data is missing here, recheck the "Part I" page and read
  • 30. step 3.2Highlight the entire matrix (not just the inside box), and then paste as paste special picture.3If you do not see your circle, either you did not enter in the corresponding EFE or IFE information. It is also possible your bubble is behind another bubble if the EFE and IFE information was close to the same.Scroll down for IE Matrix and Table THE IFE TOTAL WEIGHTED SCORESStrongWeak 4.01.0High4.0THE EFE WEIGHTED SCORESLow1.0Division Firm's Division RevenuesEstimated IFE ScoreEstimated EFE ScoreAmerica$15,6523.23.5CAP$3,2403.03.0EMEA$1,0142.01. 2Channel Development$2,0092.52.8All other segments$4721.82.0 0 3.0212765957446805 1 America 3.2 3.5 15652 CAP 3 3 3240 EMEA 2 1.2 1014 Channel Development 2.5 2.8 2009 All other segments 1.8 2 472 Return to Part I/xl/drawings/drawing8.xml#'PART%20I'!B171 SPACESPACE1If data is missing here, recheck the "Part I" page and read step 3.2Highlight the entire matrix (not just the inside box), and then paste as paste special picture. Be sure to also include the table below the chart also in your presentation.3If you do not see your bubble either you did not enter in the information or, it is also possible your bubble is
  • 31. behind another bubble if the X and Y information were close to the same.0MCDonaldsMaxwell HouseX Axis3.25.0-2.0Y Axis2.44.01.0Internal Analysis: External Analysis:Financial Position (FP)Stability Position (SP)Current Ratio4Rate of Inflation-5Debt to Equity7Technological Changes-5Net Income6Price Elasticity of Demand-3Revenue7Competitive Pressure-4Inventory Turnover7Barriers to Entry into Market- 2Financial Position (FP) Average 6.2Stability Position (SP) Average-3.8Internal Analysis: External Analysis:Competitive Position (CP)Industry Position (IP)Market Share-1Growth Potential6Product Quality-4Financial Stability7Customer Loyalty-2Ease of Entry into Market4Variety of Products Offered-6Resource Utilization6Control over Suppliers and Distributors-1Profit Potential7Competitive Position (CP) Average-2.8Industry Position (IP) Average6.0 Return to Part I/xl/drawings/drawing10.xml#'PART%20I'!B1823.2 2.4000000000000004 1 MCDonalds 5 4 1 Maxwell House -2 1 1 FP SP CP IP IPIP Defensive Conservative Aggressive
  • 32. Competitive GRANDGRAND1 If data is missing here, recheck the "Part I" page and read Step 3.2Highlight the entire matrix (not just the inside box), and then paste as paste special picture.3If you do not see your circle, either you did not enter in the corresponding information or it is also possible your bubble is behind another bubble if the axis information was close to the same. Return to Part I/xl/drawings/drawing11.xml#'PART%20I'!B2991 1 1 1 1 1 Quadrant II Quadrant I Quadrant III I Quadrant IV Rapid Market Growth Slow Market Growth Strong Competitive Position Weak Competitive Position Perceptual MapPerceptual Maps1If data is missing here, recheck the "Part I" page and read Step 3.2Highlight the entire matrix (not just the inside box), and then paste as paste special picture.3If you do not see your circle, either you did not enter in the corresponding information or it is also possible your bubble is behind another bubble if the axis information was close to the same.0000 1 1 1 1 1 1 1 1 1 1 Return to Part I/xl/drawings/drawing12.xml#'PART%20I'!B256 Financial Statements1Complete Part II to Construct the Financial Statements. Income Statement12/31/9912/31/99Percent ChangeRevenue
  • 33. (Sales)$0$0NANACost of Goods Sold00NANAGross Profit00NANAOperating Expenses00NANAEBIT (Operating Income)00NANAInterest Expense00NANAEBT00NANATax00NANANon-Recurring Events00NANANet Income00NANABalance Sheet12/31/9912/31/99Percent ChangeAssetsCash and Short Term Investments$0$0NANAAccounts Receivable00NANAInventory00NANAOther Current Assets00NANATotal Current Assets00NANAProperty Plant & Equipment00NANAGoodwill00NANAIntangibles00NANAOther Long-Term Assets00NANATotal Assets00NANALiabilitiesAccounts Payable00NANAOther Current Liabilities00NANATotal Current Liabilities00NANALong-Term Debt00NANAOther Long-Term Liabilities00NANATotal Liabilities00NANAEquityCommon Stock00NANARetained Earnings00NANATreasury Stock00NANAPaid in Capital & Other00NANATotal Equity00NANATotal Liabilities and Equity00NANA Return to Part II/xl/drawings/drawing14.xml#'PART%20II'!B2 SWOTSWOTSO Strategies1Supply Chain Management - Starbucks has a great SCM Story, they can us this to take advantage of shortfall in the shipping logistics arena (S4)2Starbucks Equity/Loyalty Programs - Starbucks can use their brand value/loyalty programs to enter into partnerships with other companies (S9,O1)3Starbucks solid financials - This offers Starbucks the opportunity and flexibility to take risks in some product introductions and markets (S1,S2,03,04)4Solid Reinvestment strategy - This allows Starbucks to plan expansion over a multi-year time period without major concerns about short revenue(S8,O7)ST Strategies1Product Quality and Consistency - Maintaining a standard of quality helps Starbucks as customers come to expect and receive the same quality consistently. When going to local shops or smaller coffee chains this is not the case as they have a harder time controlling quality because they cannot manage the supply chain as well. (S5,T1,T2,T9)2Employee compensation - Maintaining better
  • 34. than average pay and benefits allows Starbucks to retain quality employees ( S6,S3,T3)3Direct Ownership on 51% if stores - Allows Starbucks company stores to set high standard that franchisees need to follow. (S1,T1,T2,T7)4Ethical Business Practices - Makes customers secure that the are not being mislead, and that they are doing better for others and this attracts customers. (S6,T9)WO Strategies1Weak overseas markets - Starbucks needs t o access what those local markets require terms of coffee/teas and other drinks to integrate better to those markets. European coffee shops are about atmosphere and not the factory approach taken in North America. (W1,W2,O4)2Health Standard - Starbucks needs to introduce healthier product offerings to compete in other markets. (W7,O6)3Product variety - Starbucks can expand more into breakfast and lunch food market (W4,O3,O4)4Starbucks Time of day offerings - Starbucks has peak business hours at the beginning of the work day, and around break times. They need to offer products that can draw customers at other times of the day. (W8,O9,O10)WT Strategies1Expensive products - expand customer base by adding some cheaper product offerings (W3, T5,T8)2Relys on foot traffic - Partner with catering companies and deilvery services to offer offiste starbucks offering. Offer a catered starbucks barista station for events (W8,T3,T5)3Supply Chain Management - better control the SCM and logistics aspects to control direct costs and well as direct costs. (W9,T8)4Product offerings - Include more seasonal offerings to attract a different set of customers, with foods and coffee's (W4,T1) Return to Part I/xl/drawings/drawing15.xml#'PART%20I'!B296 QSPMQSPM1If data is missing here, recheck the "Part I" page. 3Check to make sure your text is not cut off in the matrix. Double click (or drag) between the Cell Numbers.00StrengthsWeightASTASAS TAS 1Direct owner ship of 51% of stores0.0000.0000.002Q2 2018 Same store sales increase 2% globally/4% in China, record profit 6B0.0000.0000.003Pay employees well, above average pay,
  • 35. Stock options, Parental leave options0.0000.0000.004Supply Chain Management (consistent quality in raw materials, and flow)0.0000.0000.005Product Quality and consistency0.0000.0000.006Ethical Business Values0.0000.0000.007Brand Equity - Well known brand0.0000.0000.008Operational efficiency, and solid Financial Performance - increasing profits (operating margin 6.5% vs industry avg of 5%)0.0000.0000.009Customer loyalty programs, and chase visa rewards program (53% of us corp store sales)0.0000.0000.0010Reinvestment Strategy, long term strategic planning - Multi-faceted strategic plan per region0.0000.0000.0000WeaknessesWeightASTASAS TAS 1EMEA Market, 11% decline in operating profits 20180.0000.0000.002SBUX is highly dependent on the financial performance on North America (77% of profit)0.0000.0000.003Higher prices than competition(38% higher)0.0000.0000.004Products are not very distinct, other franchises have nearly identical products - McDonalds McCafé, Dunkin Donuts and a greater variety to draw in customers0.0000.0000.005Product Recalls have had detrimental impact on the brand0.0000.0000.006Issues with European taxes not being paid ( UK no taxes on 1.2B pounds in 2011- 2012)0.0000.0000.007Product Standards - unhealthy products, Starbucks built brand on flavored and sweetened items, does not meet some cultural norms and are high calories, overdependence on coffee products0.0000.0000.008Starbucks rely' s on foot traffic, not pandemic friendly0.0000.0000.009volatile supply costs0.0000.0000.0010Customer base is mid to upper calls wage earners0.0000.0000.0000OpportunitiesWeightASTASAS TAS 1Premium Experience at Reserve stores with Princi, expand bar service, premium food options0.0400.0000.002Coffee subscription (Circle K- 200% increase in foot traffic, 70% increase if food sales, 90-95%RenewAL RATE)0.0600.0000.003Diversification into more products beyond Coffee and Tea into more food products0.0600.0000.004Emerging markets - enter markets with
  • 36. limited competition, adapt to local markets - ex McDonalds in India does not sell beef, but has ventured into the vegetarian food market.0.0500.0000.005competitive pricing0.0400.0000.006Follow latest drink trends0.0600.0000.007steady forecast for revenue growth/consumption growth0.0600.0000.008Business partnerships and alliances (potentially responsible for sales by 1/3)0.0300.0000.009Faster Service - Corrective measures to fix long lines - more advanced Machines?0.0600.0000.0010Self- service Machines0.0500.0000.0000ThreatsWeightASTASAS TAS 1Dunkin Donuts 2nd in market shares in USA, and growing with coffee adjacent products0.0500.0000.002McDonalds 2nd in market share globally0.0500.0000.003Sales decline due to decline in customer traffic0.0600.0000.004Brand Relevance - Business incidents (Unionization)0.0400.0000.005evolving consumer preferences and tastes0.0600.0000.006Cyber Security and Data Privacy0.0300.0000.007Pandemic/Global Recession - temporary closed 2K stores in China, 50% of corp stores and 43% of licensed stores-lost 915M+ so far (June 2021)0.0600.0000.008Increased costs to maintain supply chains, and raw material costs, and high 0.0400.0000.009Competition from local favorite brands(incumbents) , EMEA has a different coffee culture0.0600.0000.0010Executive Changeover - Chief Executive (Howard Shultz) retiring for the 3rd time0.0600.0000.00TOTALS0.000.00 Return to Part I/xl/drawings/drawing16.xml#'PART%20I'!B317 Company Valuation1Complete Part II to Construct the Company Valuation 0Stockholders' Equity - (Goodwill + Intangibles)$0Net Income x 5$0(Share Price/EPS) x Net IncomeERROR:#DIV/0!Number of Shares Outstanding x Share Price$0Method AverageERROR:#DIV/0!Rival Firm's NameStockholders' Equity - (Goodwill + Intangibles)$0Net Income x 5$0(Share Price/EPS) x Net IncomeERROR:#DIV/0!Number of Shares Outstanding x Share Price$0Method AverageERROR:#DIV/0!
  • 37. Return to Part II /xl/drawings/drawing17.xml#'PART%20II'!B71 EPS_EBIT1Complete Part II to Construct the EPS/EBIT Charts Common Stock FinancingDebt FinancingPessimisticRealisticOptimisticPessimisticRealisticOpt imisticEBIT$0$0$0$0$0$0Interest 000000EBT000000Taxes000000EAT000000# SharesERROR:#DIV/0!ERROR:#DIV/0!ERROR:#DIV/0!000EP SERROR:#DIV/0!ERROR:#DIV/0!ERROR:#DIV/0!ERROR:#DI V/0!ERROR:#DIV/0!ERROR:#DIV/0!Amount Needed$0Interest Rate0% Stock0%Debt0%Tax Rate0%PessimisticRealisticOptimistic# Shares Outstanding0.0EBIT$0$0$0Additional Shares Outstanding NeededNAInterest 000Stock Price$0.00EBT000Taxes000EAT000# SharesERROR:#DIV/0!ERROR:#DIV/0!ERROR:#DIV/0!EPSER ROR:#DIV/0!ERROR:#DIV/0!ERROR:#DIV/0! Common Stock Financing0 0 0 0 0 0 Debt Financing 0 0 0 0 0 0 Return to Part II/xl/drawings/drawing18.xml#'PART%20II'!B107 Retained Earnings TableComplete Part II to Construct the RE TableDividend InformationBalance Sheet InformationSteps12345YearCurrent Year's Net IncomeLess Current Year's Dividends PaidNew REPlus Prior Year's RECurrent Year's Balance Sheet RE12/31/99$0$0$0$0$012/31/99$0$0$0$0$012/31/99$0$0$0$0 $0 Projected Statements1Complete Part II to Construct the Projected Financial Statements.Projected Income Statement12/31/9912/31/9912/31/99Revenues (Sales)$0$0$0Cost of Goods Sold000Gross Profit000Operating Expenses (Operating Income)000EBIT000Interest Expense000EBT000Tax000Non-Recurring Events000Net Income000Projected Balance
  • 38. Sheet12/31/9912/31/9912/31/99AssetsCash and Equivalents$0$0$0Accounts Receivable000Inventory000Other Current Assets000Total Current Assets000Property Plant & Equipment000Goodwill000Intangibles000Other Long-Term Assets000Total Assets000LiabilitiesAccounts Payable000Other Current Liabilities000Total Current Liabilities000Long-Term Debt000Other Long-Term Liabilities000Total Liabilities000EquityCommon Stock000Retained Earnings000Treasury Stock000Paid in Capital & Other000Total Equity000Total Liabilities and Equity000 Return to Part II /xl/drawings/drawing19.xml#'PART%20II'!B139 Ratios1Complete Part II to Construct the Ratios Historical RatiosProjected Ratios12/31/9912/31/9912/31/9912/31/9912/31/99Current RatioERROR:#DIV/0!ERROR:#DIV/0!Current RatioERROR:#DIV/0!ERROR:#DIV/0!ERROR:#DIV/0!Quick RatioERROR:#DIV/0!ERROR:#DIV/0!Quick RatioERROR:#DIV/0!ERROR:#DIV/0!ERROR:#DIV/0!Total Debt-to-Total-Assets RatioERROR:#DIV/0!ERROR:#DIV/0!Debt-to-Total-Assets RatioERROR:#DIV/0!ERROR:#DIV/0!ERROR:#DIV/0!Total Debt-to-Equity RatioERROR:#DIV/0!ERROR:#DIV/0!Debt-to- Equity RatioERROR:#DIV/0!ERROR:#DIV/0!ERROR:#DIV/0!Times- Interest-Earned RatioNANATimes-Interest-Earned RatioNANANAInventory TurnoverERROR:#DIV/0!ERROR:#DIV/0!Inventory TurnoverERROR:#DIV/0!ERROR:#DIV/0!ERROR:#DIV/0!Fixe d Assets TurnoverERROR:#DIV/0!ERROR:#DIV/0!Fixed Assets TurnoverERROR:#DIV/0!ERROR:#DIV/0!ERROR:#DIV/0!Tota l Assets TurnoverNANATotal Assets TurnoverERROR:#DIV/0!ERROR:#DIV/0!ERROR:#DIV/0!Acc ounts Receivable TurnoverNANAAccounts Receivable TurnoverNANANAAverage Collection
  • 39. PeriodERROR:#DIV/0!ERROR:#DIV/0!Average Collection PeriodERROR:#DIV/0!ERROR:#DIV/0!ERROR:#DIV/0!Gross Profit Margin %ERROR:#DIV/0!ERROR:#DIV/0!Gross Profit Margin %ERROR:#DIV/0!ERROR:#DIV/0!ERROR:#DIV/0!Operating Profit Margin %ERROR:#DIV/0!ERROR:#DIV/0!Operating Profit Margin %ERROR:#DIV/0!ERROR:#DIV/0!ERROR:#DIV/0!ROA %ERROR:#DIV/0!ERROR:#DIV/0!ROA %ERROR:#DIV/0!ERROR:#DIV/0!ERROR:#DIV/0!ROE %ERROR:#DIV/0!ERROR:#DIV/0!ROE %ERROR:#DIV/0!ERROR:#DIV/0!ERROR:#DIV/0! Return to Part II /xl/drawings/drawing20.xml#'PART%20II'!A1 Johns Hopkins Nursing Evidence-Based Practice Appendix D Evidence Level and Quality Guide © 2017 The Johns Hopkins Hospital/ Johns Hopkins University School of Nursing Evidence Levels Quality Ratings Level I Experimental study, randomized controlled trial (RCT) Explanatory mixed method design that includes only a level I quaNtitative study Systematic review of RCTs, with or without meta-
  • 40. analysis QuaNtitative Studies A High quality: Consistent, generalizable results; sufficient sample size for the study design; adequate control; definitive conclusions; consistent recommendations based on comprehensive literature review that includes thorough reference to scientific evidence. B Good quality: Reasonably consistent results; sufficient sample size for the study design; some control, fairly definitive conclusions; reasonably consistent recommendations based on fairly comprehensive literature review that includes some reference to scientific evidence. C Low quality or major flaws: Little evidence with inconsistent results; insufficient sample size for the study design; conclusions cannot be drawn. QuaLitative Studies No commonly agreed-on principles exist for judging the quality of quaLitative studies. It is a subjective process based on the extent to which study data contributes to synthesis and how much information is known about the researchers’ efforts to meet the appraisal criteria. For meta-synthesis, there is preliminary agreement that quality assessments of individual studies should be made before synthesis to screen out poor-quality studies1. A/B High/Good quality is used for single studies and meta- syntheses2. The report discusses efforts to enhance or evaluate the quality of the data and the overall inquiry in sufficient detail; and it describes the specific techniques used to
  • 41. enhance the quality of the inquiry. Evidence of some or all of the following is found in the report: • Transparency: Describes how information was documented to justify decisions, how data were reviewed by others, and how themes and categories were formulated. • Diligence: Reads and rereads data to check interpretations; seeks opportunity to find multiple sources to corroborate evidence. • Verification: The process of checking, confirming, and ensuring methodologic coherence. • Self-reflection and scrutiny: Being continuously aware of how a researcher’s experiences, background, or prejudices might shape and bias analysis and interpretations. • Participant-driven inquiry: Participants shape the scope and breadth of questions; analysis and interpretation give voice to those who participated. • Insightful interpretation: Data and knowledge are linked in meaningful ways to relevant literature. C Low quality studies contribute little to the overall review of findings and have few, if any, of the features listed for high/good quality. Level II Quasi-experimental study Explanatory mixed method design that includes only a level II quaNtitative study Systematic review of a combination of RCTs and
  • 42. quasi-experimental studies, or quasi- experimental studies only, with or without meta- analysis Level III Nonexperimental study Systematic review of a combination of RCTs, quasi-experimental and nonexperimental studies, or nonexperimental studies only, with or without meta-analysis Exploratory, convergent, or multiphasic mixed methods studies Explanatory mixed method design that includes only a level III quaNtitative study QuaLitative study Meta-synthesis Johns Hopkins Nursing Evidence-Based Practice Appendix D Evidence Level and Quality Guide © 2017 The Johns Hopkins Hospital/ Johns Hopkins University School of Nursing 1 https://www.york.ac.uk/crd/SysRev/!SSL!/WebHelp/6_4_ASSE SSMENT_OF_QUALITATIVE_RESEARCH.htm
  • 43. 2 Adapted from Polit & Beck (2017). Evidence Levels Quality Ratings Level IV Opinion of respected authorities and/or nationally recognized expert committees or consensus panels based on scientific evidence Includes: • Clinical practice guidelines • Consensus panels/position statements A High quality: Material officially sponsored by a professional, public, or private organization or a government agency; documentation of a systematic literature search strategy; consistent results with sufficient numbers of well-designed studies; criteria-based evaluation of overall scientific strength and quality of included studies and definitive conclusions; national expertise clearly evident; developed or revised within the past five years B Good quality: Material officially sponsored by a professional, public, or private organization or a government agency; reasonably thorough and appropriate systematic literature search strategy; reasonably consistent results, sufficient numbers of well-designed studies; evaluation of strengths and limitations of included studies with fairly definitive conclusions; national expertise clearly evident; developed or revised within the past five years C Low quality or major flaws: Material not sponsored by an official organization or agency; undefined, poorly
  • 44. defined, or limited literature search strategy; no evaluation of strengths and limitations of included studies, insufficient evidence with inconsistent results, conclusions cannot be drawn; not revised within the past five years Level V Based on experiential and nonresearch evidence Includes: • Integrative reviews • Literature reviews • Quality improvement, program, or financial evaluation • Case reports • Opinion of nationally recognized expert(s) based on experiential evidence Organizational Experience (quality improvement, program or financial evaluation) A High quality: Clear aims and objectives; consistent results across multiple settings; formal quality improvement, financial, or program evaluation methods used; definitive conclusions; consistent recommendations with thorough reference to scientific evidence B Good quality: Clear aims and objectives; consistent results in a single setting; formal quality improvement, financial, or program evaluation methods used; reasonably consistent recommendations with some reference to scientific evidence C Low quality or major flaws: Unclear or missing aims and objectives; inconsistent results; poorly defined quality improvement, financial, or program evaluation methods; recommendations cannot be made
  • 45. Integrative Review, Literature Review, Expert Opinion, Case Report, Community Standard, Clinician Experience, Consumer Preference A High quality: Expertise is clearly evident; draws definitive conclusions; provides scientific rationale; thought leader(s) in the field B Good quality: Expertise appears to be credible; draws fairly definitive conclusions; provides logical argument for opinions C Low quality or major flaws: Expertise is not discernable or is dubious; conclusions cannot be drawn http://www.york.ac.uk/crd/SysRev/!SSL!/WebHelp/6_4_ASSES SMENT_OF_QUALITATIVE_RESEARCH.htm http://www.york.ac.uk/crd/SysRev/!SSL!/WebHelp/6_4_ASSES SMENT_OF_QUALITATIVE_RESEARCH.htm Johns Hopkins Nursing Evidence-Based Practice Appendix D Evidence Level and Quality Guide © 2017 The Johns Hopkins Hospital/ Johns Hopkins University School of Nursing Evidence Levels Quality Ratings Level I
  • 46. Experimental study, randomized controlled trial (RCT) Explanatory mixed method design that includes only a level I quaNtitative study Systematic review of RCTs, with or without meta- analysis QuaNtitative Studies A High quality: Consistent, generalizable results; sufficient sample size for the study design; adequate control; definitive conclusions; consistent recommendations based on comprehensive literature review that includes thorough reference to scientific evidence. B Good quality: Reasonably consistent results; sufficient sample size for the study design; some control, fairly definitive conclusions; reasonably consistent recommendations based on fairly comprehensive literature review that includes some reference to scientific evidence. C Low quality or major flaws: Little evidence with inconsistent results; insufficient sample size for the study design; conclusions cannot be drawn. QuaLitative Studies No commonly agreed-on principles exist for judging the quality of quaLitative studies. It is a subjective process based on the extent to which study data contributes to synthesis and how much information is known about the researchers’ efforts to meet the appraisal criteria. For meta-synthesis, there is preliminary agreement that quality assessments of individual studies should be
  • 47. made before synthesis to screen out poor-quality studies1. A/B High/Good quality is used for single studies and meta- syntheses2. The report discusses efforts to enhance or evaluate the quality of the data and the overall inquiry in sufficient detail; and it describes the specific techniques used to enhance the quality of the inquiry. Evidence of some or all of the following is found in the report: • Transparency: Describes how information was documented to justify decisions, how data were reviewed by others, and how themes and categories were formulated. • Diligence: Reads and rereads data to check interpretations; seeks opportunity to find multiple sources to corroborate evidence. • Verification: The process of checking, confirming, and ensuring methodologic coherence. • Self-reflection and scrutiny: Being continuously aware of how a researcher’s experiences, background, or prejudices might shape and bias analysis and interpretations. • Participant-driven inquiry: Participants shape the scope and breadth of questions; analysis and interpretation give voice to those who participated. • Insightful interpretation: Data and knowledge are linked in meaningful ways to relevant literature. C Low quality studies contribute little to the overall review of findings and have few, if any, of the features listed for high/good quality.
  • 48. Level II Quasi-experimental study Explanatory mixed method design that includes only a level II quaNtitative study Systematic review of a combination of RCTs and quasi-experimental studies, or quasi- experimental studies only, with or without meta- analysis Level III Nonexperimental study Systematic review of a combination of RCTs, quasi-experimental and nonexperimental studies, or nonexperimental studies only, with or without meta-analysis Exploratory, convergent, or multiphasic mixed methods studies Explanatory mixed method design that includes only a level III quaNtitative study QuaLitative study Meta-synthesis Johns Hopkins Nursing Evidence-Based Practice Appendix D Evidence Level and Quality Guide
  • 49. © 2017 The Johns Hopkins Hospital/ Johns Hopkins University School of Nursing 1 https://www.york.ac.uk/crd/SysRev/!SSL!/WebHelp/6_4_ASSE SSMENT_OF_QUALITATIVE_RESEARCH.htm 2 Adapted from Polit & Beck (2017). Evidence Levels Quality Ratings Level IV Opinion of respected authorities and/or nationally recognized expert committees or consensus panels based on scientific evidence Includes: • Clinical practice guidelines • Consensus panels/position statements A High quality: Material officially sponsored by a professional, public, or private organization or a government agency; documentation of a systematic literature search strategy; consistent results with sufficient numbers of well-designed studies; criteria-based evaluation of overall scientific strength and quality of included studies and definitive conclusions; national expertise clearly evident; developed or revised within the past five years B Good quality: Material officially sponsored by a professional, public, or private organization or a government agency; reasonably thorough and appropriate systematic literature search strategy; reasonably consistent results, sufficient numbers of well-designed studies; evaluation
  • 50. of strengths and limitations of included studies with fairly definitive conclusions; national expertise clearly evident; developed or revised within the past five years C Low quality or major flaws: Material not sponsored by an official organization or agency; undefined, poorly defined, or limited literature search strategy; no evaluation of strengths and limitations of included studies, insufficient evidence with inconsistent results, conclusions cannot be drawn; not revised within the past five years Level V Based on experiential and nonresearch evidence Includes: • Integrative reviews • Literature reviews • Quality improvement, program, or financial evaluation • Case reports • Opinion of nationally recognized expert(s) based on experiential evidence Organizational Experience (quality improvement, program or financial evaluation) A High quality: Clear aims and objectives; consistent results across multiple settings; formal quality improvement, financial, or program evaluation methods used; definitive conclusions; consistent recommendations with thorough reference to scientific evidence B Good quality: Clear aims and objectives; consistent results in a single setting; formal quality improvement, financial, or program evaluation methods used; reasonably consistent recommendations with some reference to
  • 51. scientific evidence C Low quality or major flaws: Unclear or missing aims and objectives; inconsistent results; poorly defined quality improvement, financial, or program evaluation methods; recommendations cannot be made Integrative Review, Literature Review, Expert Opinion, Case Report, Community Standard, Clinician Experience, Consumer Preference A High quality: Expertise is clearly evident; draws definitive conclusions; provides scientific rationale; thought leader(s) in the field B Good quality: Expertise appears to be credible; draws fairly definitive conclusions; provides logical argument for opinions C Low quality or major flaws: Expertise is not discernable or is dubious; conclusions cannot be drawn http://www.york.ac.uk/crd/SysRev/!SSL!/WebHelp/6_4_ASSES SMENT_OF_QUALITATIVE_RESEARCH.htm http://www.york.ac.uk/crd/SysRev/!SSL!/WebHelp/6_4_ASSES SMENT_OF_QUALITATIVE_RESEARCH.htm RUBRIC FOR WEEK 4 Quantitative Critique Rubric:5.25.20 Quantitative Critique Rubric:5.25.20 Criteria Ratings Pts This criterion is linked to a Learning OutcomeIntent of the
  • 52. research: is the title clear? 1 pts This criterion is linked to a Learning OutcomeWhat is the RQ if stated? What is the hypothesis if stated? (3) What are the issues or variables being studied? What are the IV and DV variables? (3) 6 pts This criterion is linked to a Learning OutcomeSignificance of the study: How is the research problem significant to nursing, How will the findings improve practice (5 points) 5 pts This criterion is linked to a Learning OutcomeMethods: What is the study design? Describe. Was this appropriate? (5) What is the level of evidence in this research? Describe the model used to evaluate level of research. (3) 8 pts This criterion is linked to a Learning OutcomeWas the sample randomized or not randomized? (3) Was the process of sample selection addressed? Was the sample size adequate? Was a power analysis done? (3) What evidence was provided that biases were eliminated or minimized? What steps were taken to control confounding participant characteristics that could affect the equivalence of groups being compared? Were these steps adequate? (6) 12 pts This criterion is linked to a Learning OutcomeMethods: What were the inclusion and exclusion criteria? (3) Describe the instrument used- was it reliable/valid? Is this addressed? (3) 6 pts This criterion is linked to a Learning OutcomeProcedures:
  • 53. Describe how the data was collected. Was it consistent? (3) Was the DV always obtained in the same manner? (3) 6 pts This criterion is linked to a Learning OutcomeAnalysis: What type of analysis was done? Identify the statistics used- appropriate for level of measurement? All assumptions met? (5) Was analysis appropriate for the design/methods used? Was rational provided for the use of statistical tests? (3) 8 pts This criterion is linked to a Learning OutcomeWere the relevant sample demographics described? (3) Were they used to answer RQ when inferential statistics would have been more appropriate? (3) What were the results of the study? (3) Were any results significant? What do the tests tell about the RQ or hypotheses? (3) Were any tests non-significant? Is it plausible that these reflect a Type II error? (3) What factors might have undermined the study’s statistical conclusion validity? (3) 18 pts This criterion is linked to a Learning OutcomeWas an appropriate amount of statistical information reported? Are the findings clearly and logically organized? (3) Were tables or figures used to summarize large amounts of statistical information? (3) 6 pts This criterion is linked to a Learning OutcomeResults and interpretation: What was the researcher's interpretation of the results? Do the results make sense? (3) Did the researcher draw reasonable conclusions? (3) 6 pts This criterion is linked to a Learning OutcomeDo the researchers discuss the limitations of the study and their
  • 54. possible effects on the credibility of the research? (3) Did the researchers discuss the generalizability of the results? (3) Did the researchers discuss the implications for clinical practice? (3) 9 pts This criterion is linked to a Learning OutcomeWhat is your interpretation of the results? (3) How would you improve upon this study if you were to conduct a similar study? (3) 6 pts This criterion is linked to a Learning OutcomeCan the study results make an important contribution? (3) 3 pts Total Points: 100 D ow nloaded from https://journals-lw w -com .proxy1.nku.edu/jaanp by BhD M f5ePH
  • 56. Q == on 04/29/2020 Downloadedfromhttps://journals-lww- com.proxy1.nku.edu/jaanpbyBhDMf5ePHKav1zEoum1tQfN4a+ kJLhEZkD2PQTEnA3Z5k45NO+rAW97pzNDe/ZLwaQvBaymkd fkXhckmSxLPMFzBMQPVR81VLrL7Sp4WmX/97IK1XYfd82h EzjiGc40YtwbuZ0LX/gn7cEN9wgdyNQ==on04/29/2020 Results and implications from a gender minority health education module for advance practice nursing students Ralph J. Klotzbaugh, PhD (Assistant Professor)1, Suha Ballout, RN, PhD (PhDAssistant Professor)2, & Gale Spencer, RN, PhD (Distinguished Teaching Professor)3 ABSTRACT Nursing literature has recognized deficits in lesbian, gay, bisexual, transgender, queer-specific care. Of particular concern is lack of knowledge about genderminorities. Lack of knowledge remains despite this populations’ increased health disparities. This pilot study investigates pre- and post- knowledge of medical guidelines, disparities, policies, and attitudes specific to gender minorities among advanced practice nursing students attending a gender minority health module. All participants in this pilot study completed a questionnaire on content and a transphobia scale to evaluate its effect on attitudes. Students were also surveyed on previous experience with gender minority patients. Students indicated sex and gender identity as female, with a mean age of 33.5 years. Twenty-seven percent of the students reported experience with gender minority patients. Wilcoxon signed rank test indicated statistically sig-
  • 57. nificant improvement in knowledge and improved scores on transphobia. This study demonstrated a module on the health of gender minorities is an effective method for increasing student knowledge of gender minority health care. Keywords: Advance practice education; cultural competency; gender minority; transgender. Journal of the American Association of Nurse Practitioners 32 (2020) 332–338, © 2019 American Association of Nurse Practitioners DOI# 10.1097/JXX.0000000000000249 Background Nursing literature has recognized deficits in knowledge of lesbian, gay, bisexual, transgender, queer (LGBTQ)- specific care needs and considerations among nursing students, educators, and care providers (Cornelius, Enweana, Alston, & Baldwin, 2017; Lim, Johnson, & Eliason, 2015). In their study on perspectives of provider behaviors among LGBTQ-identified clients, Rounds, Mcgrath, and Walsh (2013) determined that although antidiscrimina- tion laws have gradually improved attitudes and accep- tance of LGBTQ individuals, knowledge related to the LGBTQhealth needs continues to be lacking. This deficit is particularly true of point-of-care providers, such as physicians and nurse practitioners (Rounds et al., 2013; Yingling, Cotler, & Hughes, 2017). Of particular concern is lack of knowledge specific to transgender and gender nonconforming populations. In their study of advanced practice nurses’ knowledge and attitudes on caring for transgender and gender nonconforming clients, Paradiso and Lally (2018) found that all participants agreed that both personal and professional deficits in knowledge can nega- tively affect patient care. Participants also acknowledged
  • 58. that improvement in advanced practice nursing curriculum specific to the needs of genderminority health is necessary. In fact, both the Institute of Medicine (2011) and the U.S. Department of Health and Human Services (2016) have called for prioritization in addressing gender minority health disparities. Both institutions have cited lack of training in gender minority health among health care pro- viders as a critical barrier to health care delivery and well- ness for this population. Lack of competent, knowledgeable providers have accounted for gender minorities avoiding health care services altogether. This avoidance contributes to ongoing health care disparities and associated negative health outcomes faced by gender minority populations. In the interest of appropriate terminology and mean- ing, transgender and gender nonconforming people are those whose gender identity differs from the sex on their birth certificate. This might include those who have made or are making the transition from one gender identity to the other. It might also include those who are questioning their gender identity, those who identify with more than one gender, or those who express their gender in ways that might not typically be associated with that sex. 1College of Nursing, University of New Mexico, Albuquerque, New Mexico, 2Department of Nursing, College of Nursing and Health Sciences, University of Massachusetts, Boston, Massachusetts, 3Decker School of Nursing, Binghamton University, State University of New York, Binghamton, New York Correspondence: Ralph J. Klotzbaugh, PhD, College of Nursing, University of New Mexico, MSCO7 4380 Box 9, Albuquerque, NM 87131. Tel: 505272 0733; 607 761 1800; Fax: 505.272.9345; E-mail:
  • 59. [email protected] salud.unm.edu Received: 10 January 2019; revised: 22 April 2019; accepted 24 April 2019 332 April 2020 · Volume 32 · Number 4 Journal of the American Association of Nurse Practitioners Education © 2019 American Association of Nurse Practitioners. Unauthorized reproduction of this article is prohibited. Although there are a number of acceptable terms for this group of individuals, the term gender minority (minori- ties) will be used throughout in the interest of consistency and inclusion. Lack of knowledge among medical professionals remains despite gender minorities’ increased health dis- parities related to risk behaviors, chronic health complica- tions, social factors, and access to quality health care. Risk behaviors and chronic health complications are related to much higher rates of substance abuse, HIV, and other sex- ually transmitted infections, as well as psychological dis- tress and attempted suicide. The 2015 US Transgender Survey showed rates of HIV among gender minority pop- ulations as nearly five times greater than in the general US population. In addition, attempted suicide rates among gender minorities are nearly nine times the rate in the general US population (James et al., 2016). In terms of social factors contributing to health dis- parities among gender minorities, gender minority indi-
  • 60. viduals experience higher rates of unemployment, housing discrimination, and homelessness. Gender minorities also face pervasive violence and harassment, including verbal harassment, physical attack, and sexual assault. Finally, gender minorities face multiple difficulties accessing health care that is knowledgeable, welcoming, and appropriate. Gender minorities often put off seeking necessary health care for fear of mistreatment. Those who do seek medical care report negative experiences related to refusal of treatment or harassment (Kosenko, Rintamaki, Raney, & Maness, 2013). In many reported cases, gender minorities often have to teach their pro- viders about transgender-specific health care needs to obtain appropriate care (James et al., 2016). Research has demonstrated that high levels of pro- vider knowledge and the quality of their communication continues to contribute toward improvements in patient experiences and perceptions of care within the general population with the potential to improve patient out- comes (Mohammed et al., 2016). However, existing re- search related to the health care of gender minority populations has consistently demonstrated that in- sufficiency of specific provider knowledge and competent communication among health care providers continues to play a significant role in the persistent health dis- parities experienced by genderminorities (Kosenko, et al., 2013; Park & Safer, 2018). It should therefore be of par- ticular importance in nursing education to address these disparities by familiarizing students with gender minority health care needs. This knowledge can simultaneously improve student behaviors and comfort levels to posi- tively affect meaningful interventions for gender minority populations (Rounds et al., 2013). Meaningful inter- ventions might include (but not be limited to) in-
  • 61. corporating considerations of the gender minority client in existing courses such as advanced health assessment, risk prevention, pharmacology, reproductive health, and health policy. In their study on practicing nurses’ knowl- edge of transgender patient needs, Carabez, Eliason, and Martinson (2016) determined that most nurses have insecurities and/or misconceptions related to gender minority patients and their specific health care needs. Despite the need to educate nurses on health care spe- cific to gender minorities, findings from a national survey of 1,000 nursing faculty show that nursing lags behind other disciplines in terms of LGBTQ-related curricular content (Lim et al., 2015). Specifically, findings demon- strated an allotted mean of 2.12 hours of LGBTQ-related content in nursing versus a mean of 5 hours of LGBTQ- related content allotted by undergraduate medical edu- cation (Lim et al., 2015; Obedin-Maliver et al., 2011). Addressing gender minority health care needs within nursing education is in keeping with the current position statement by the American Nurses Association (2018) that specifically encourages nurses to deliver culturally competent care and advocacy for transgender clients. Considering that much of the discrimination faced by gender minorities has occurred with point-of-care pro- viders, it might be especially critical to integrate gender minority–specific health care content in advanced practice nursing programs to begin to mitigate some of the dis- crimination and negative experiences faced by gender mi- nority clients in the health care environment. To date, even less research on lesbian, gay, bisexual, transgender-in- clusive curricular content is available specific to advanced practice nursing (Manzer, O’Sullivan, & Doucet, 2018). In this study, we sought to determine the knowledge of
  • 62. medical guidelines, health disparities, and policies spe- cific to gender minorities both before and after attending a module on gender minority health among advanced practice nursing students in an advanced pharmacology course. In addition, we sought to de- termine what effect attending the same module might have on transphobia scores both before and after the module presentation. Although there have been a num- ber of studies examining attitudes and beliefs of students enrolled in various health professions related to homo- phobia, very few have looked at student attitudes and beliefs regarding transphobia. In addition, there are very few studies about students in health care professions being exposed to gender minority content during their formal education (Acker, 2017). Therefore, we sought to address the educational needs evidenced in existing lit- erature to determine whether advanced practice nursing students’ knowledge, attitudes, and beliefs about gender minorities might improve after participating in a gender minority health care module. Methods Before presenting the module and collecting data, this pilot study was submitted to the university’s institutional Journal of the American Association of Nurse Practitioners April 2020 · Volume 32 · Number 4 333 R. J. Klotzbaugh et al. © 2019 American Association of Nurse Practitioners. Unauthorized reproduction of this article is prohibited. review board and was qualified as exempt from review
  • 63. because of educational settings and practices. Eleven students (representing one of a number of advanced pharmacology course sections for students enrolled in the advanced practice nursing program) participated in a module on gender minority health as part of the ad- vanced pharmacology course for advanced practice nursing students. The module was approximately 90 minutes long and included gender minority–specific content related to medical knowledge and health dis- parities, as well as local and national policies. The ap- proach to the module content was informed by current studies reflecting themajor health issues, disparities, and concerns among genderminorities. Themodule beganwith an introduction to appropriate terminology, as well as a discussion regarding the difference between sexual ori- entation and gender identity. The importance of providing a gender affirmative clinical practice such as intake forms that include both sex assigned at birth and gender identity, use of a clients preferred pronouns, and the provision of gender neutral bathrooms was also discussed. In addition, background related to gender minority health disparities were also presented as a way to stress the importance of a gender minority-specific health module. Both local and national policies were also discussed, particularly because they relate to insurance coverage or lack of insurance coverage for transgender health-related services. Given the focus of the course, however, the majority of the presentationwas related to initiation and appropriate management of gender affirmation hormone therapy for the gender minority client. After presenting an overview of gender affirmation therapy, students participated in three different case studies to review, consider, and dis- cuss. The module concluded with an open dialogue for students to address any questions or particular concerns about any of the content including the provision of gen-
  • 64. der affirmation therapy. It is important that students were provided with a copy of the presentation and suggested further readings and appropriate online resources. Participating students were enrolled in either the family or adult-gerontology concentration. Students in this section were all enrolled part-time in a program located in a large urban area with a focus on the health of urban populations. All of the students had previous experience working as registered nurses before entering the advance practice nursing program of study. To evaluate student learning, all participants completed a questionnaire on the module content both before and after attending the presentation. The questionnaire covered concepts related to each gender minority–specific content area. In addition, all participants completed a transphobia scale both before and immedi- ately after themodule presentation to evaluate its effect on attitudes and beliefs about gender minorities. Finally, all students were initially surveyed to obtain information re- lated to their previous experience with gender minority patients and whether they felt their curriculum adequately covered gender minority health. The questionnaire was an adaptation from an existing questionnaire by Braun, Garcia-Grossman, Quiñones- Rivera, and Deutsch (2017). Validity and reliability were not reported for the questionnaire. The questionnaire was adapted in part to reflect appropriate local health policies for gender minorities. Maximum scores in medical knowledge, health disparities, and local and national policies were 11, 2, and 3, respectively, with 1 point given for each correct response in each of the domains. Higher scores indicated greater knowledge in each module domain (Table 1). The transphobia scale, which is a 9-item scale developed by Nagoshi et al.
  • 65. (2008) to measure prejudice against gender minorities, was also used. Items were scored on a scale of 1 (dis- agree) to 3 (agree), with 2 indicating neutrality. The transphobia scale was selected for this study because it demonstrated high internal consistency, with a re- liability coefficient of 0.82 and a test-retest stability correlation of 0.88. Lower scores indicated less trans- phobia (Table 2). Statistical analysis was performed using Statistical Package for the Social Sciences (SPSS) 25.0 for Macintosh (IBM, Armonk, NY). Nonparametric paired samples sta- tistical analyses were used to analyze pretest and post- test medical knowledge, health disparity, and policy knowledge, as well as attitudes and beliefs about gender minorities. Nonparametric tests were chosen because of the small sample size. Results Demographic data collected for this sample were limited to sex assigned at birth, gender identity, age, and previous experience with gender minority patients. All students indicated their sex and gender identity as female, with a mean age of 33.5 years. Three students (27.3%) reported having had previous experience with gender minority patients, whereas 8 (72.7%) indicated they did not. Two students (18.2%) indicated that the program had ade- quately covered the topic, whereas 9 (81.8%) indicated that the program had not. The Wilcoxon signed rank test was conducted to evaluate whether students showed improved medical knowledge after participating in the gender minority health module. Results indicated a significant difference (Z = 22.98; p = .003). The mean of the ranks for pretest medical knowledge was 4.73, whereas the mean for
  • 66. posttest knowledge was 7.55. A Wilcoxon signed rank test showed a significant dif- ference in health disparity knowledge after participating in the module (Z =22.74; p = .006). The mean of the ranks for pretest health disparity knowledge was 0.55, whereas themean posttest was 1.82. In terms of policy, a significant difference was again indicated (Z = 22.98; p = .003). The 334 April 2020 · Volume 32 · Number 4 www.jaanp.com Gender minority health education moduleEducation © 2019 American Association of Nurse Practitioners. Unauthorized reproduction of this article is prohibited. www.jaanp.com Table 1. Questionnaire items by domain of knowledge Medical considerations 1. Match the following medications with the correct population next to each drug. Populations codes are as follows: M = female-to-male F = male-to-female N = not used a. Spironolactone (F) b. Estradiol (F) c. Testosterone (M) d. Antiestrogens (N) e. Progestogens (F) f. Premarin (N) 2. Which of the following statements regarding the medical care of transgender patients is true?
  • 67. a. After vaginoplasty, transgender women no longer need prostate exams b. Oral estrogen use among nonsmoking transgender women still places them at high risk for DVT c. Elevated cholesterol in transgender men should have their testosterone immediately discontinued d. Cervical cancer screening recommendations apply to transgender men e. Transgender women are at increased risk for breast cancer and should be screened annually while on estrogen 3. What professional organization publishes the standards of care of transgender and gender-nonconforming people for the use by primary care providers? a. Institute of Medicine b. World Health Organization c. US Preventative Services d. World Professional Association for Transgender Health 4. Which of the following are terms used to describe gender identity? a. Trans man b. Lesbian c. Male d. Gay e. Trans female 5. All transgender people have at least some surgery to alter their bodies. a. True b. False c. Uncertain 6. Which one of the following is a contraindication to estrogen