Download to read offline
![“ How PRAGMA Can Help Save the Planet” Banquet Keynote Speech Pacific Rim Applications and Grid Middleware Assembly (PRAGMA) 18 Birch Aquarium, Scripps Institution of Oceanography, UCSD March 3, 2010 Dr. Larry Smarr Director, California Institute for Telecommunications and Information Technology Harry E. Gruber Professor, Dept. of Computer Science and Engineering Jacobs School of Engineering, UCSD [email_address]](https://image.slidesharecdn.com/tcalit2widewebextranethtmlnewsroompresentationslsmarr2009pptpragma030310final-100304125737-phpapp01/75/How-PRAGMA-Can-Help-Save-the-Planet-1-2048.jpg)
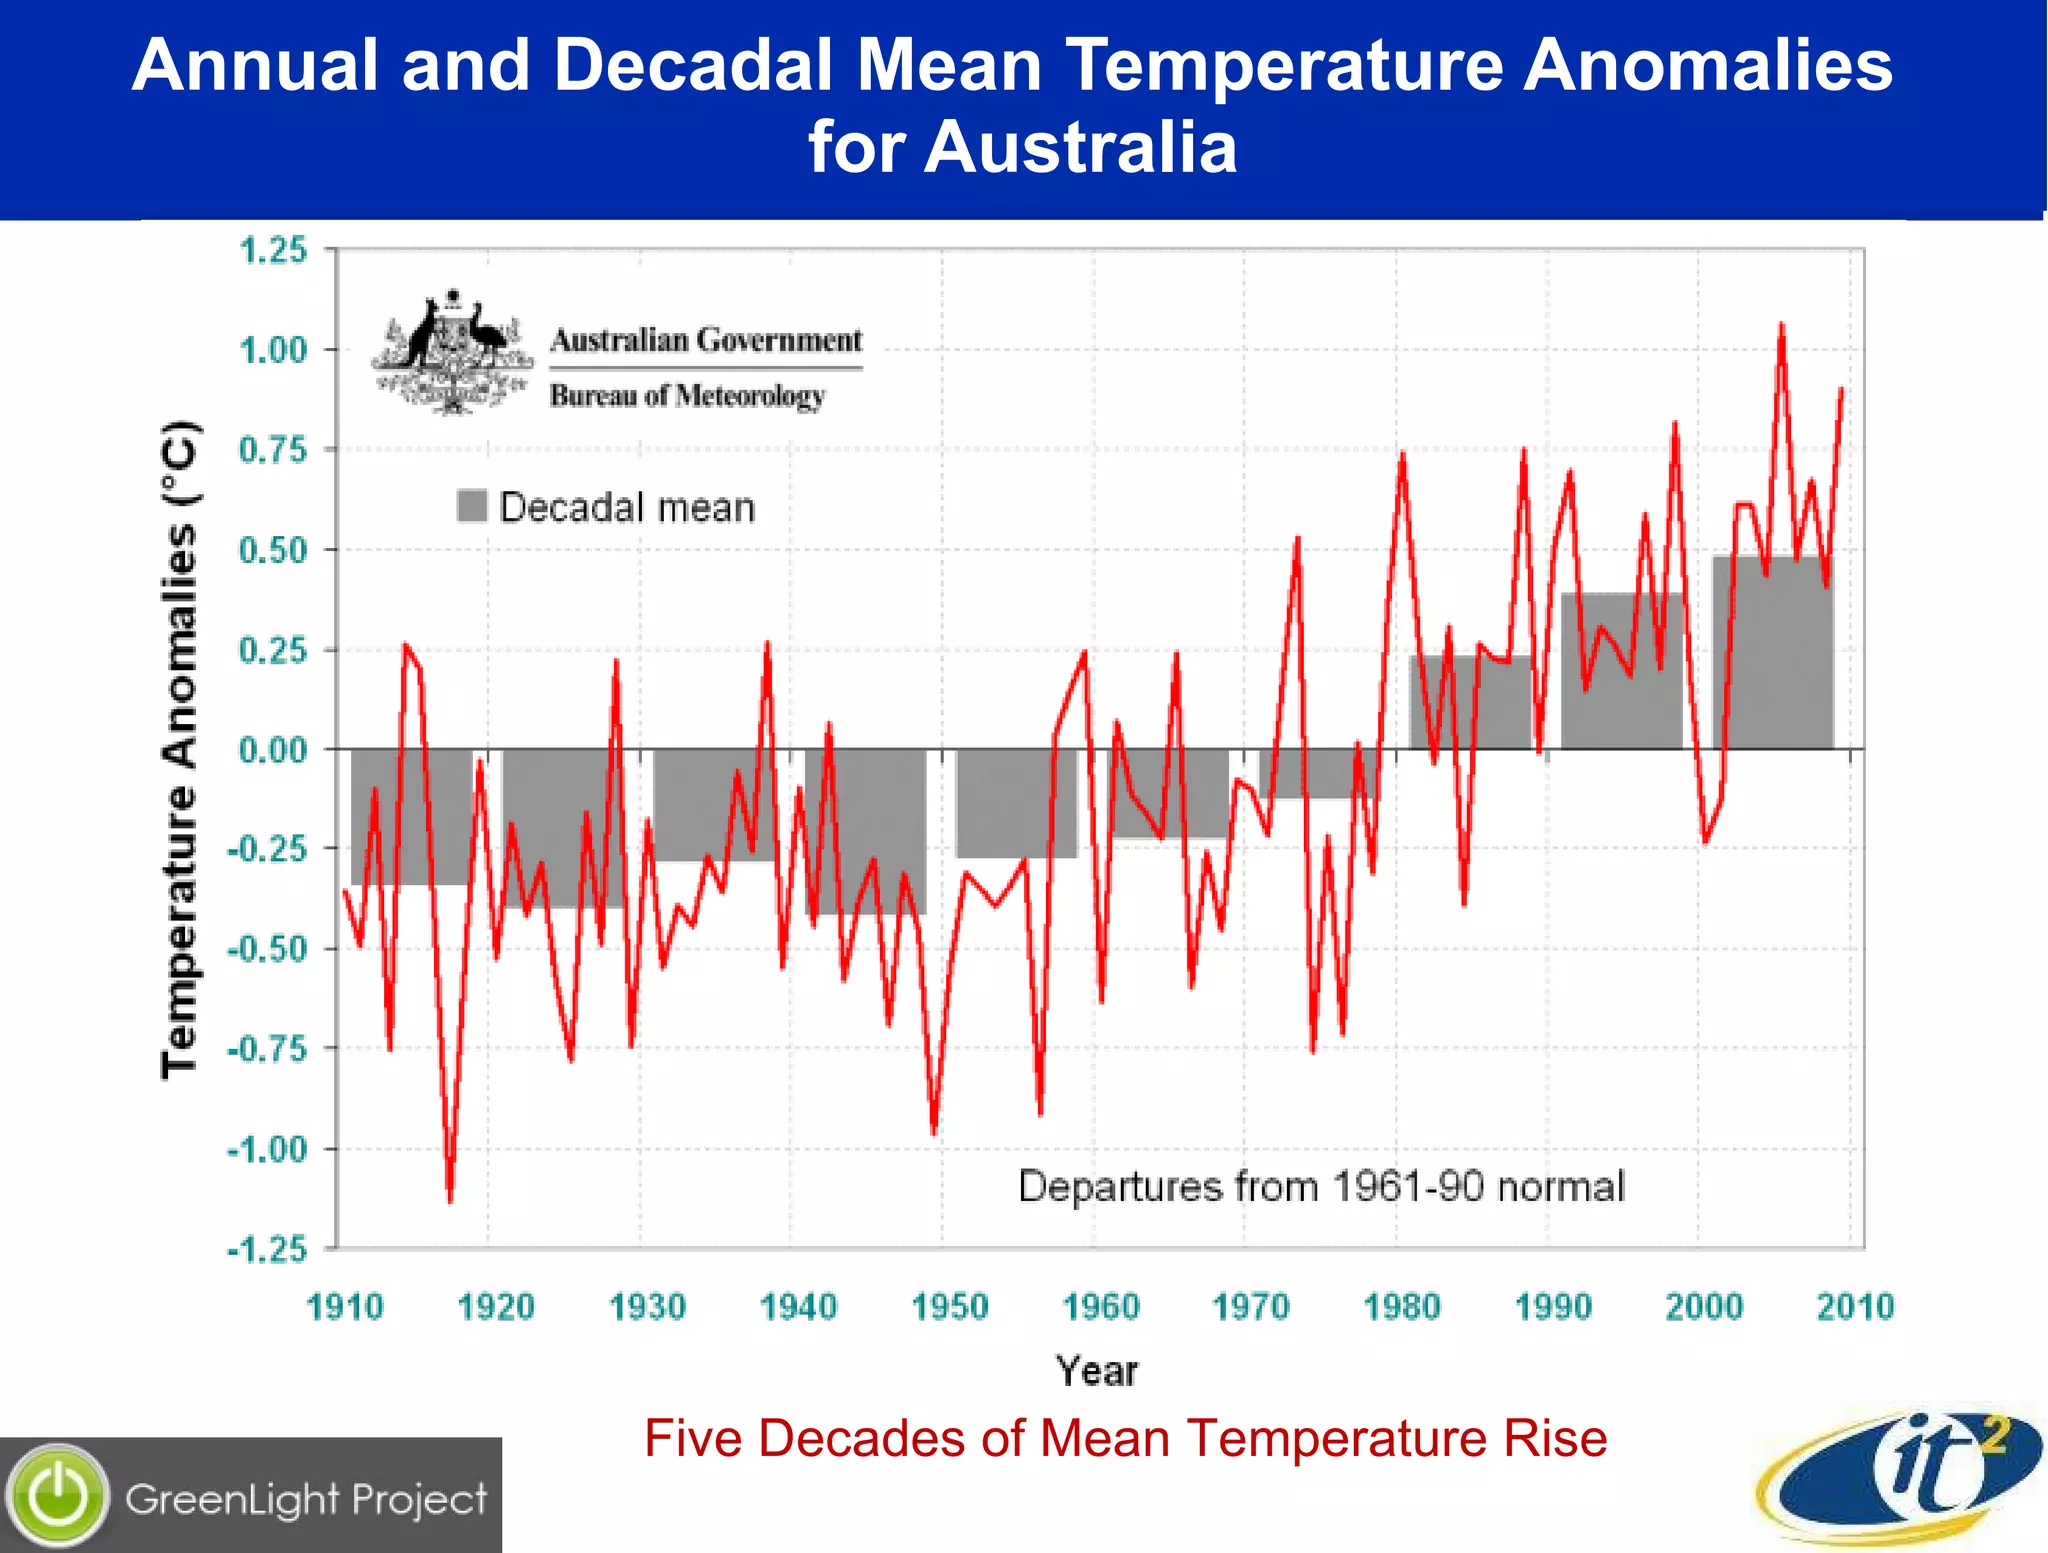
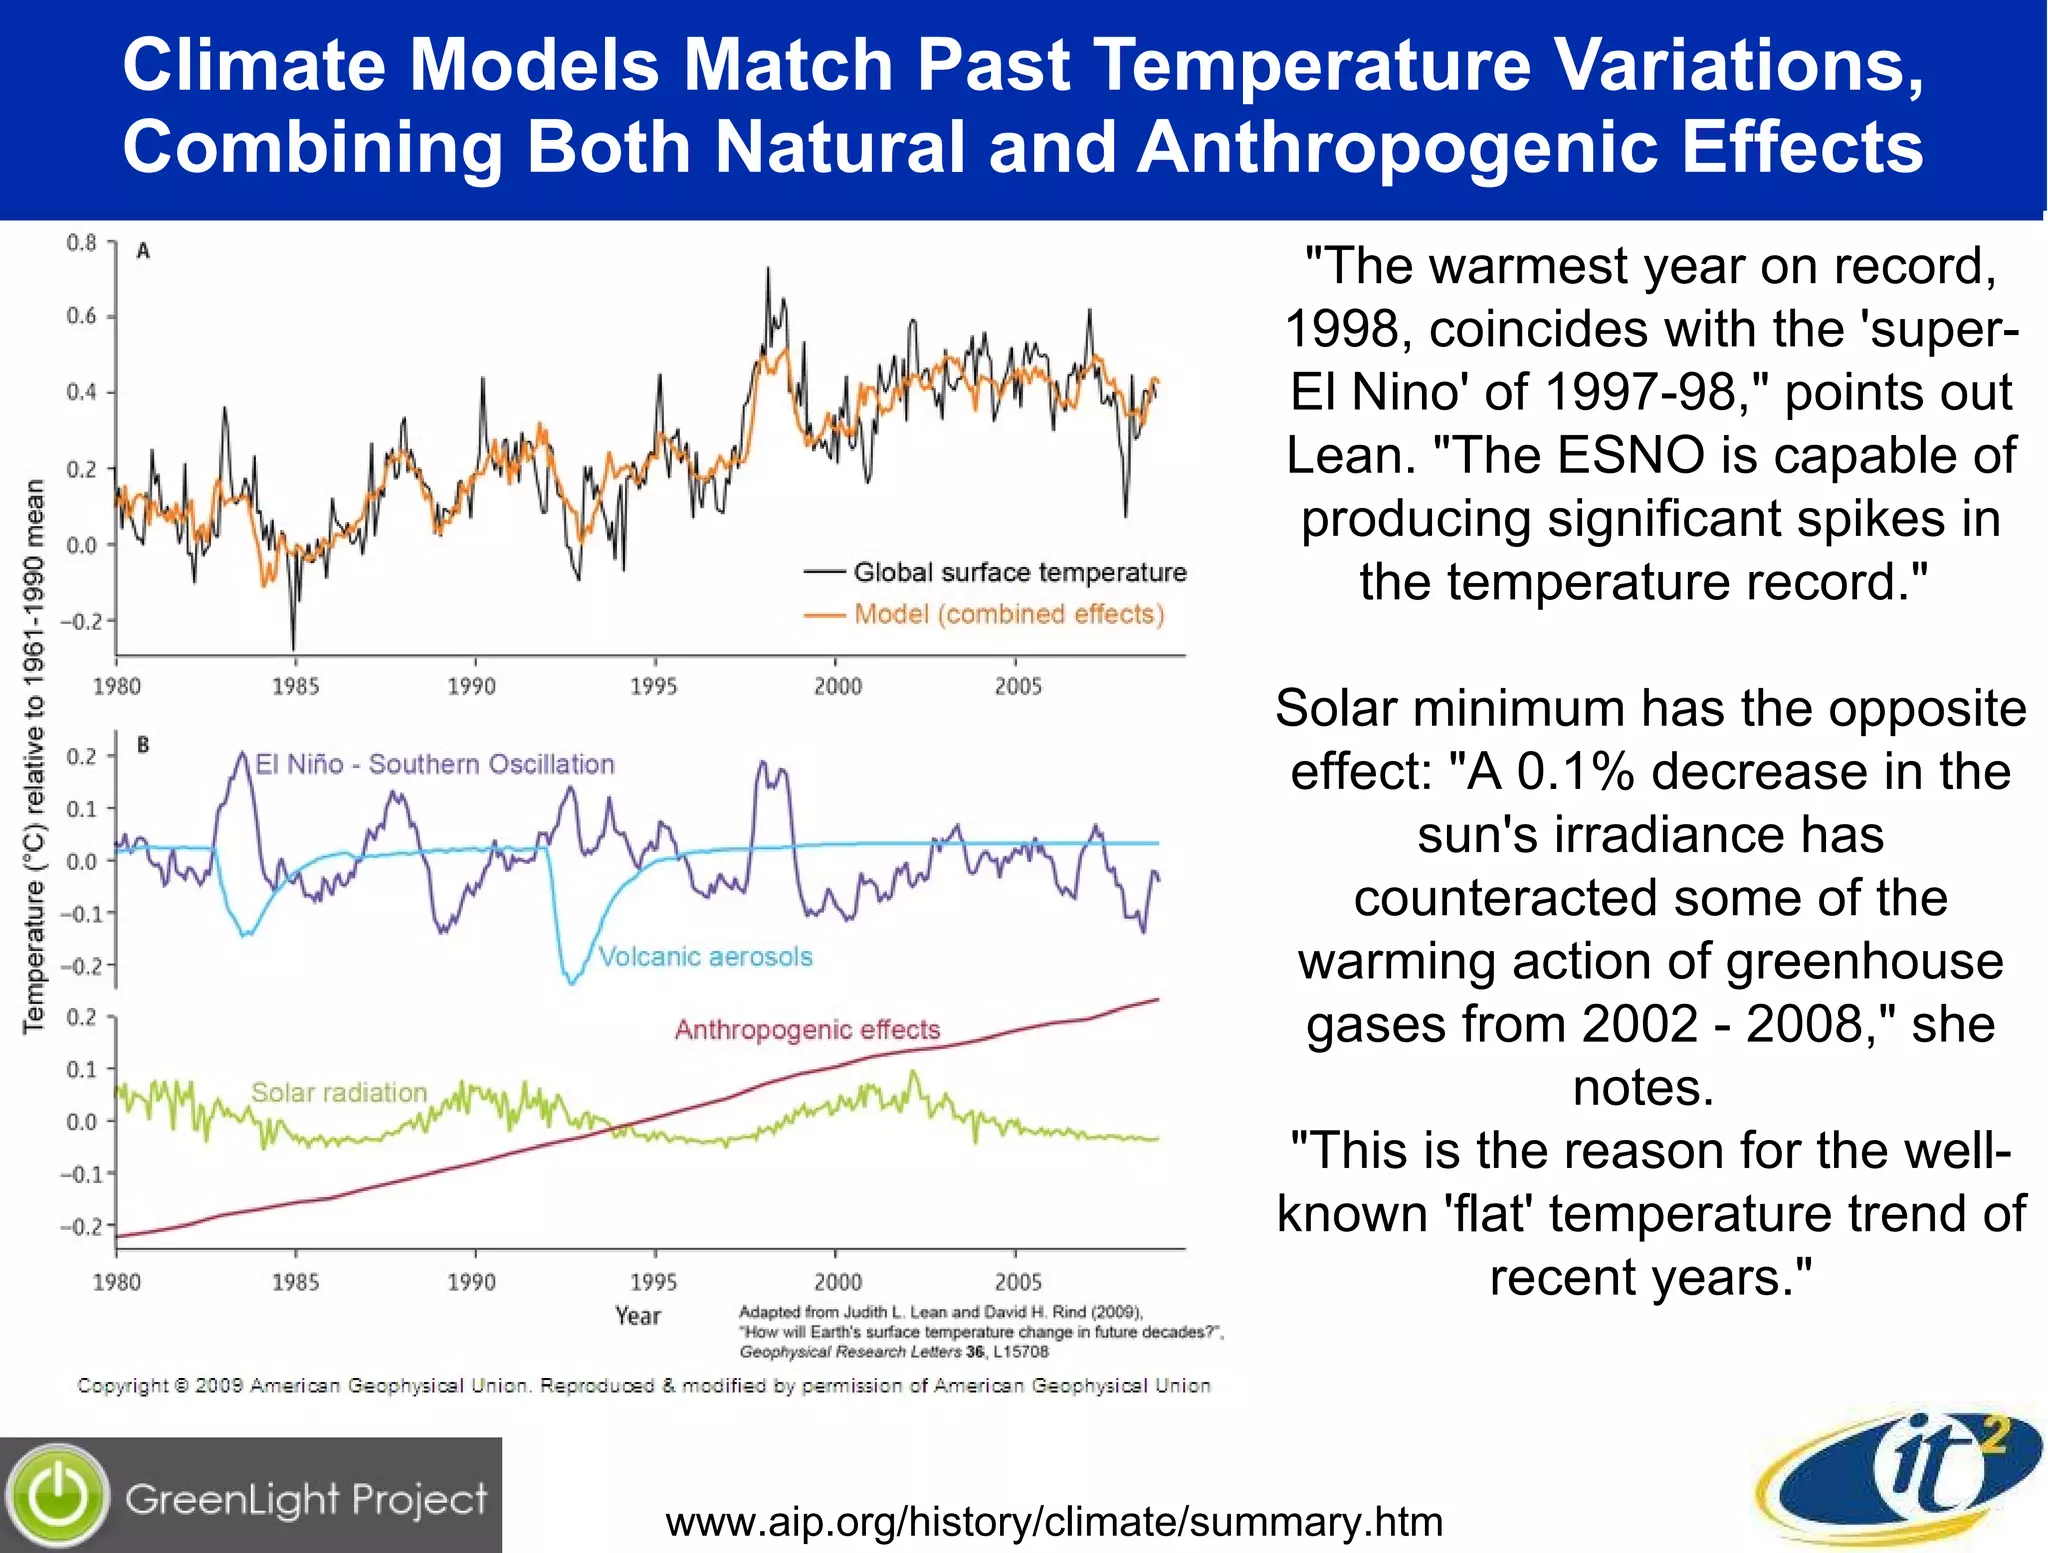
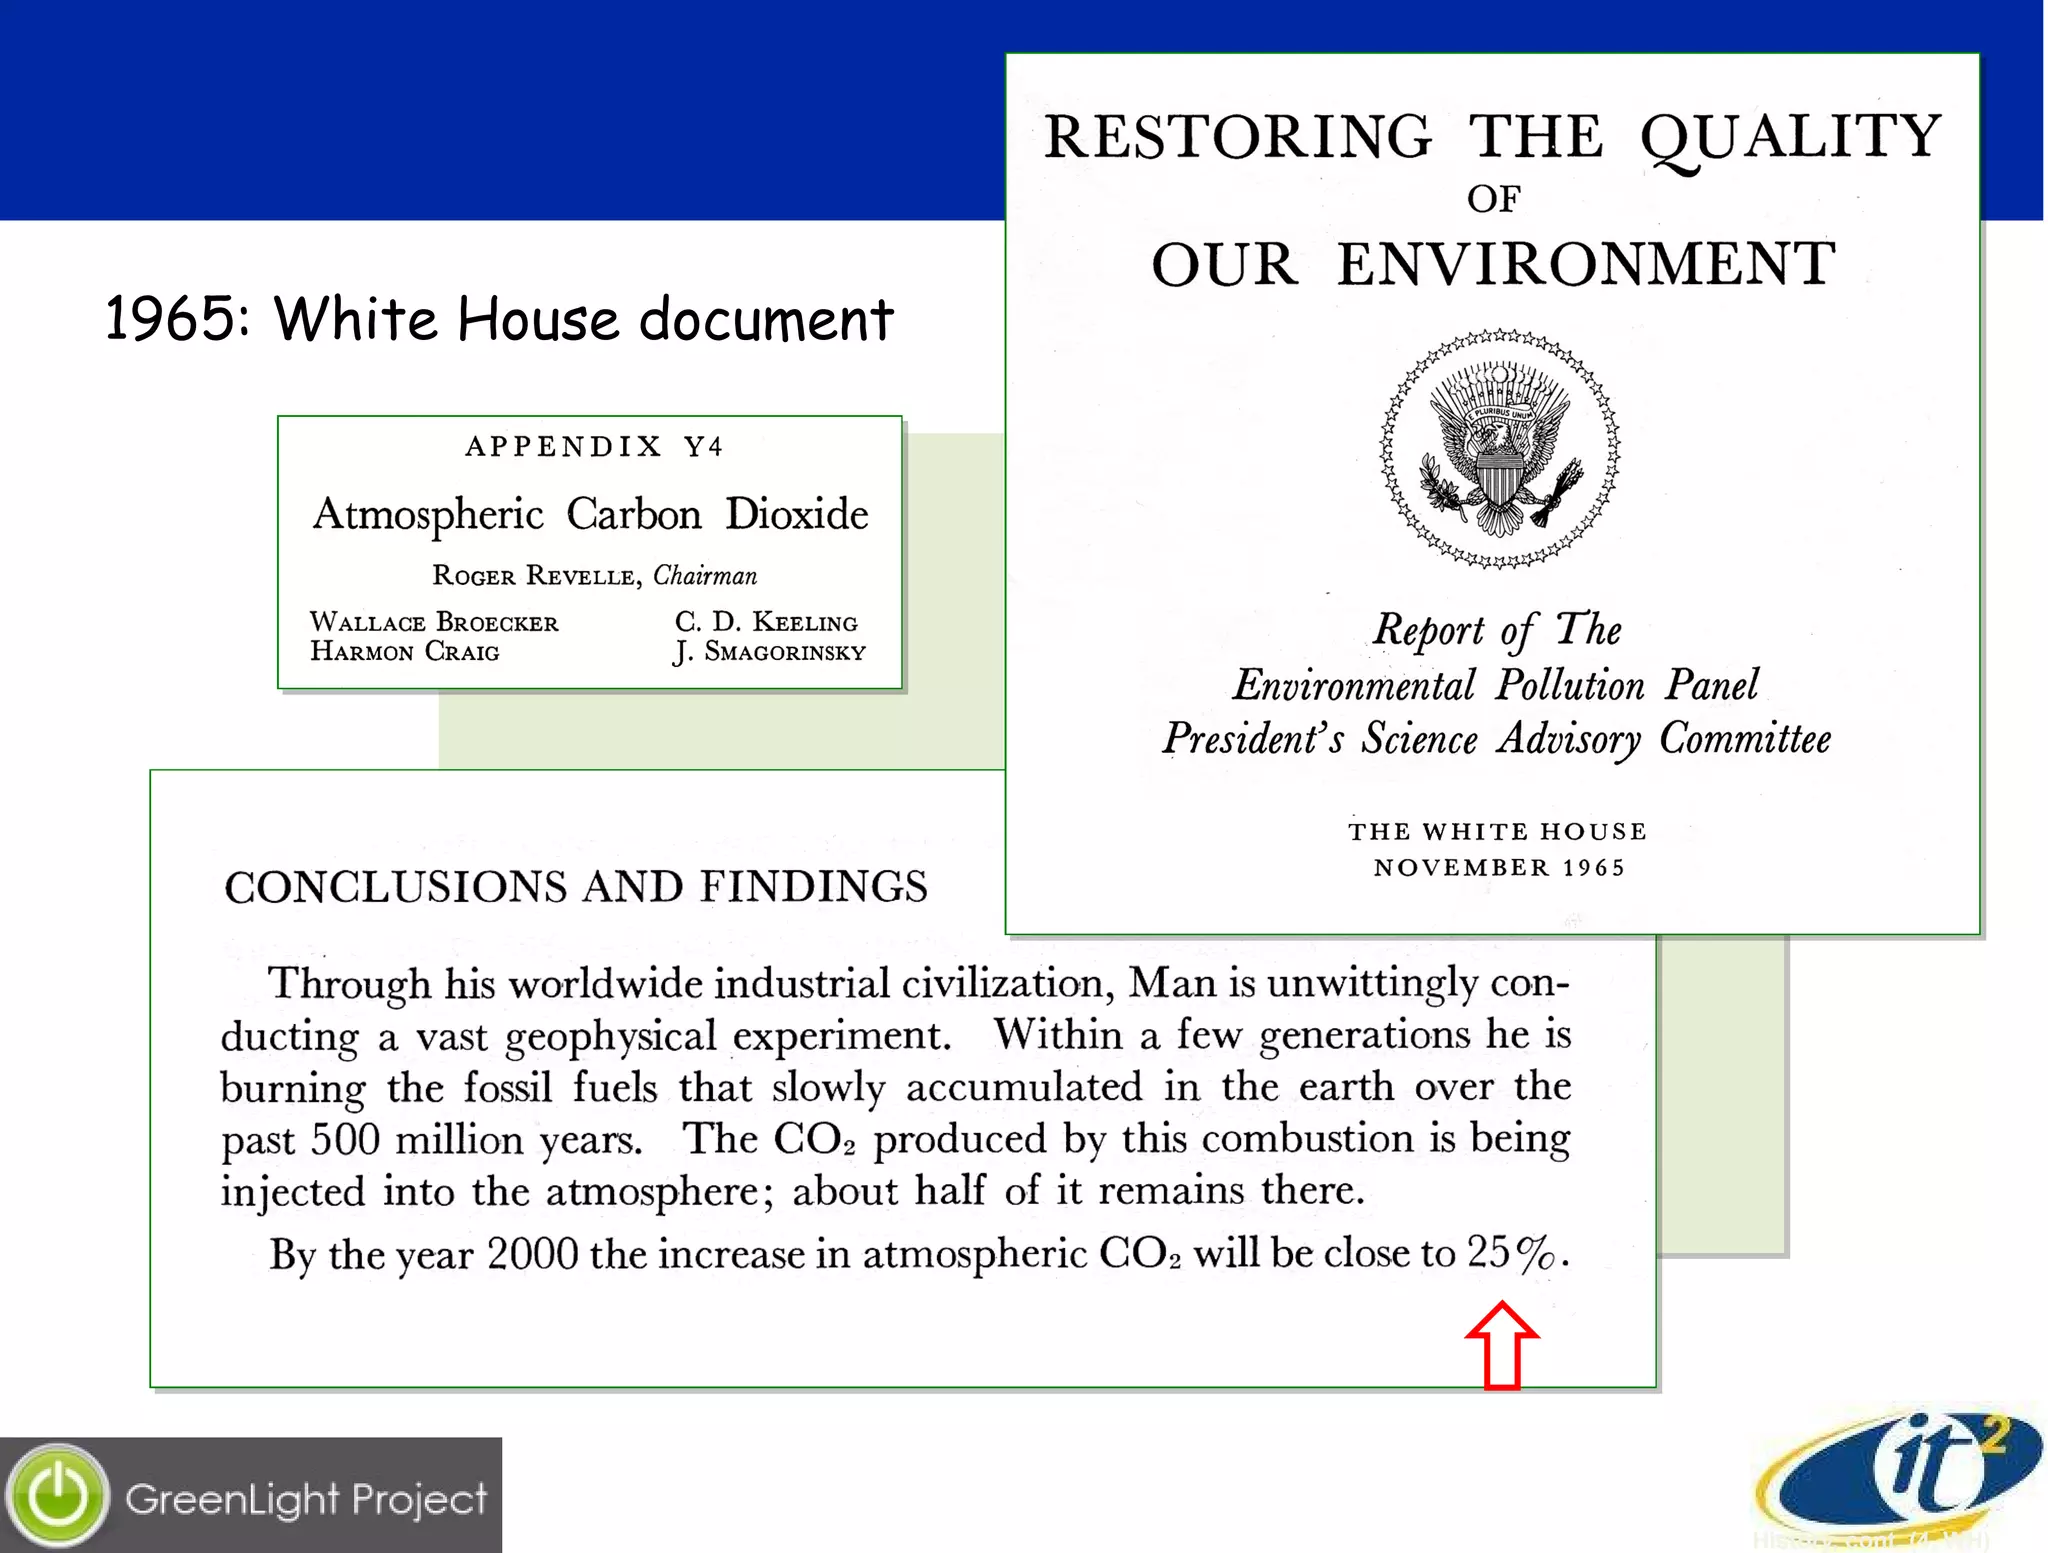
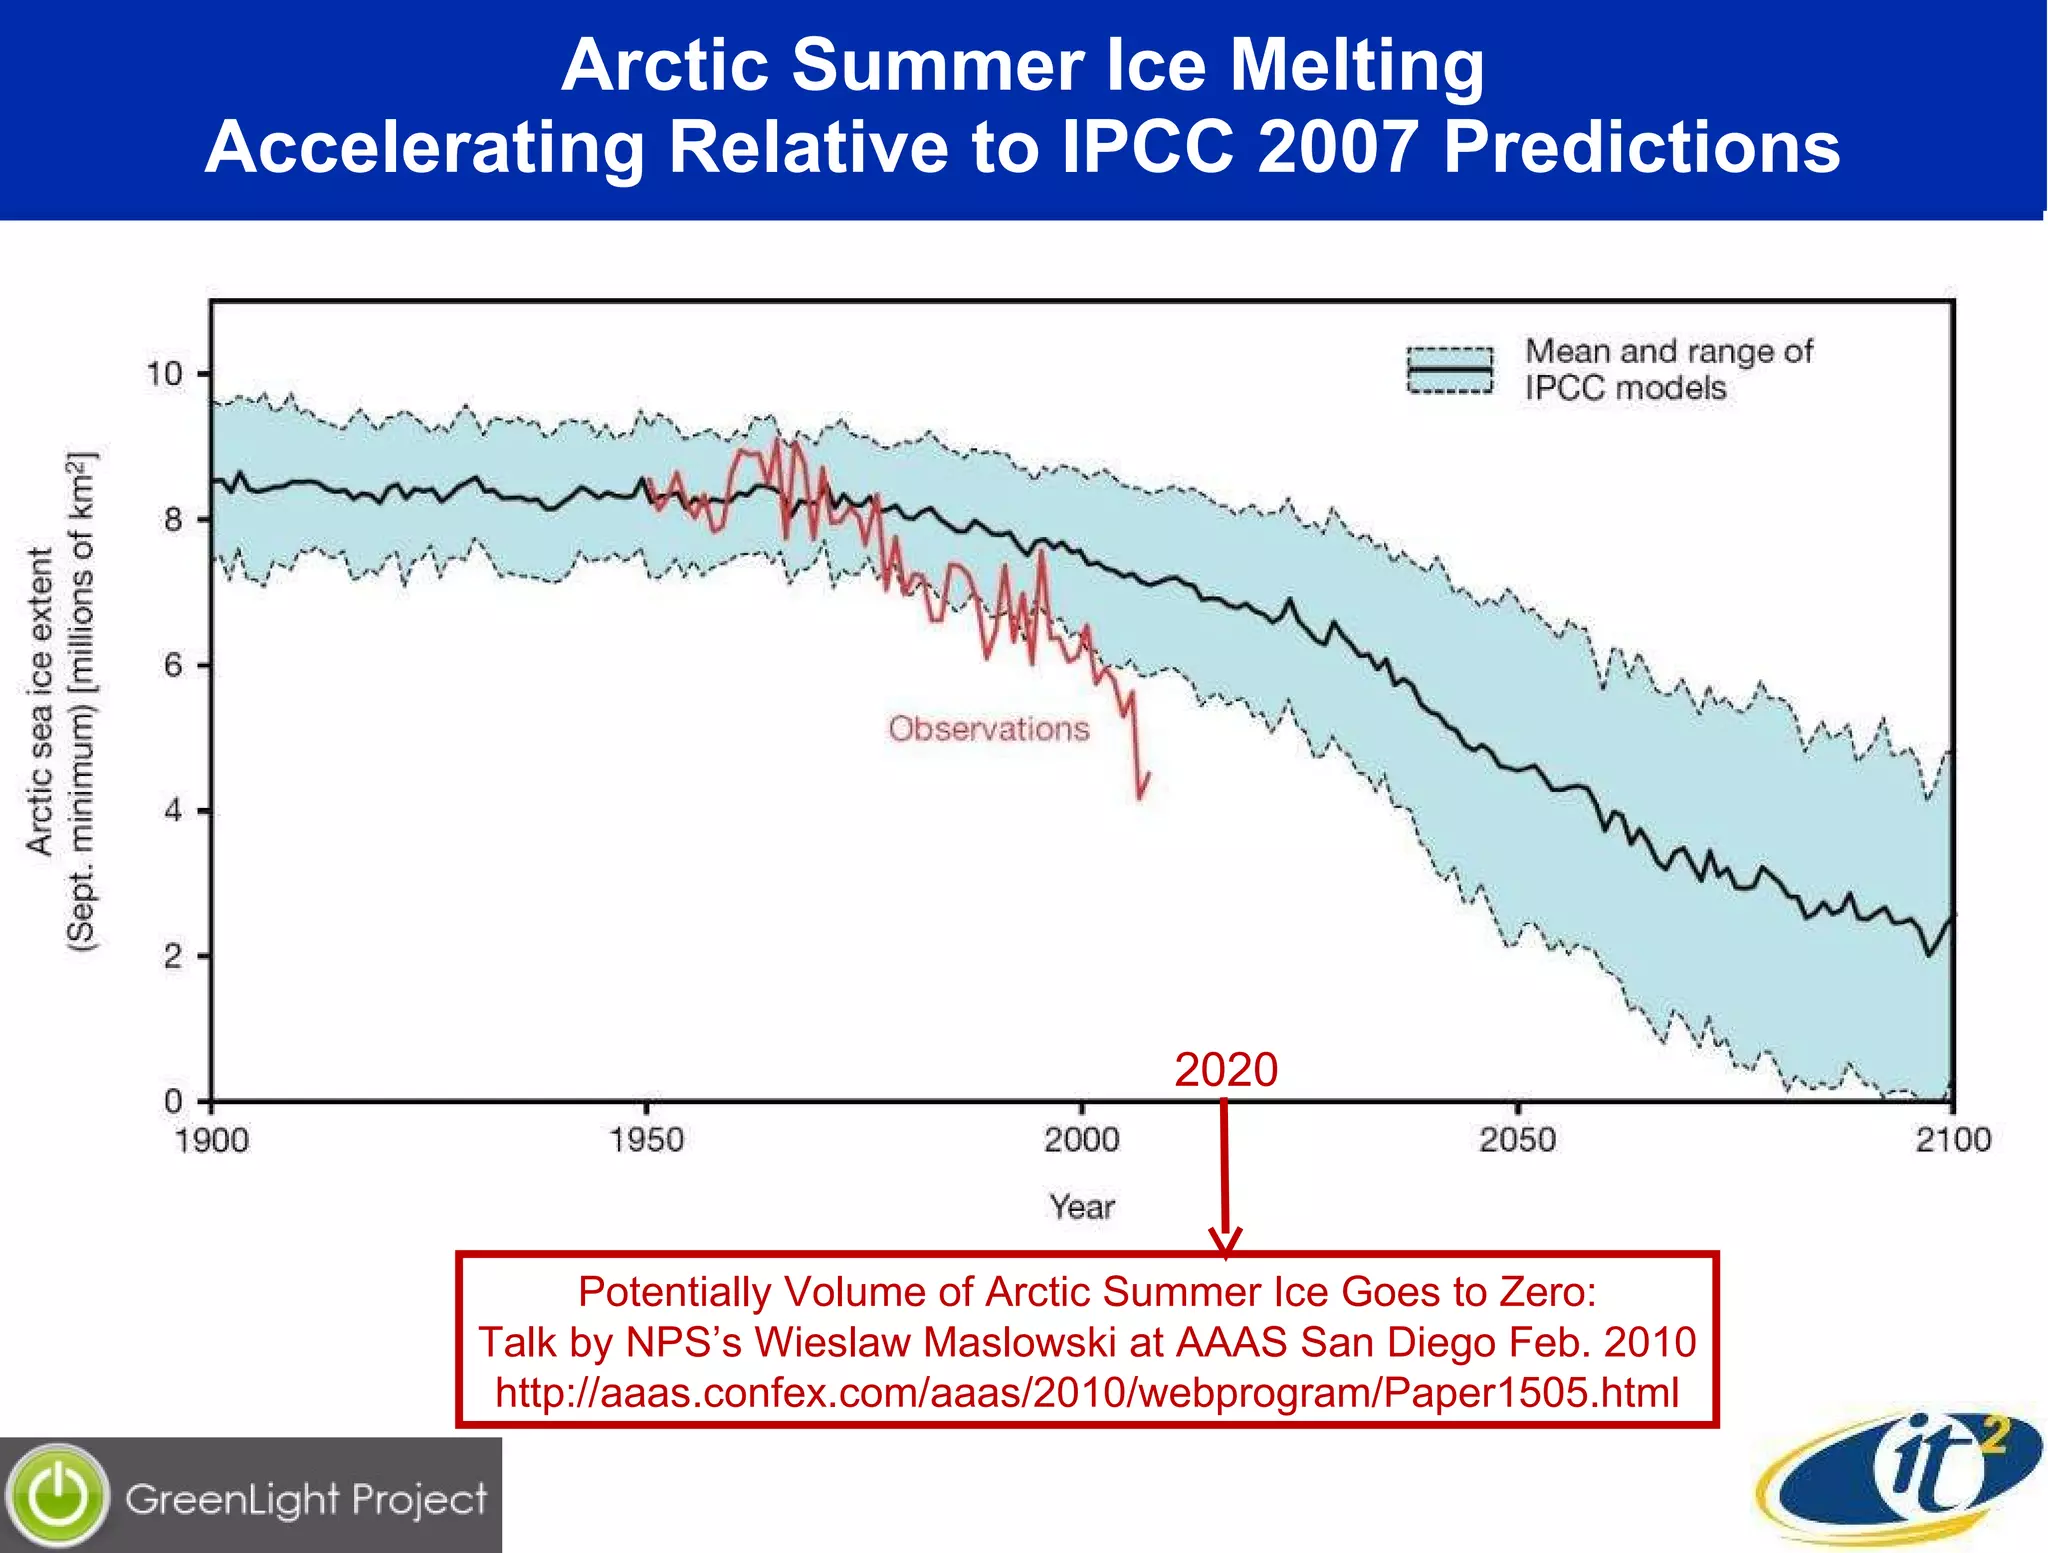
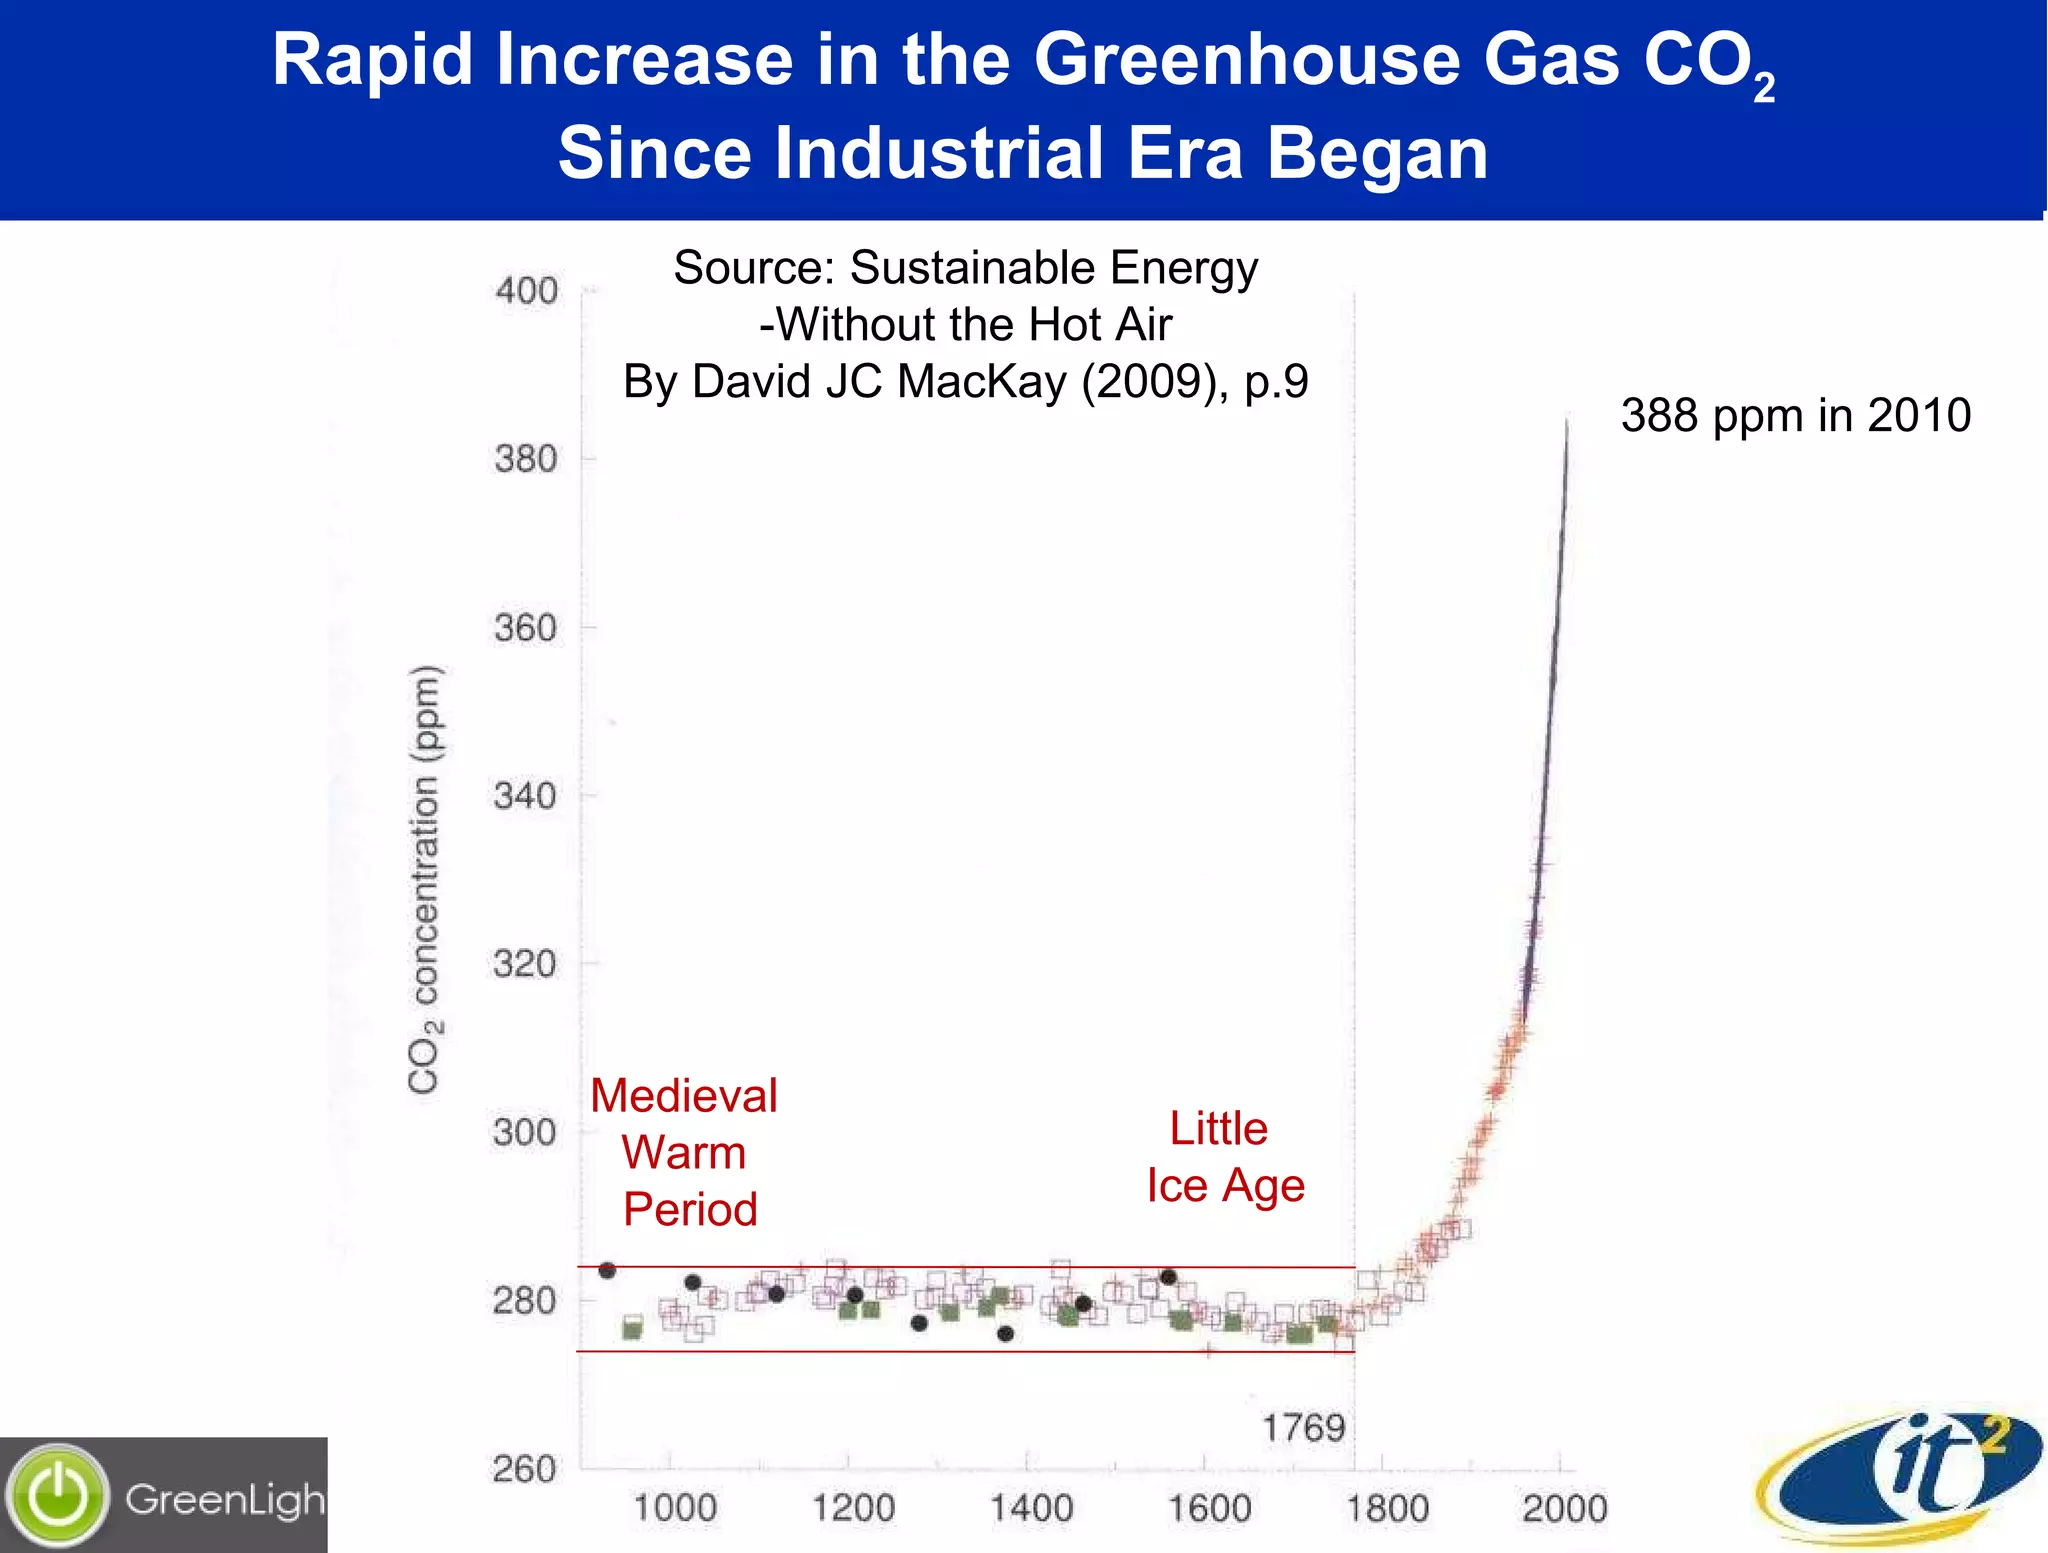
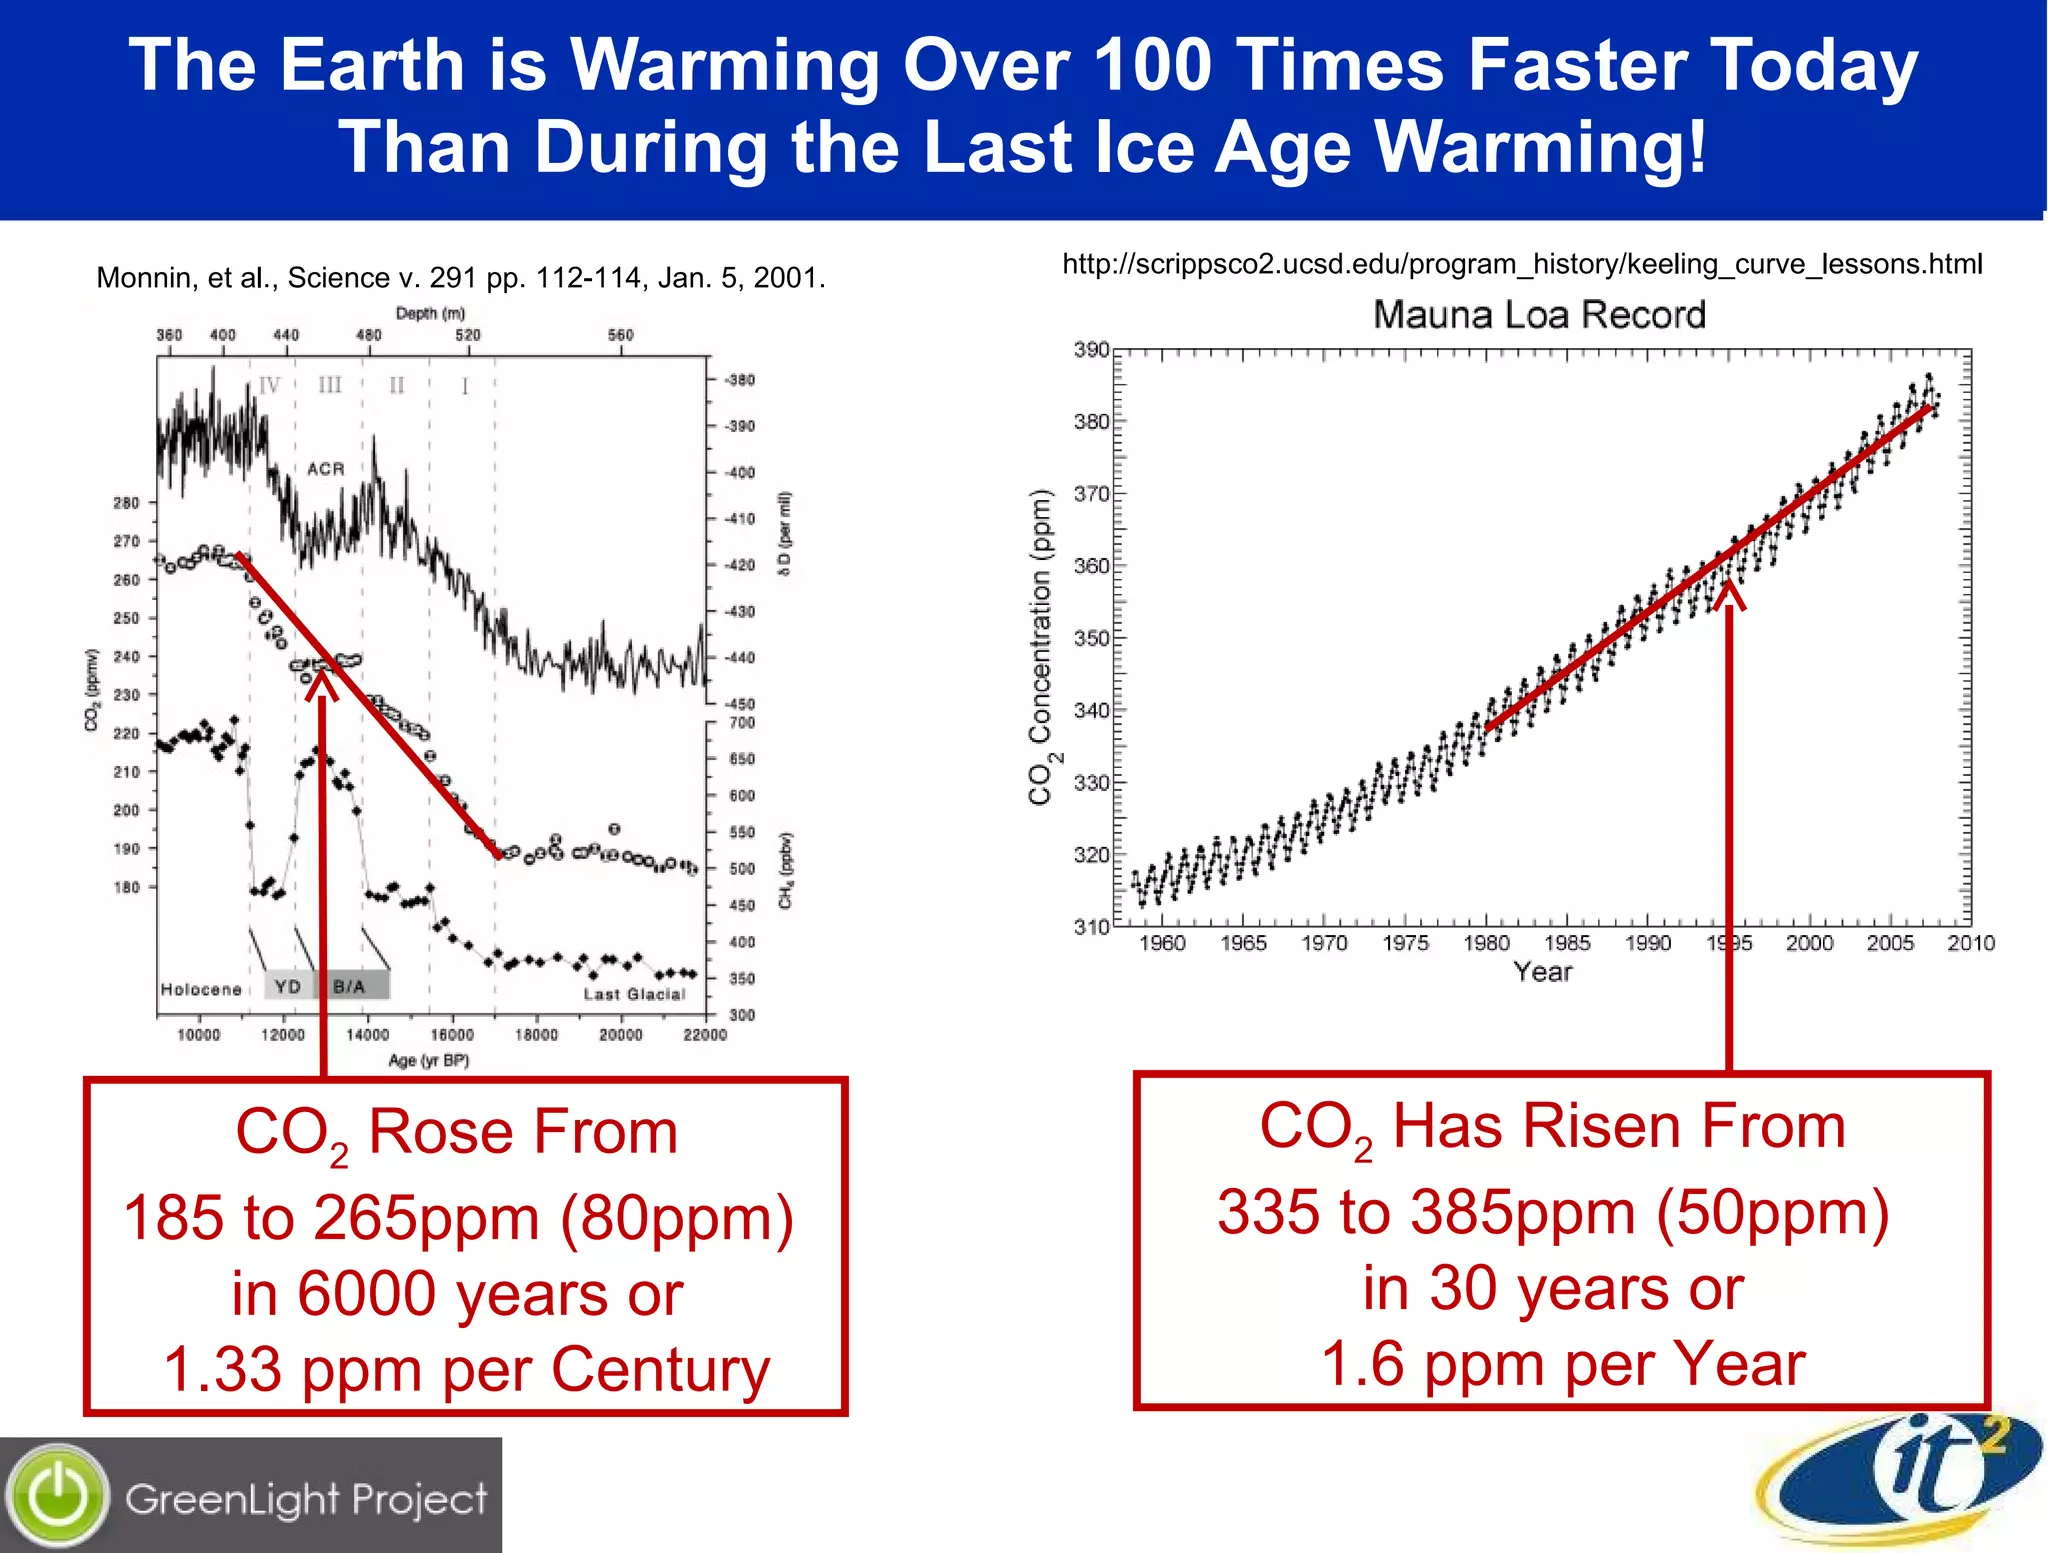
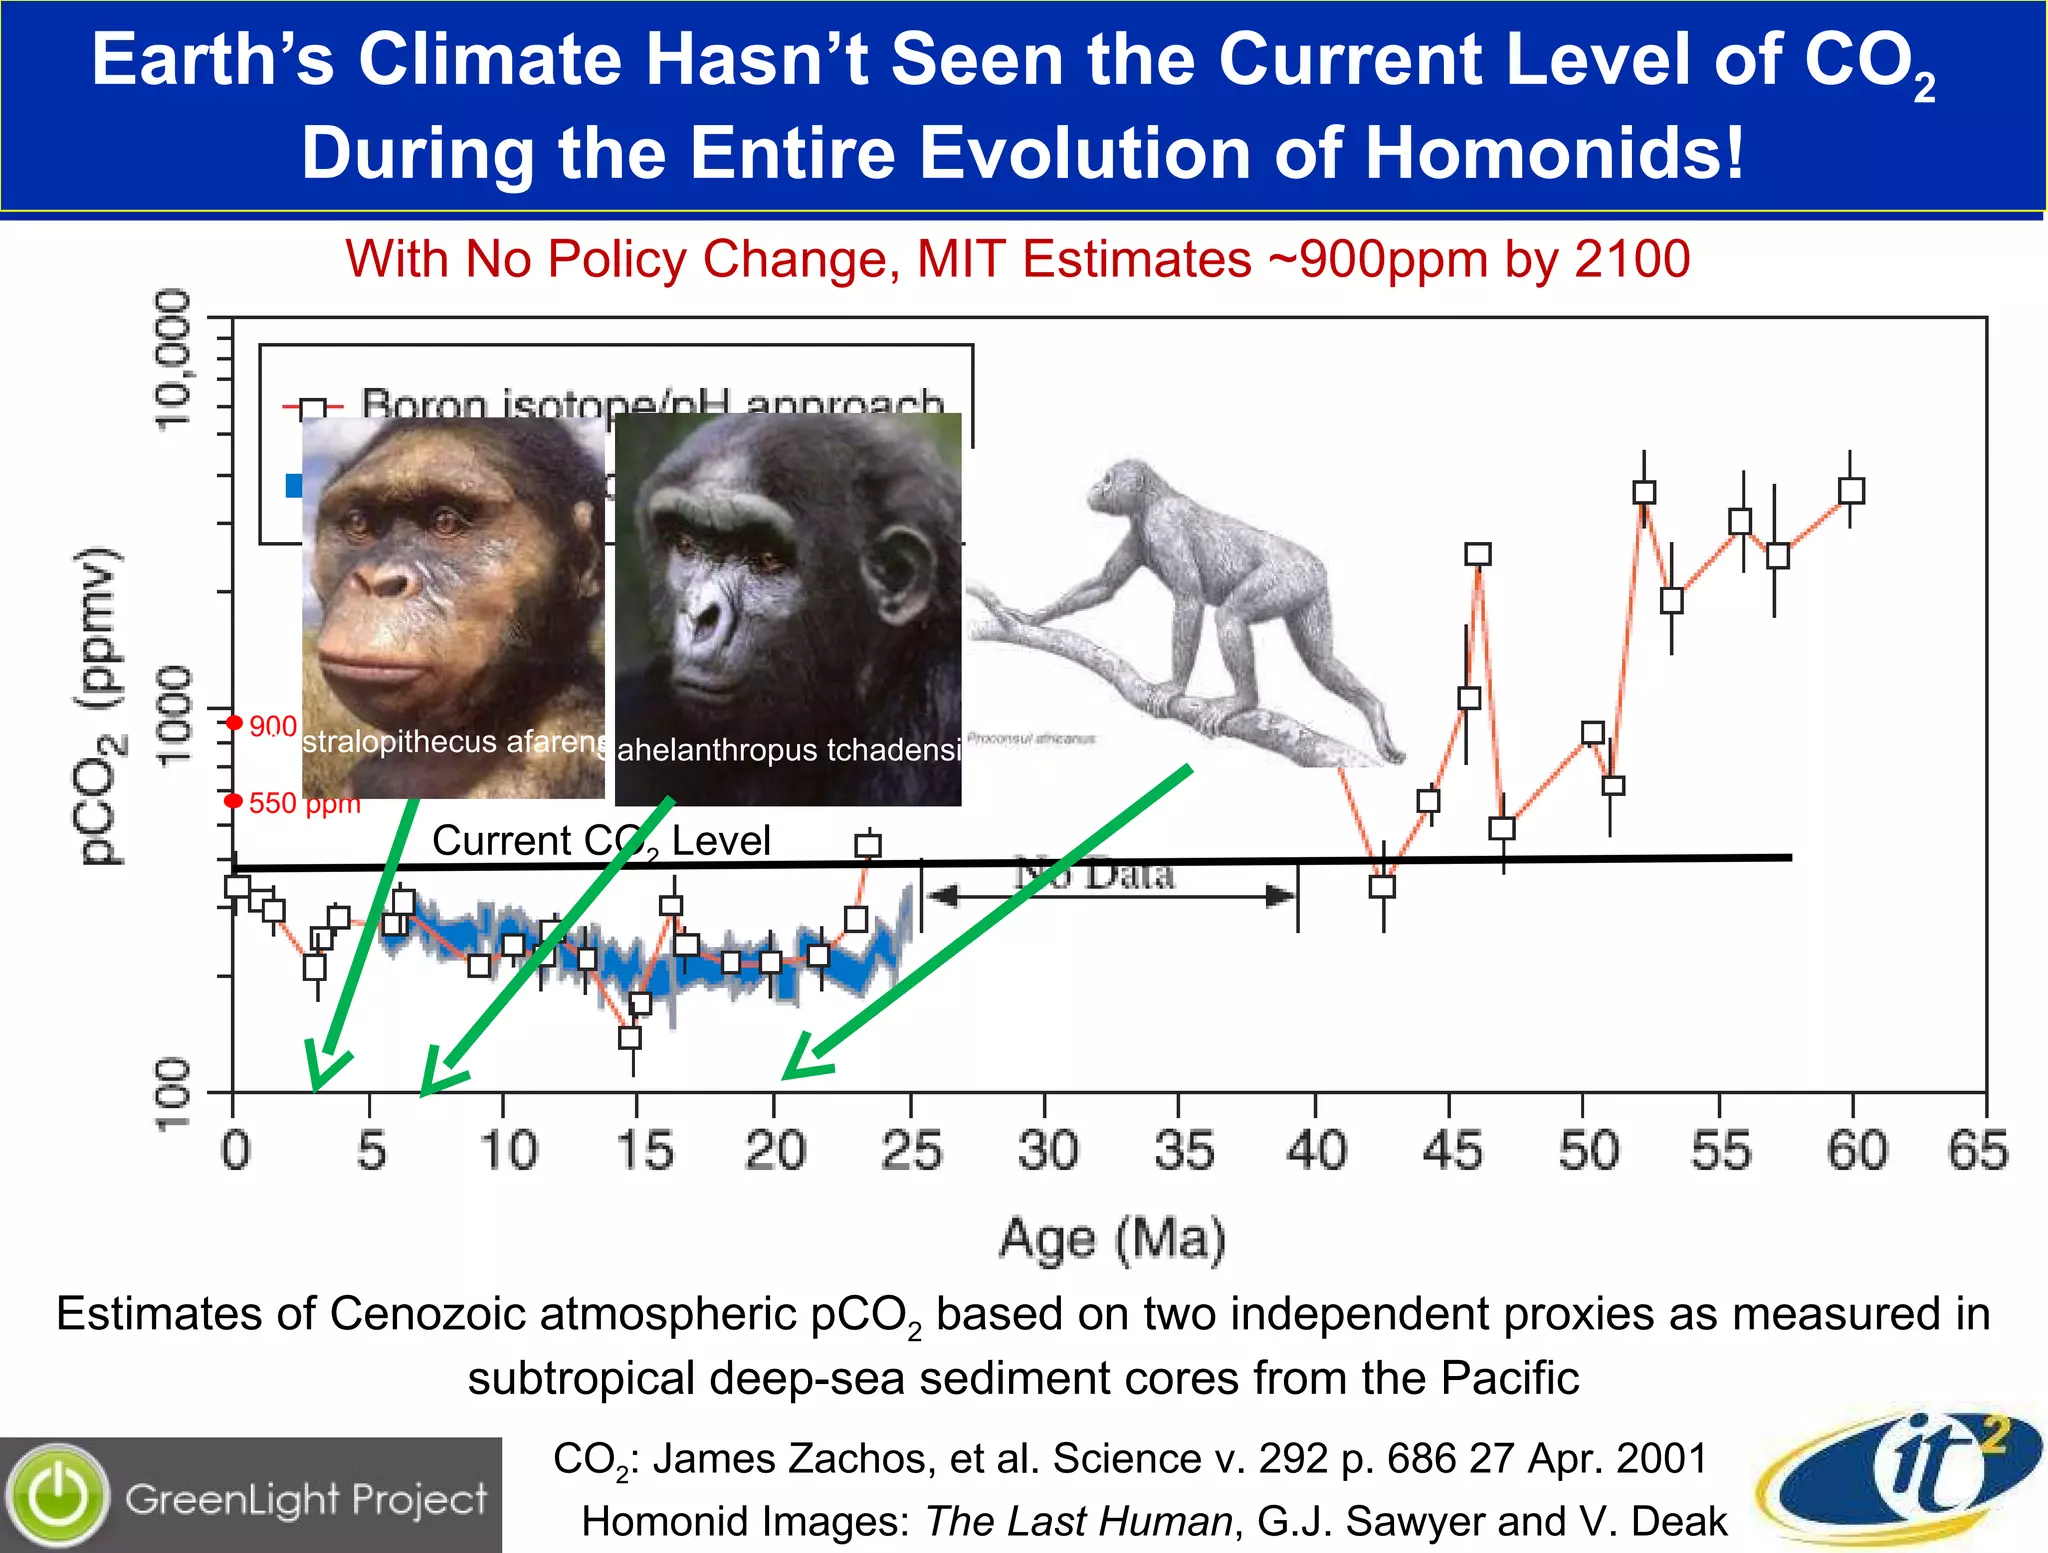
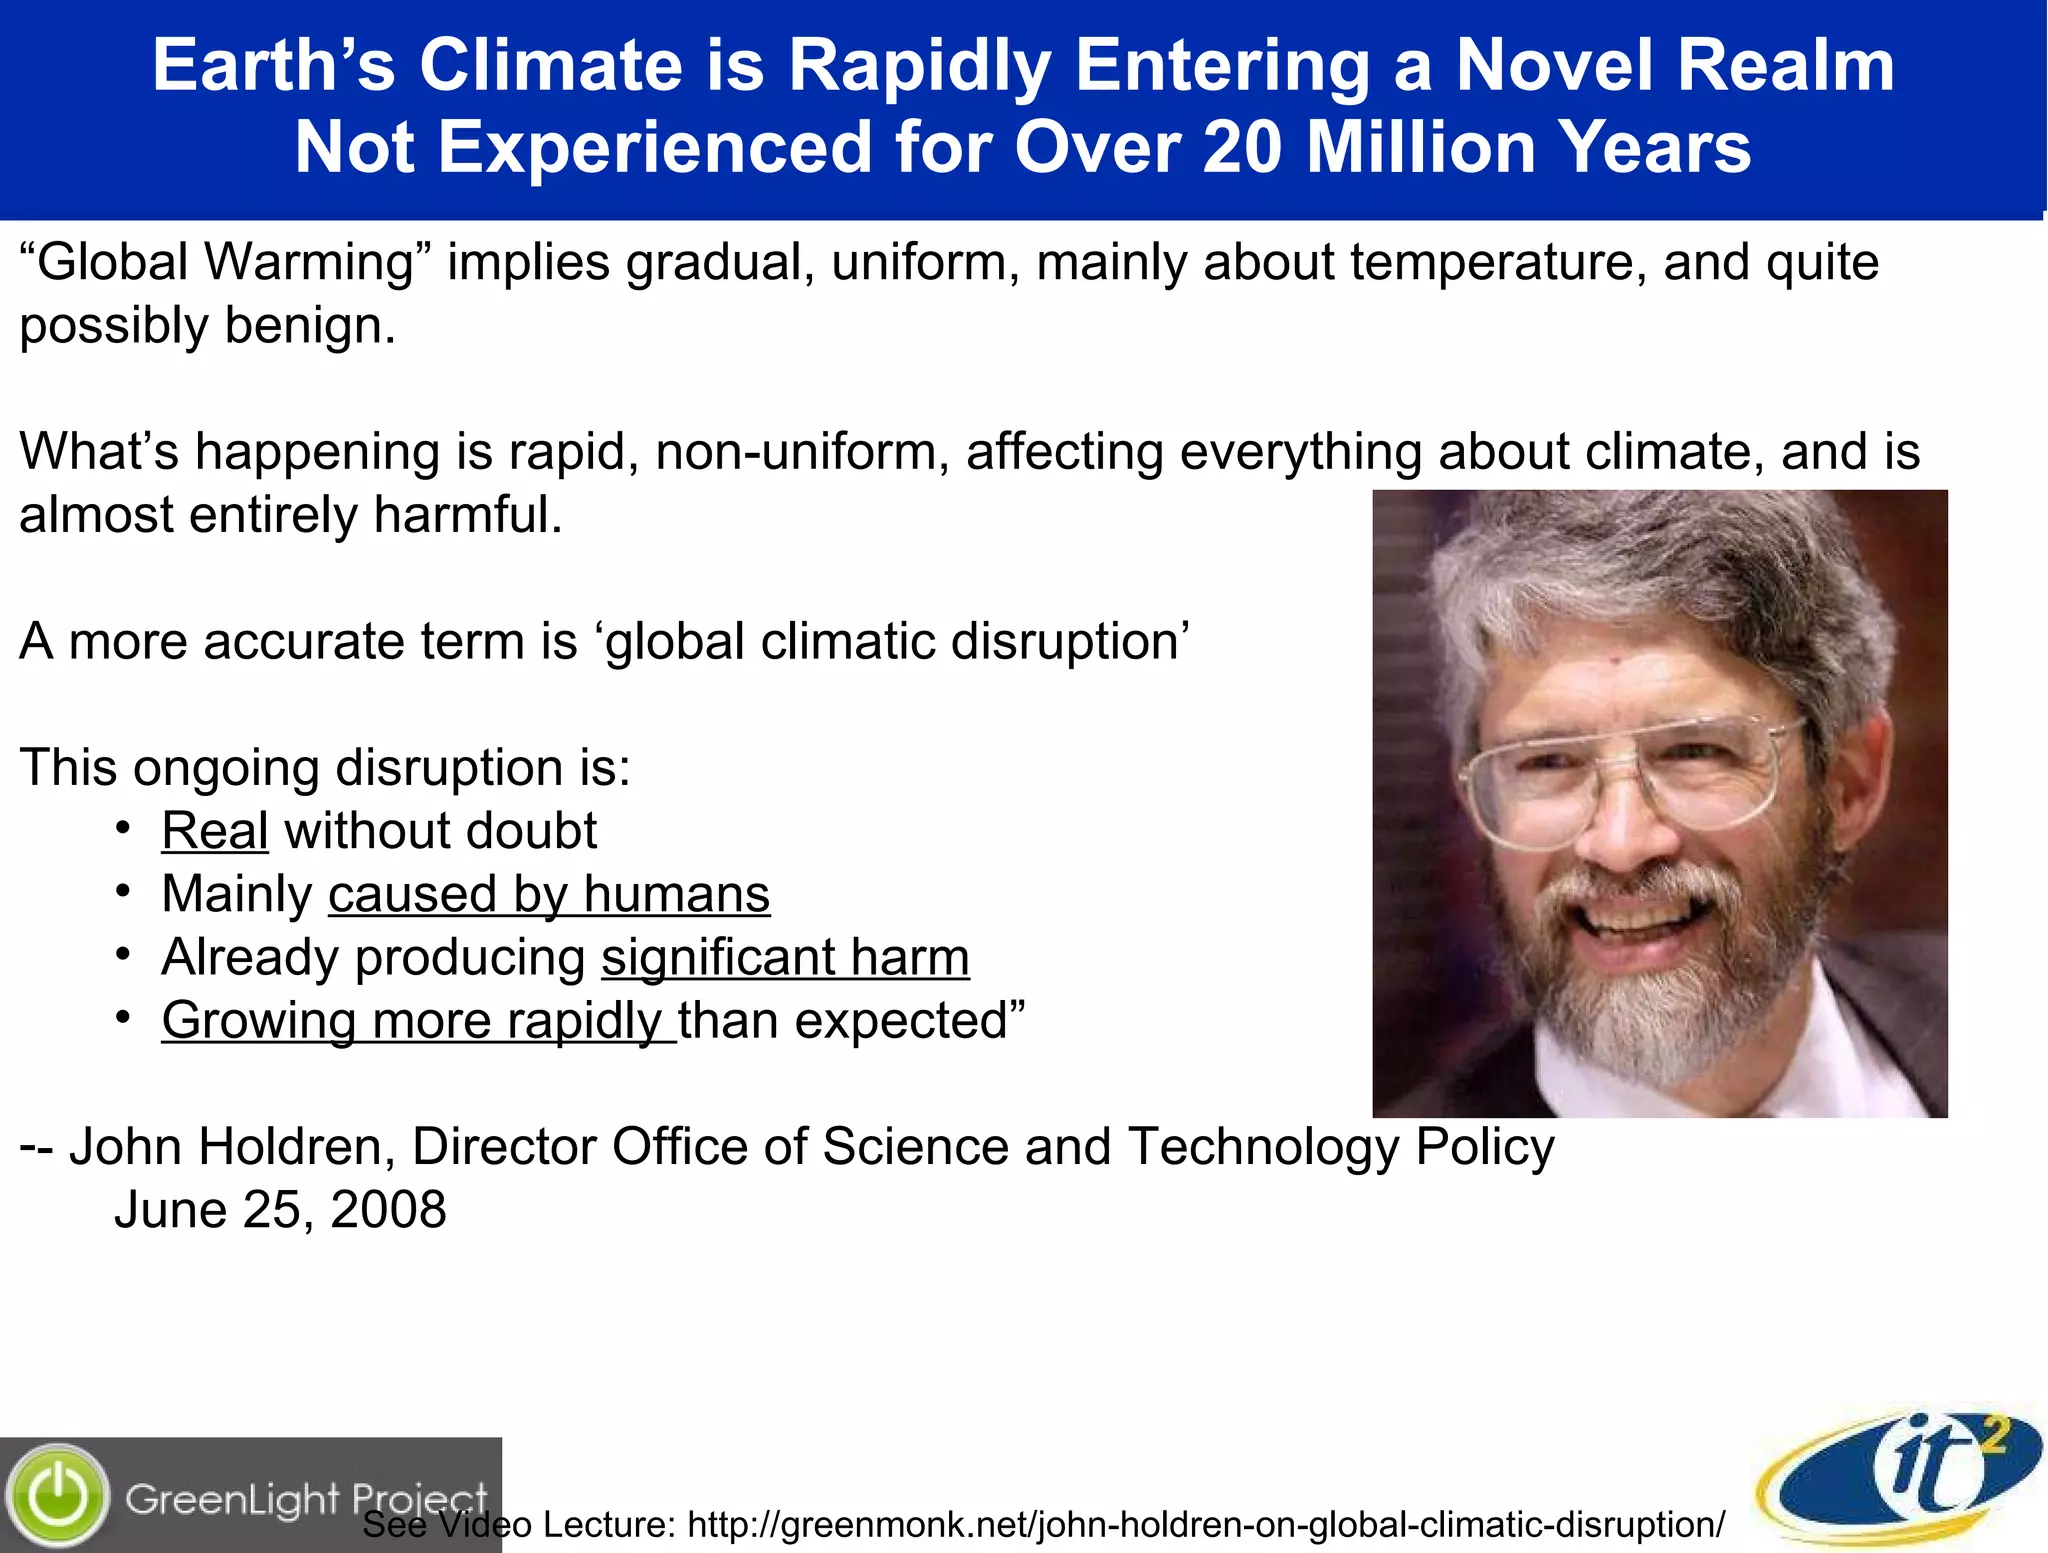
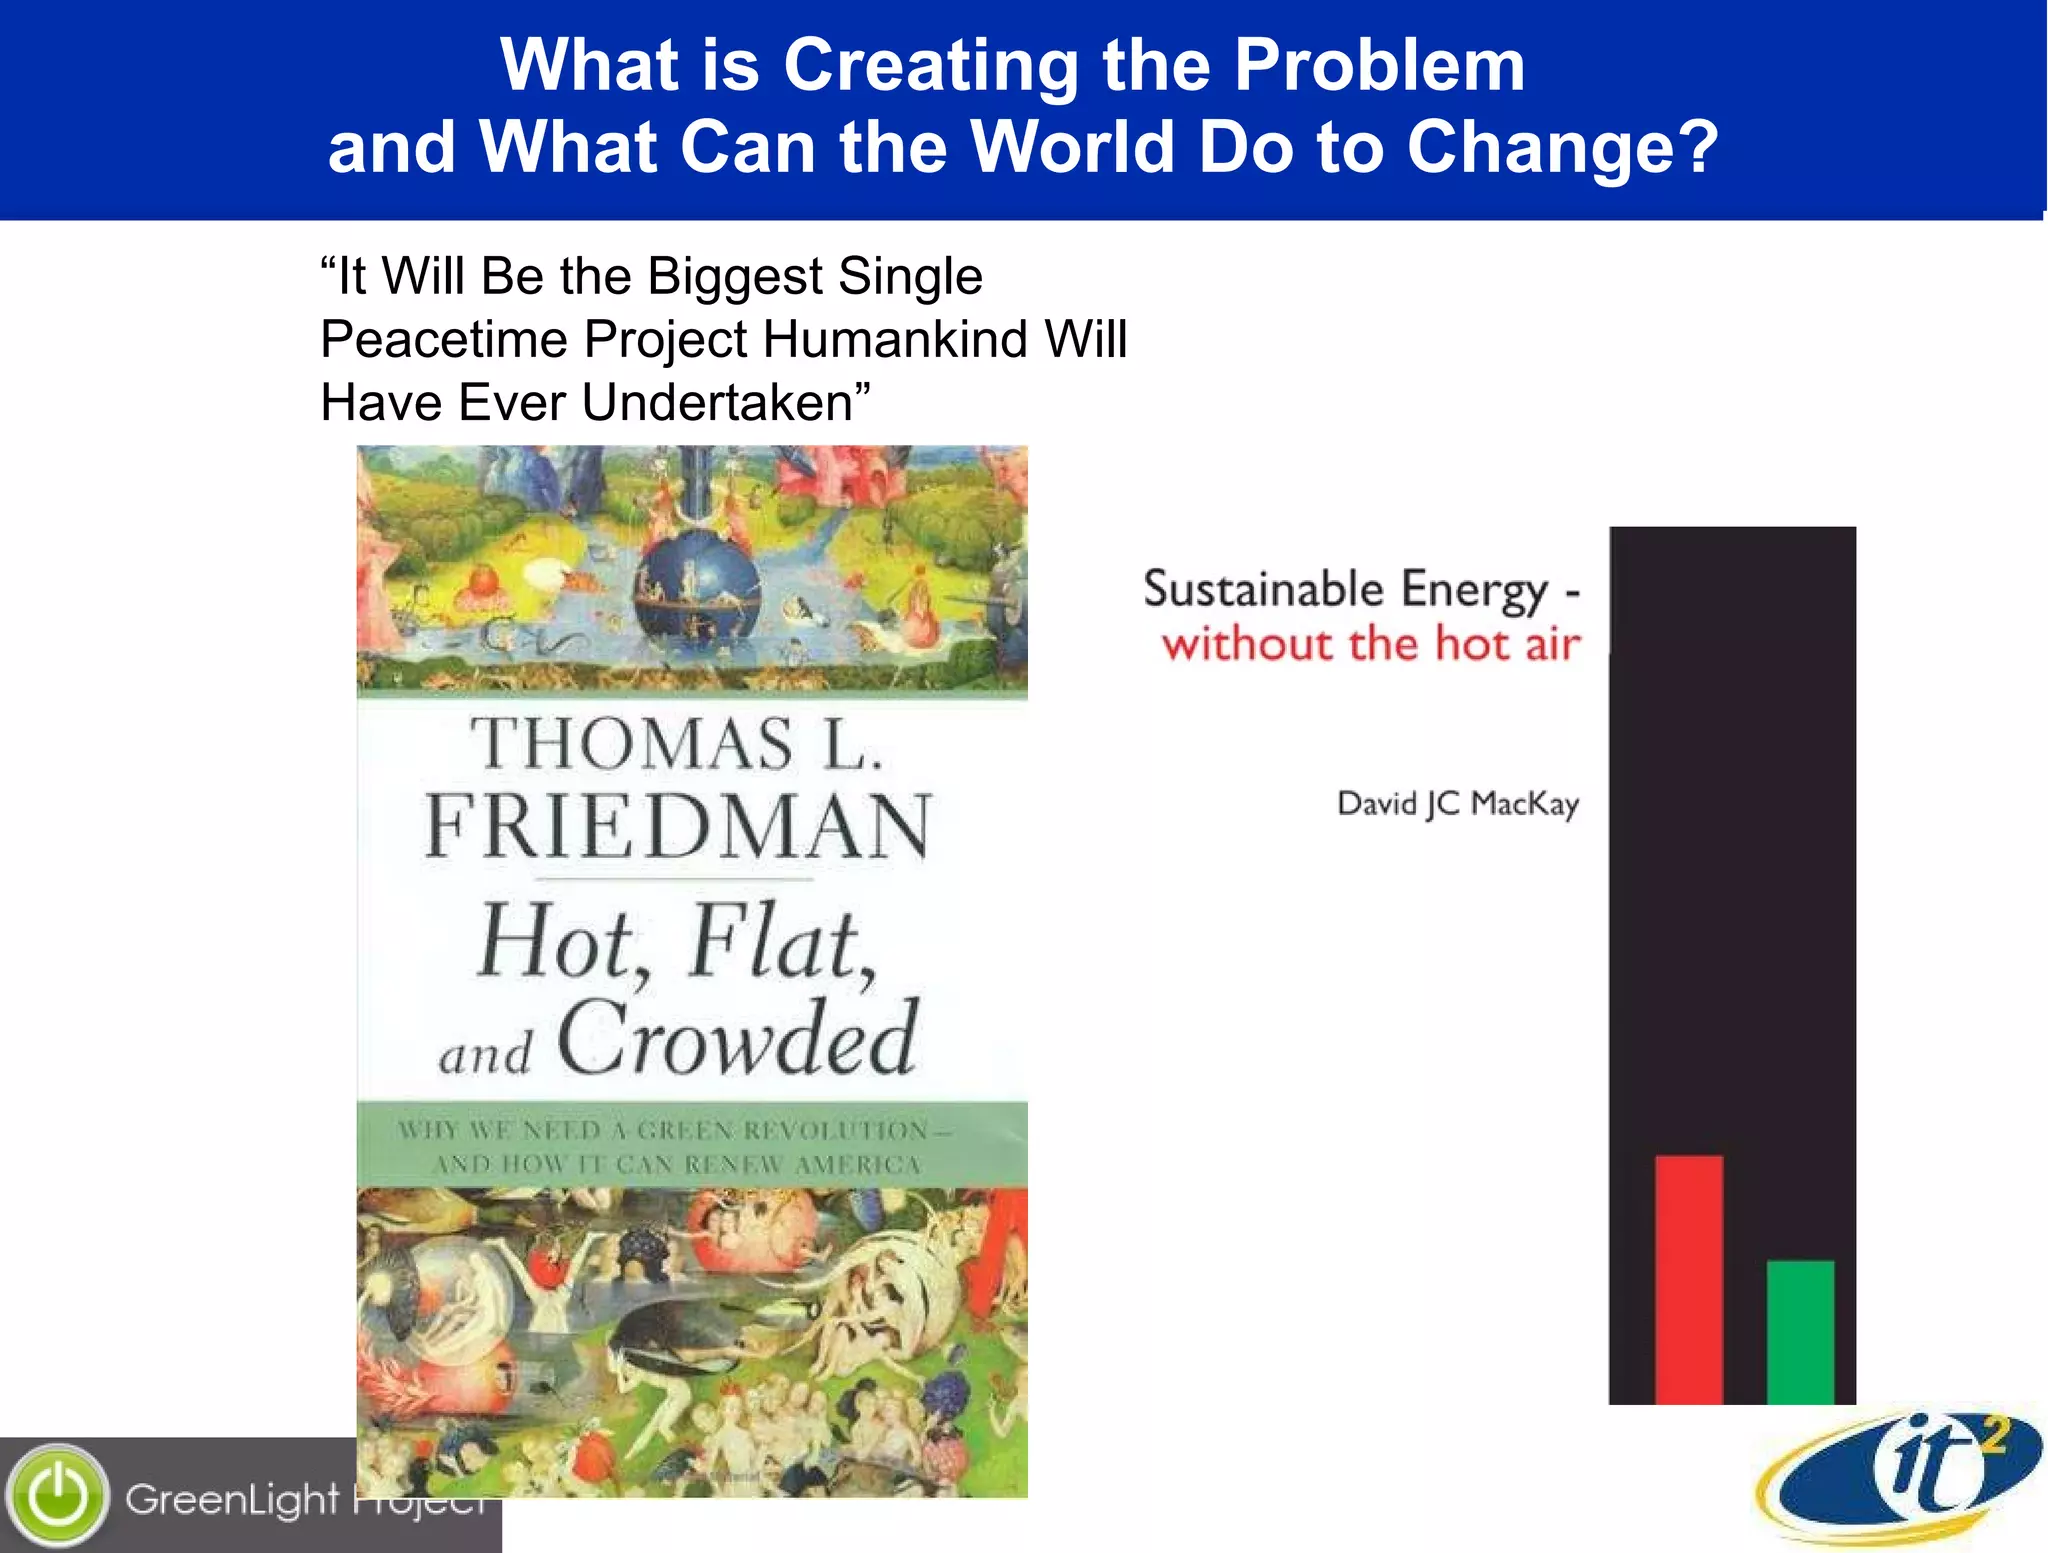
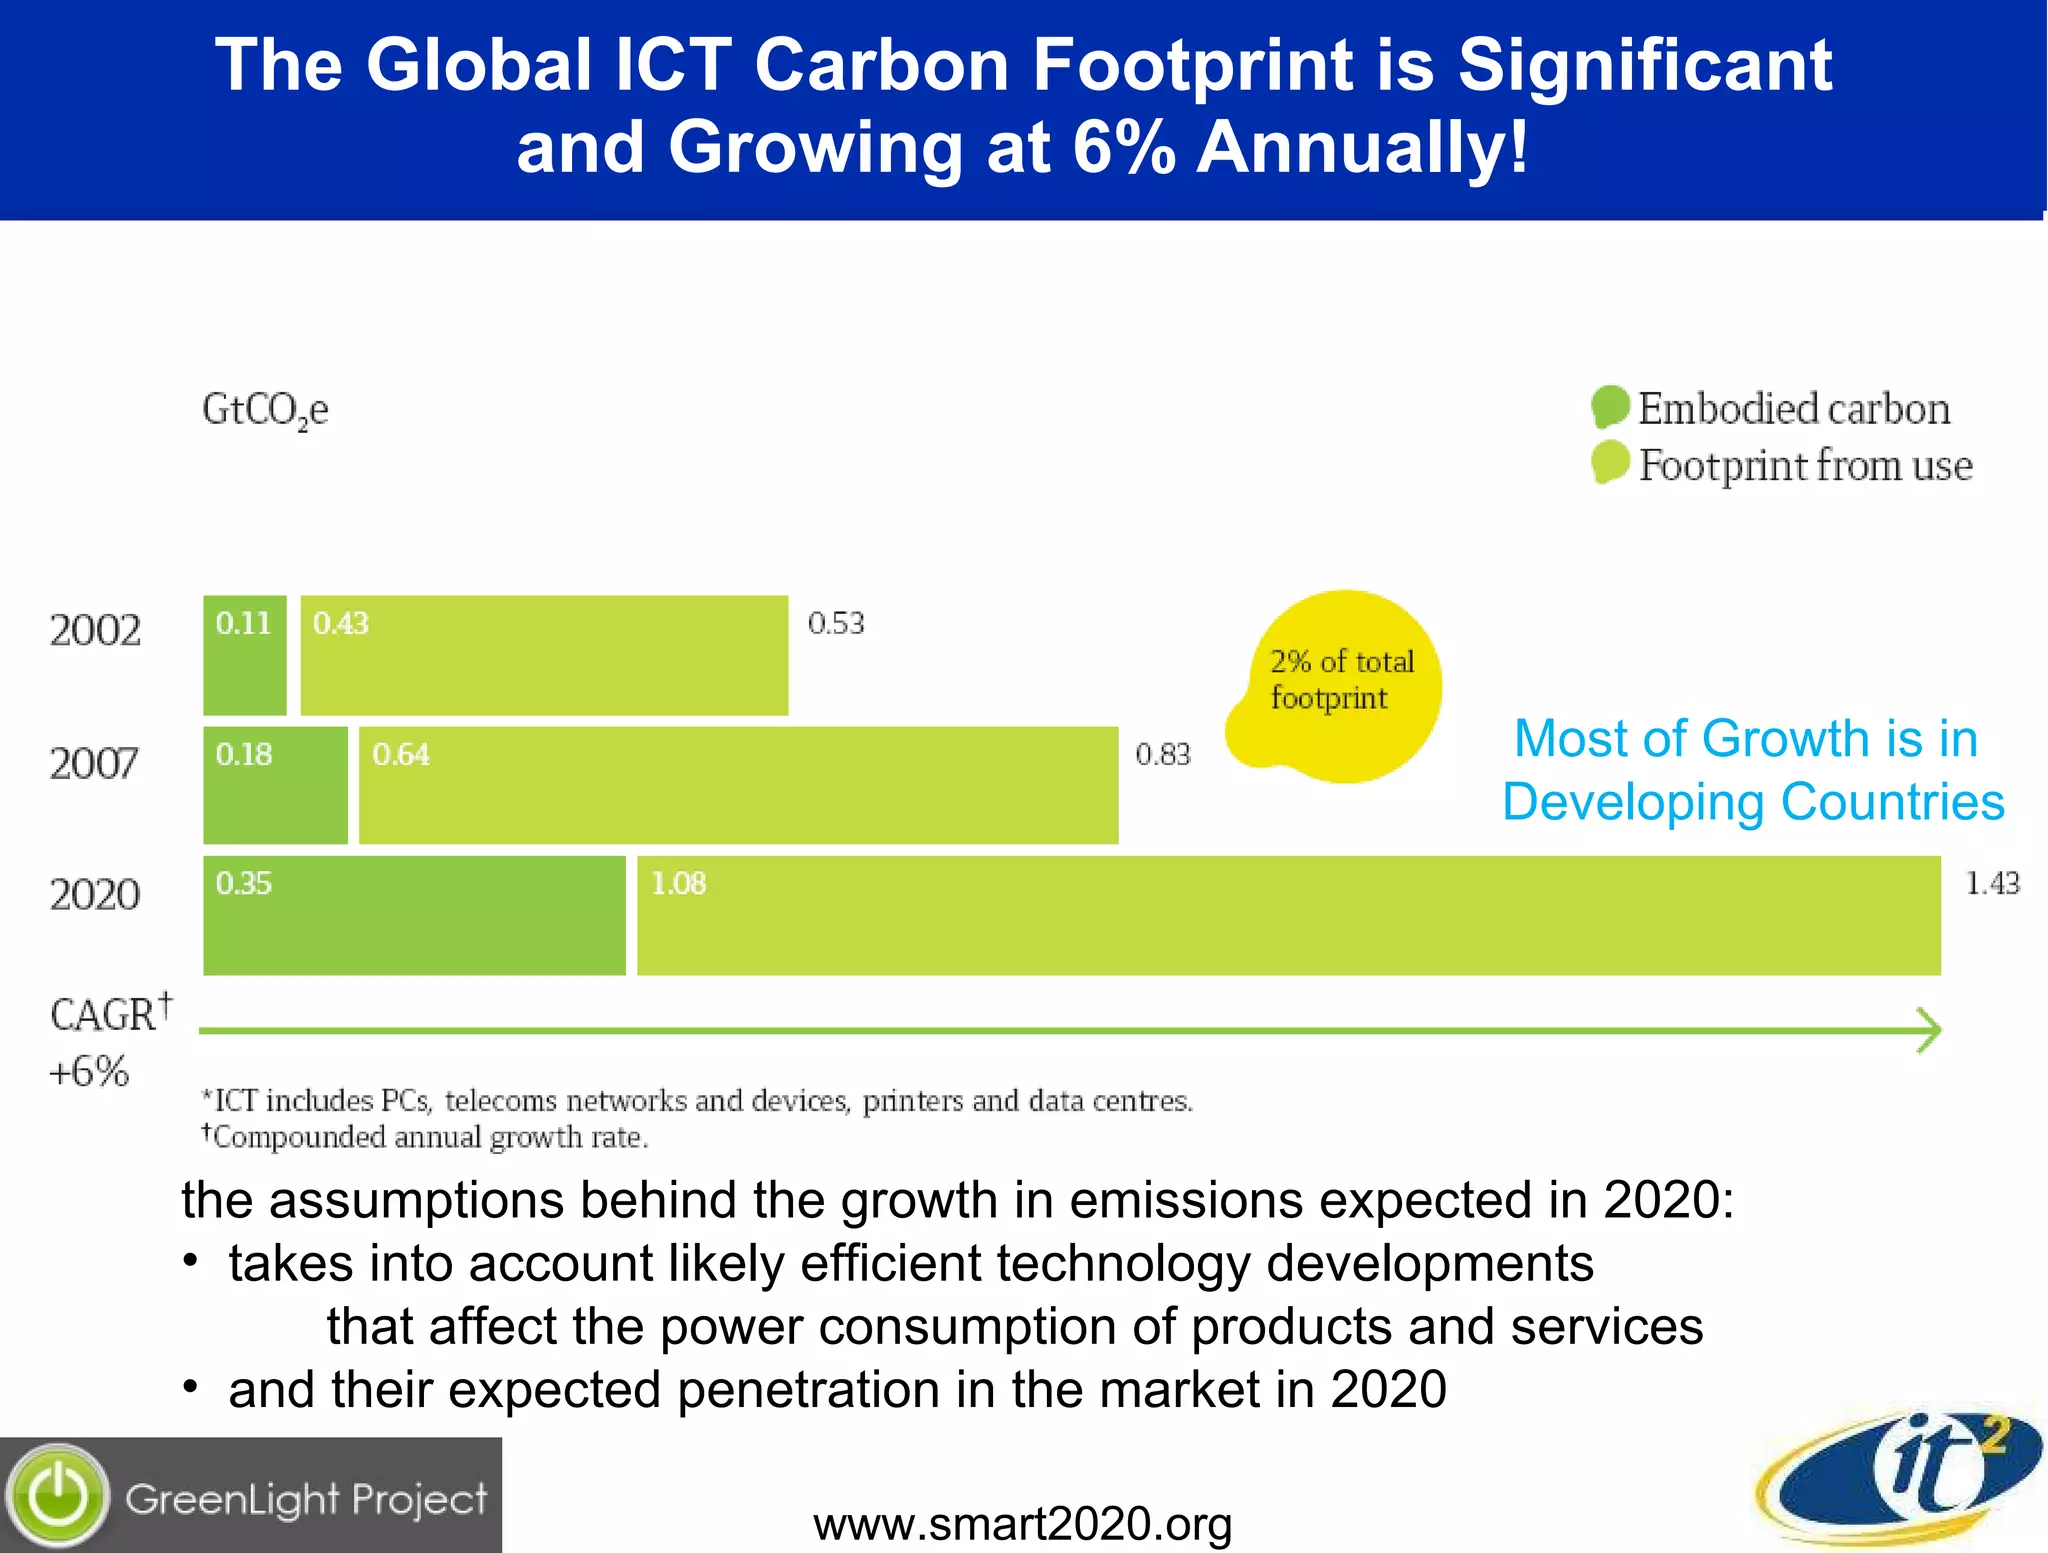
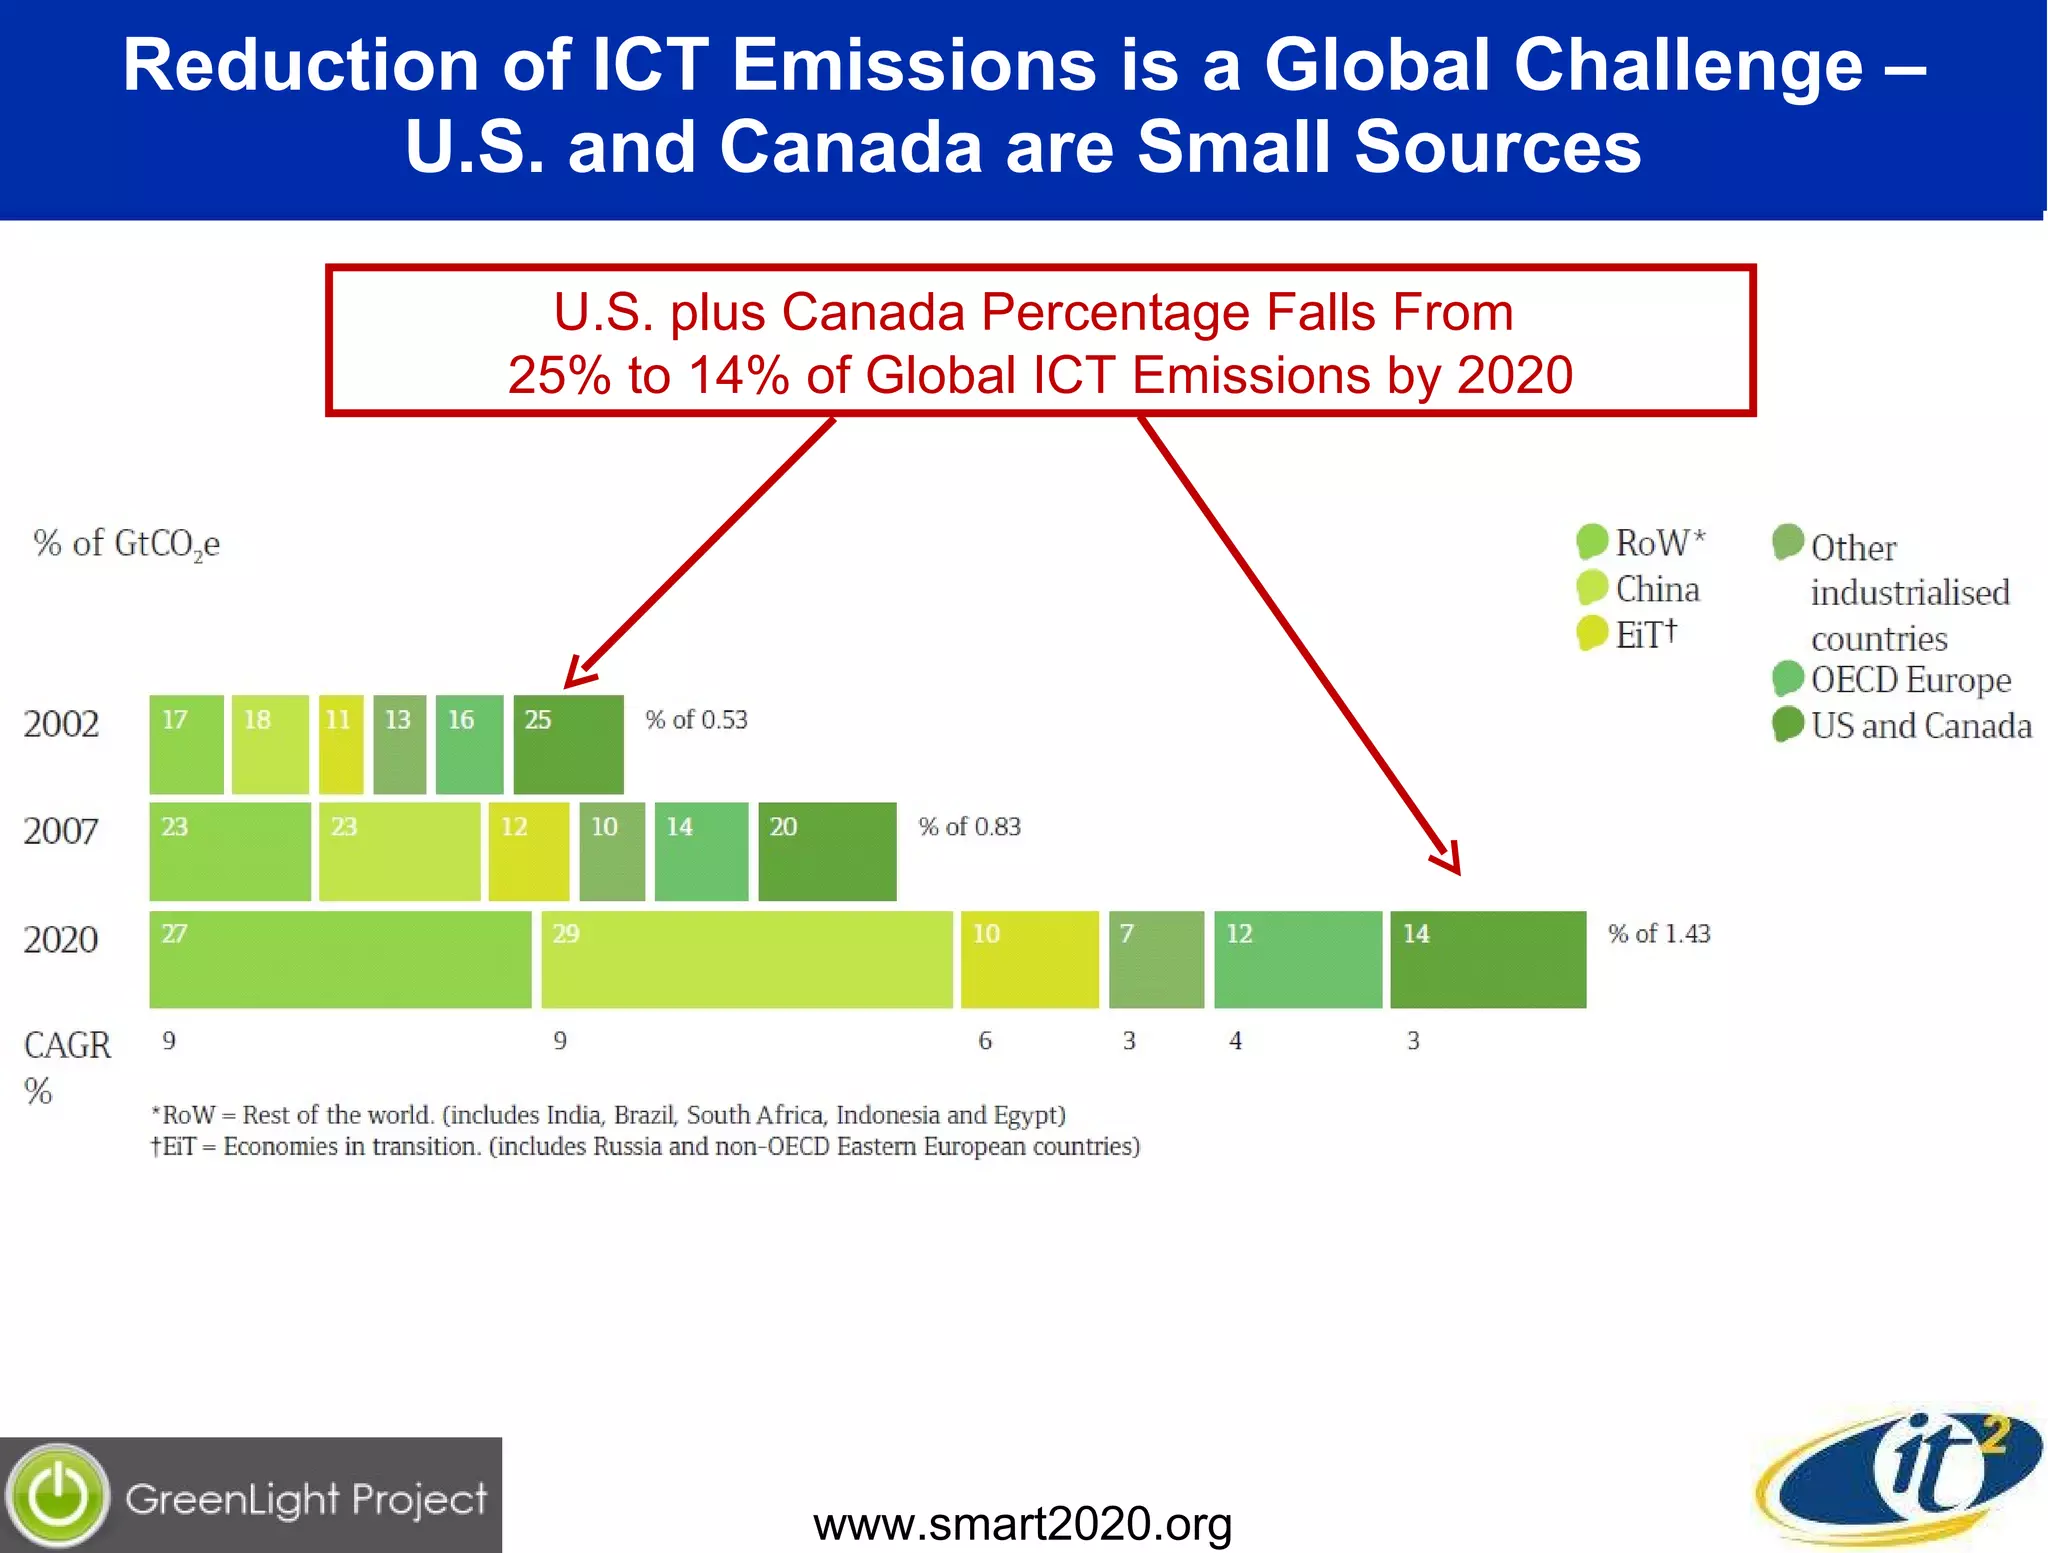
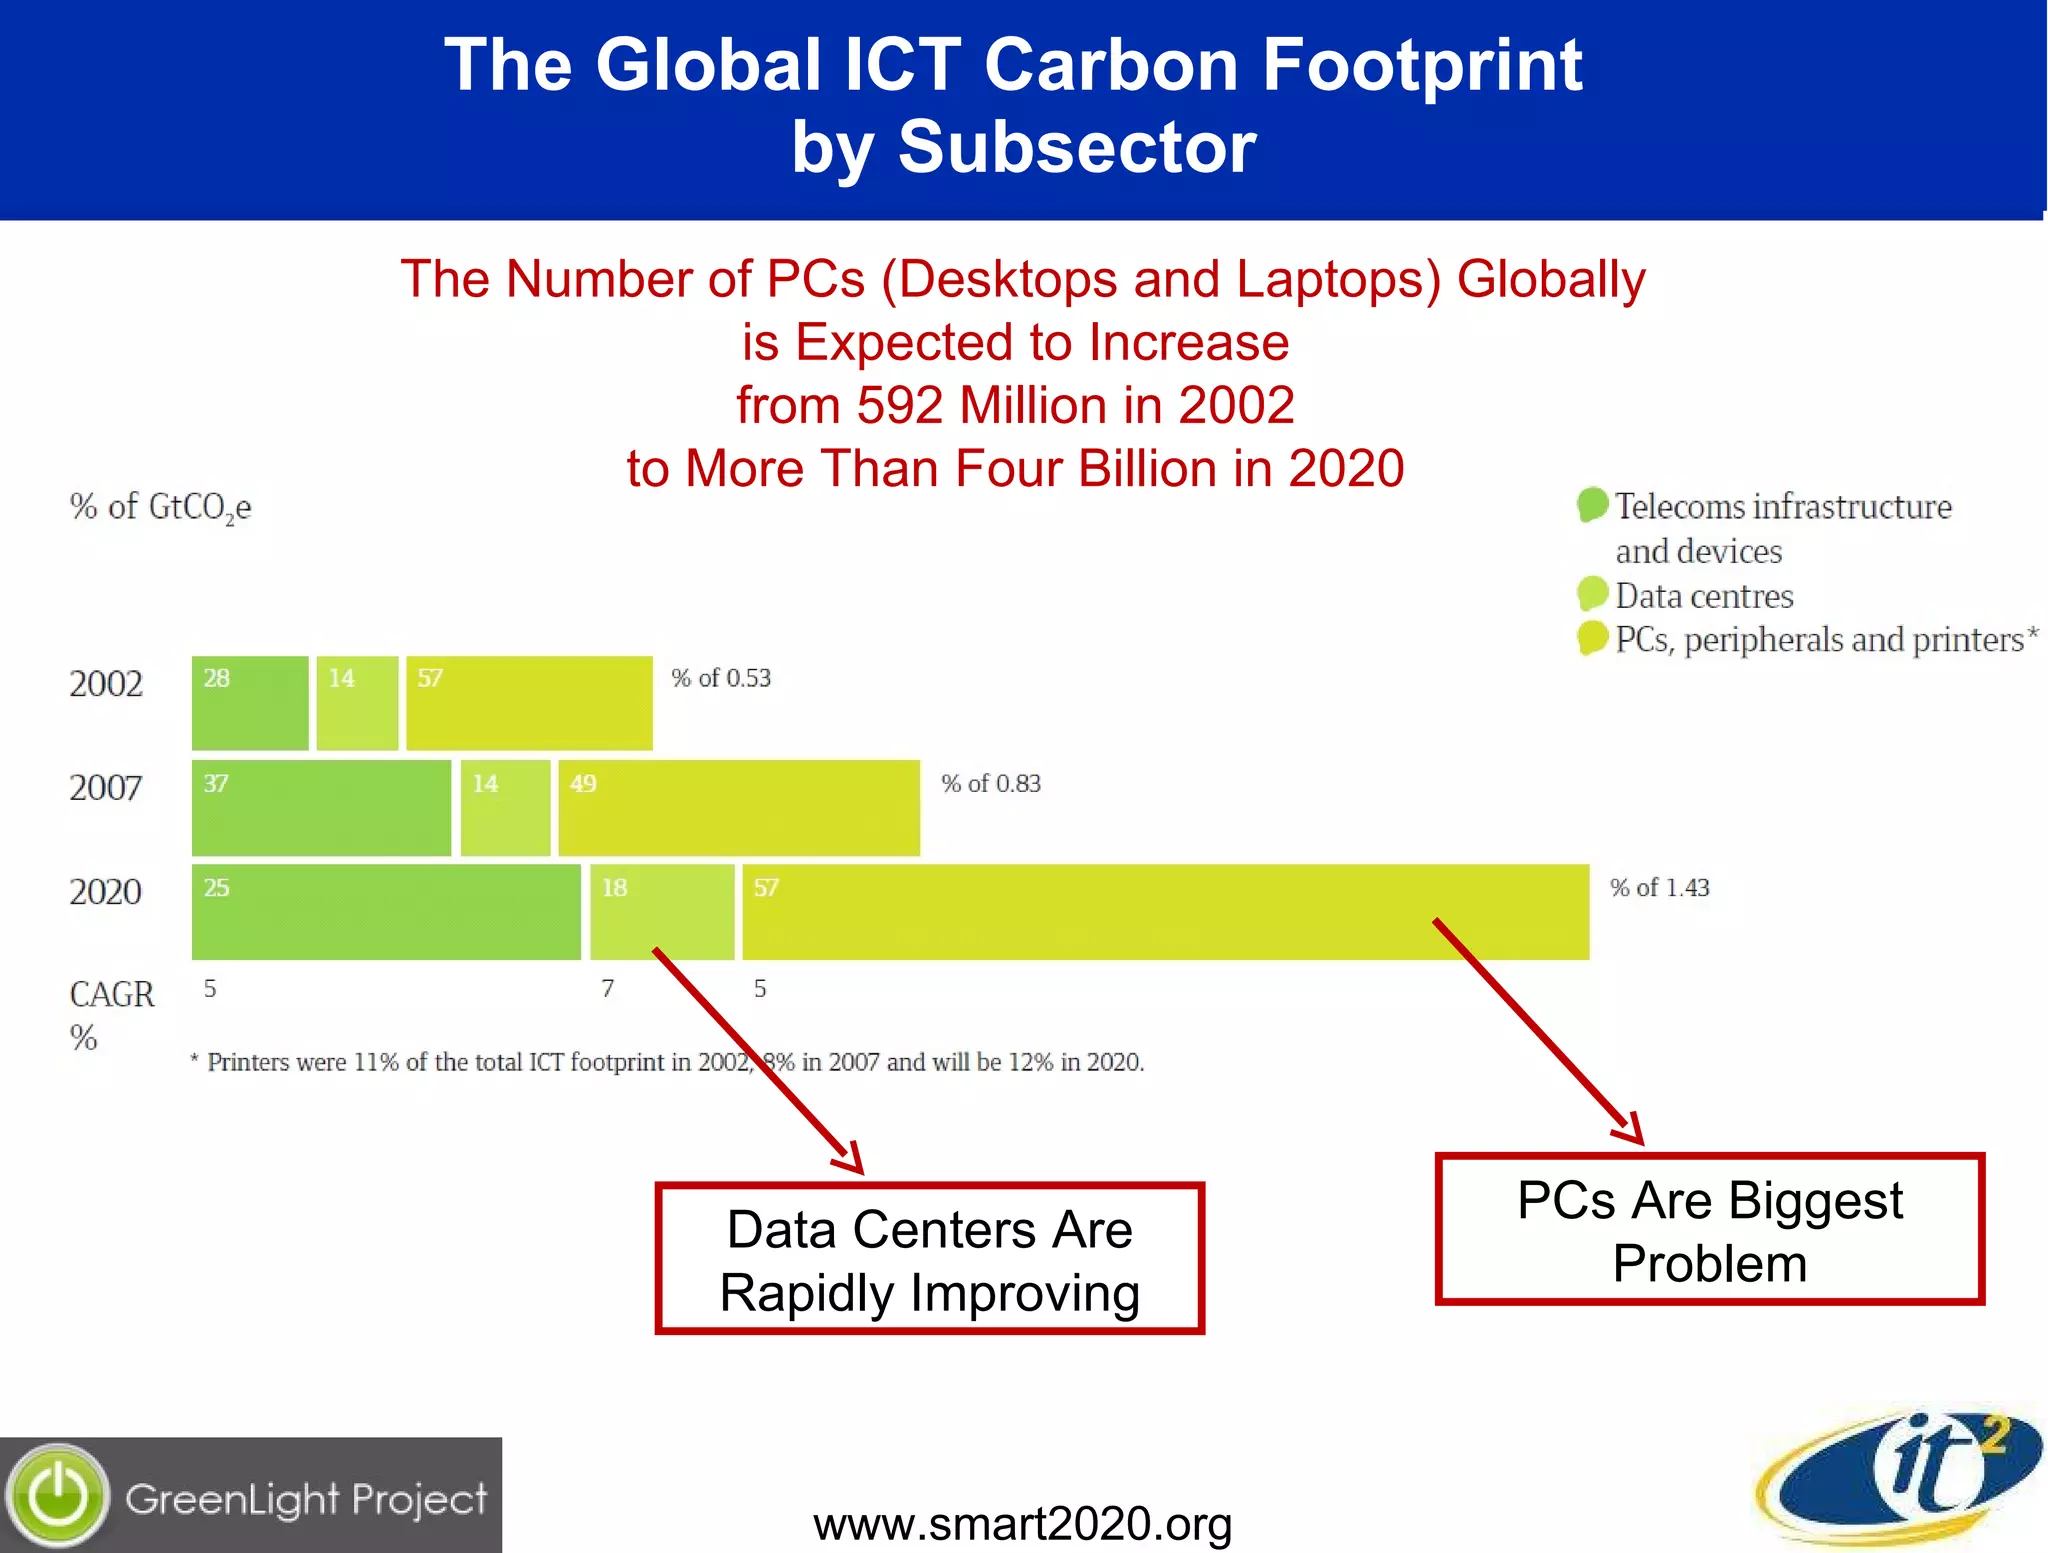
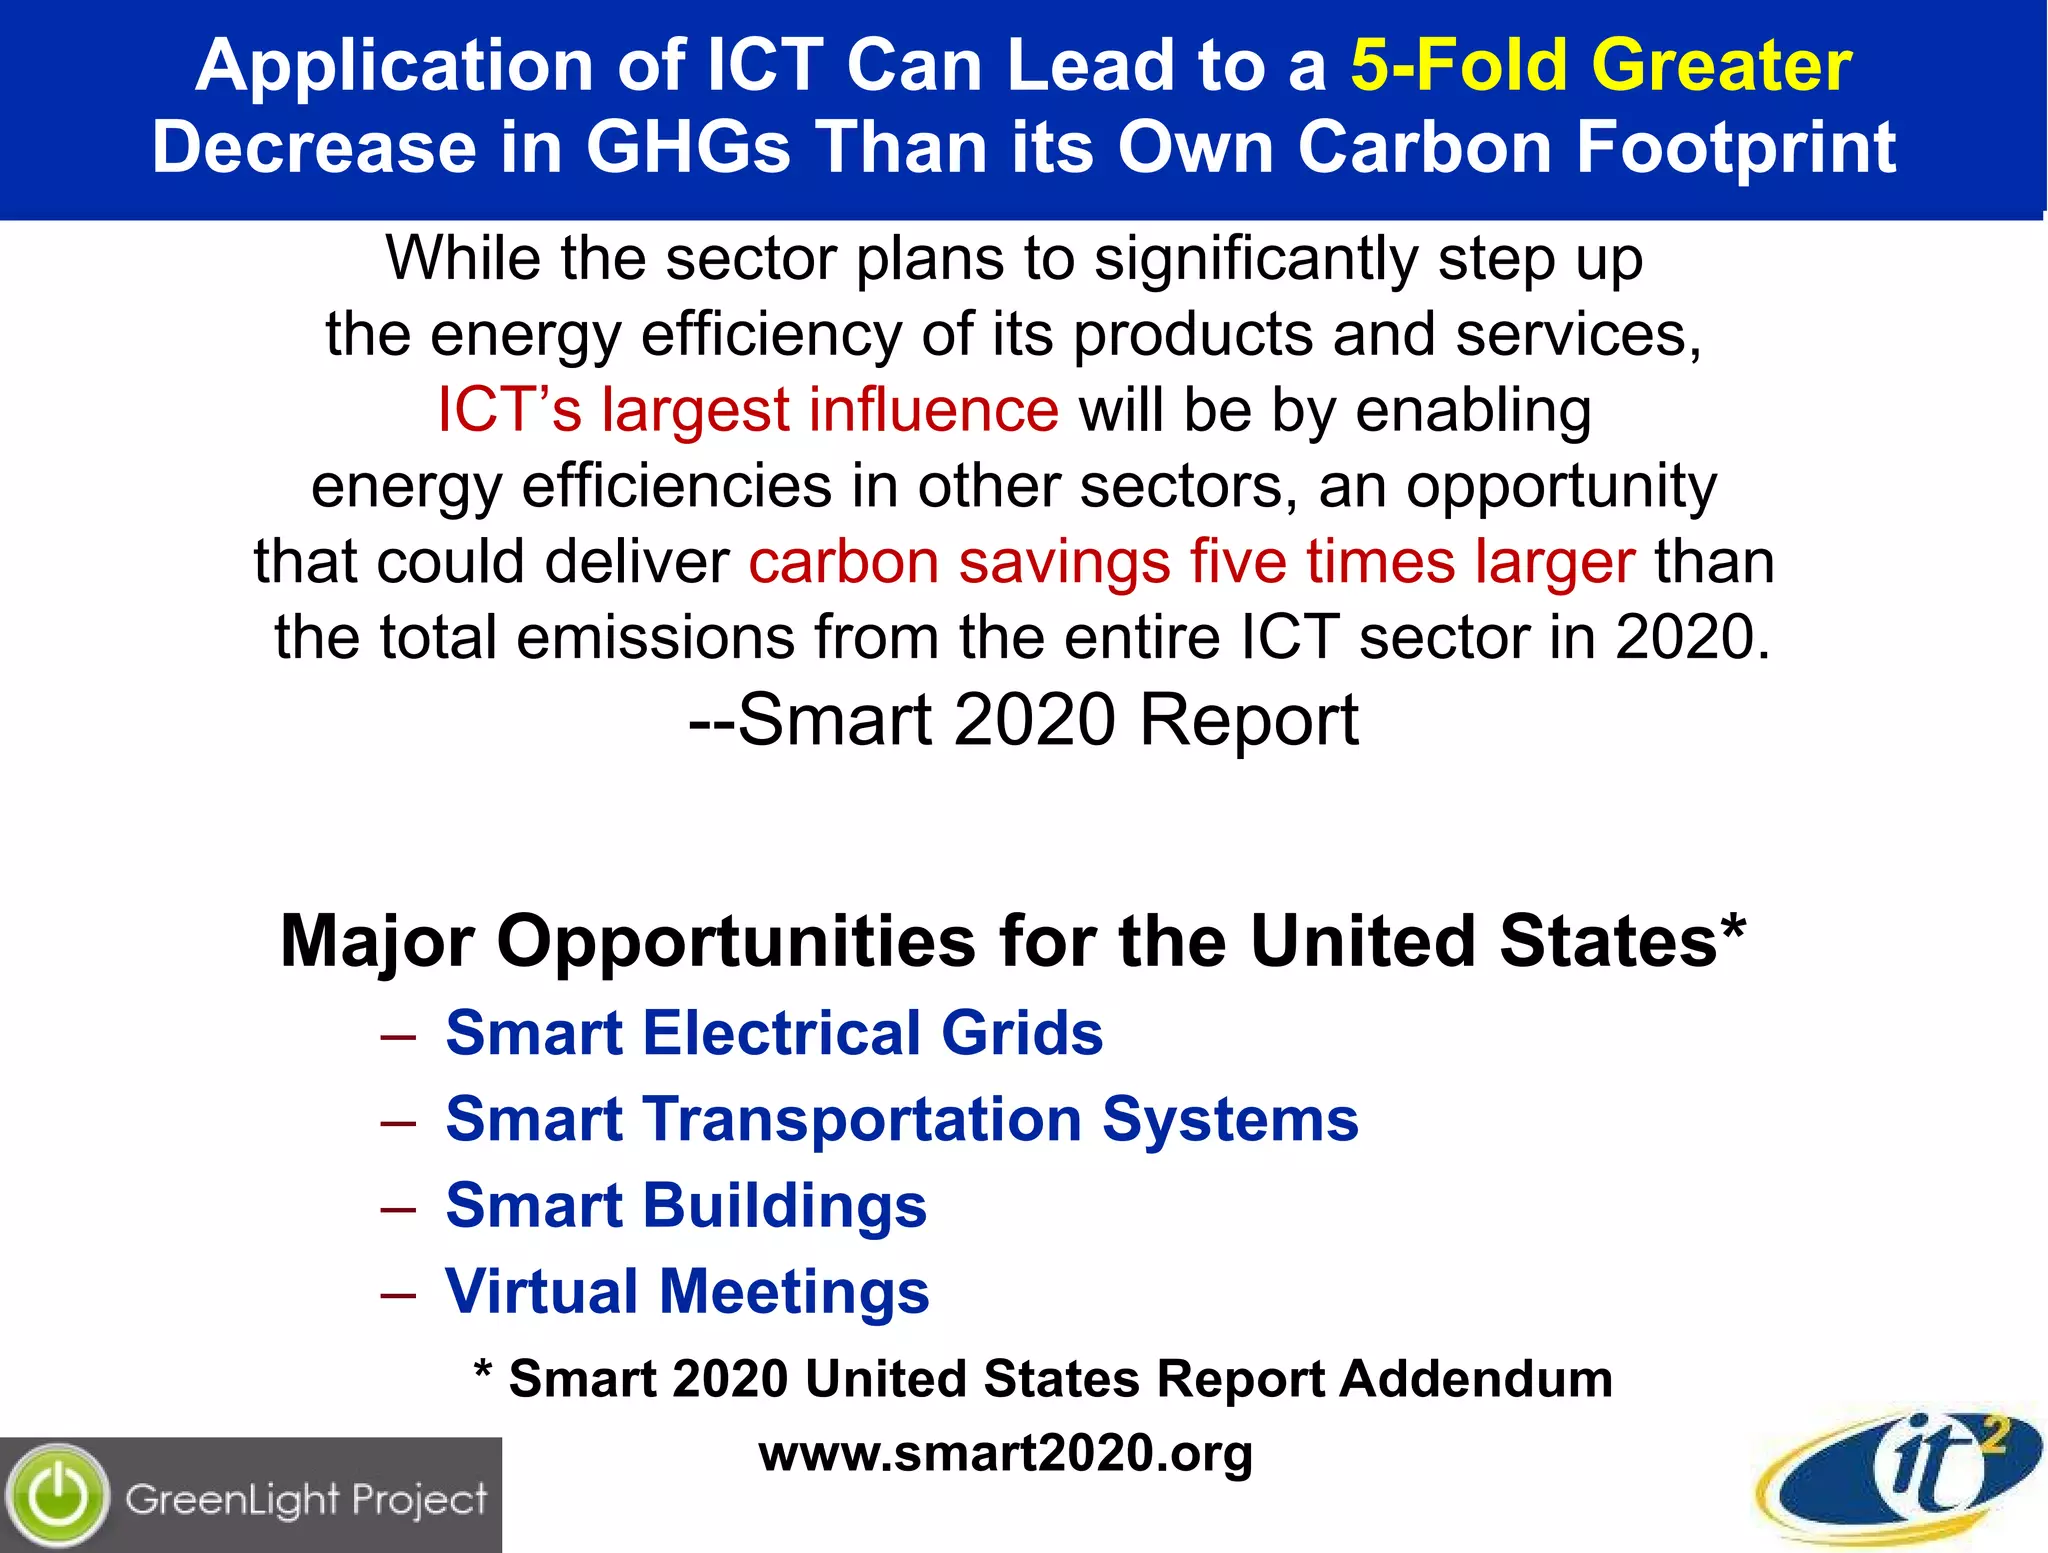
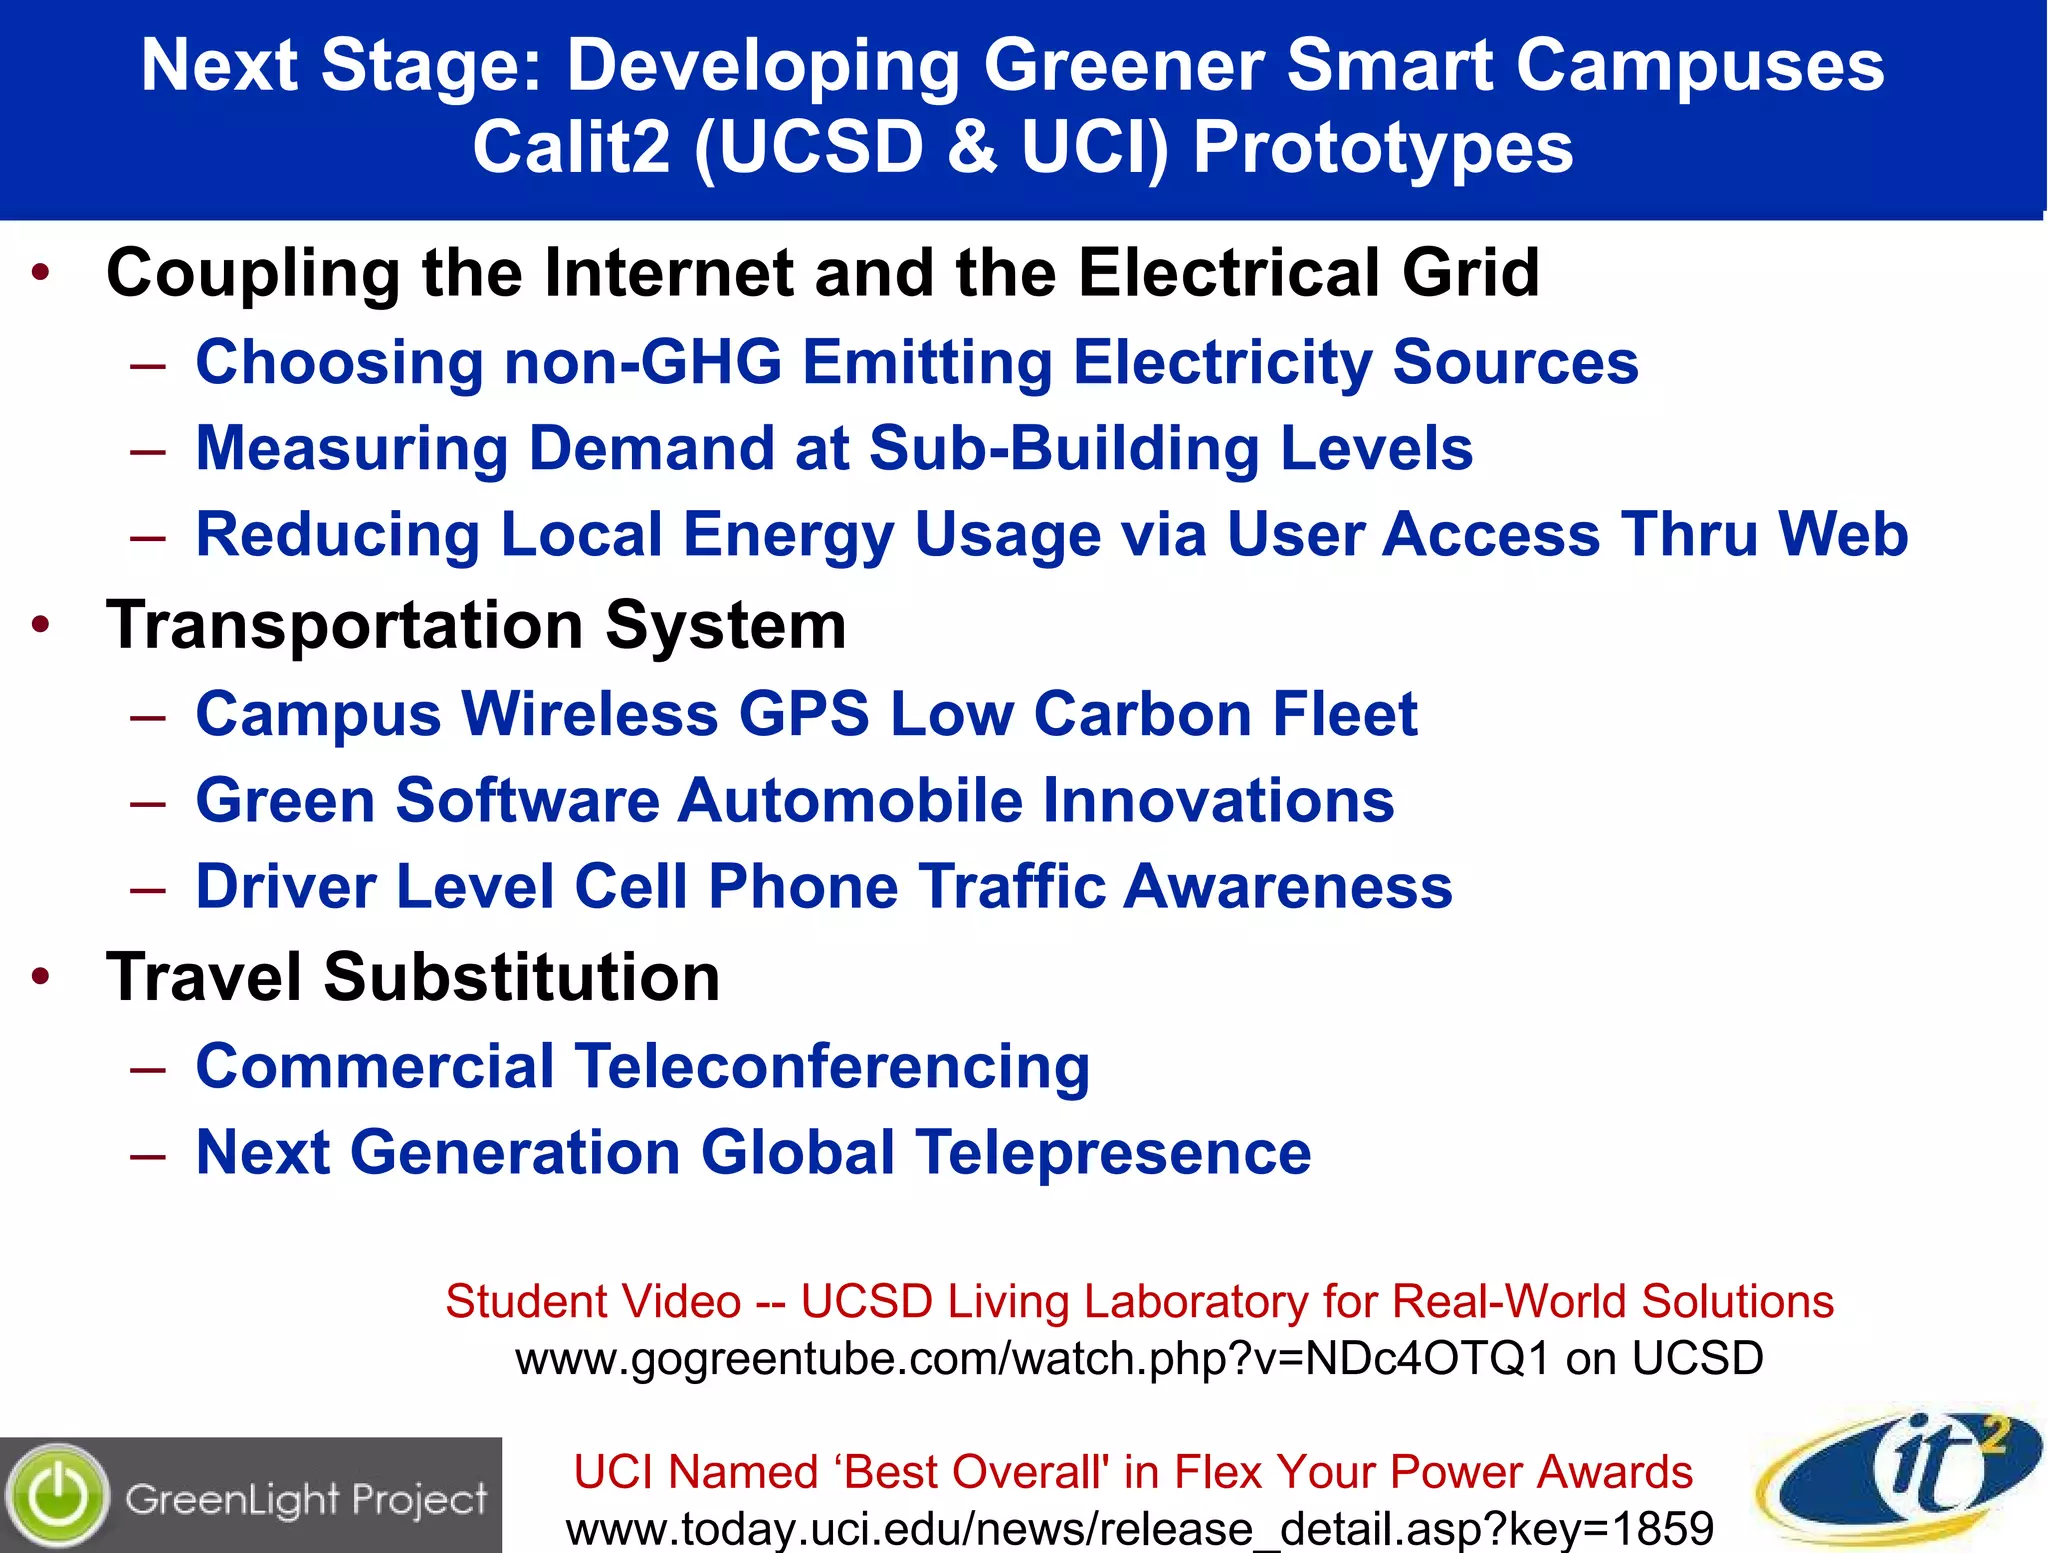
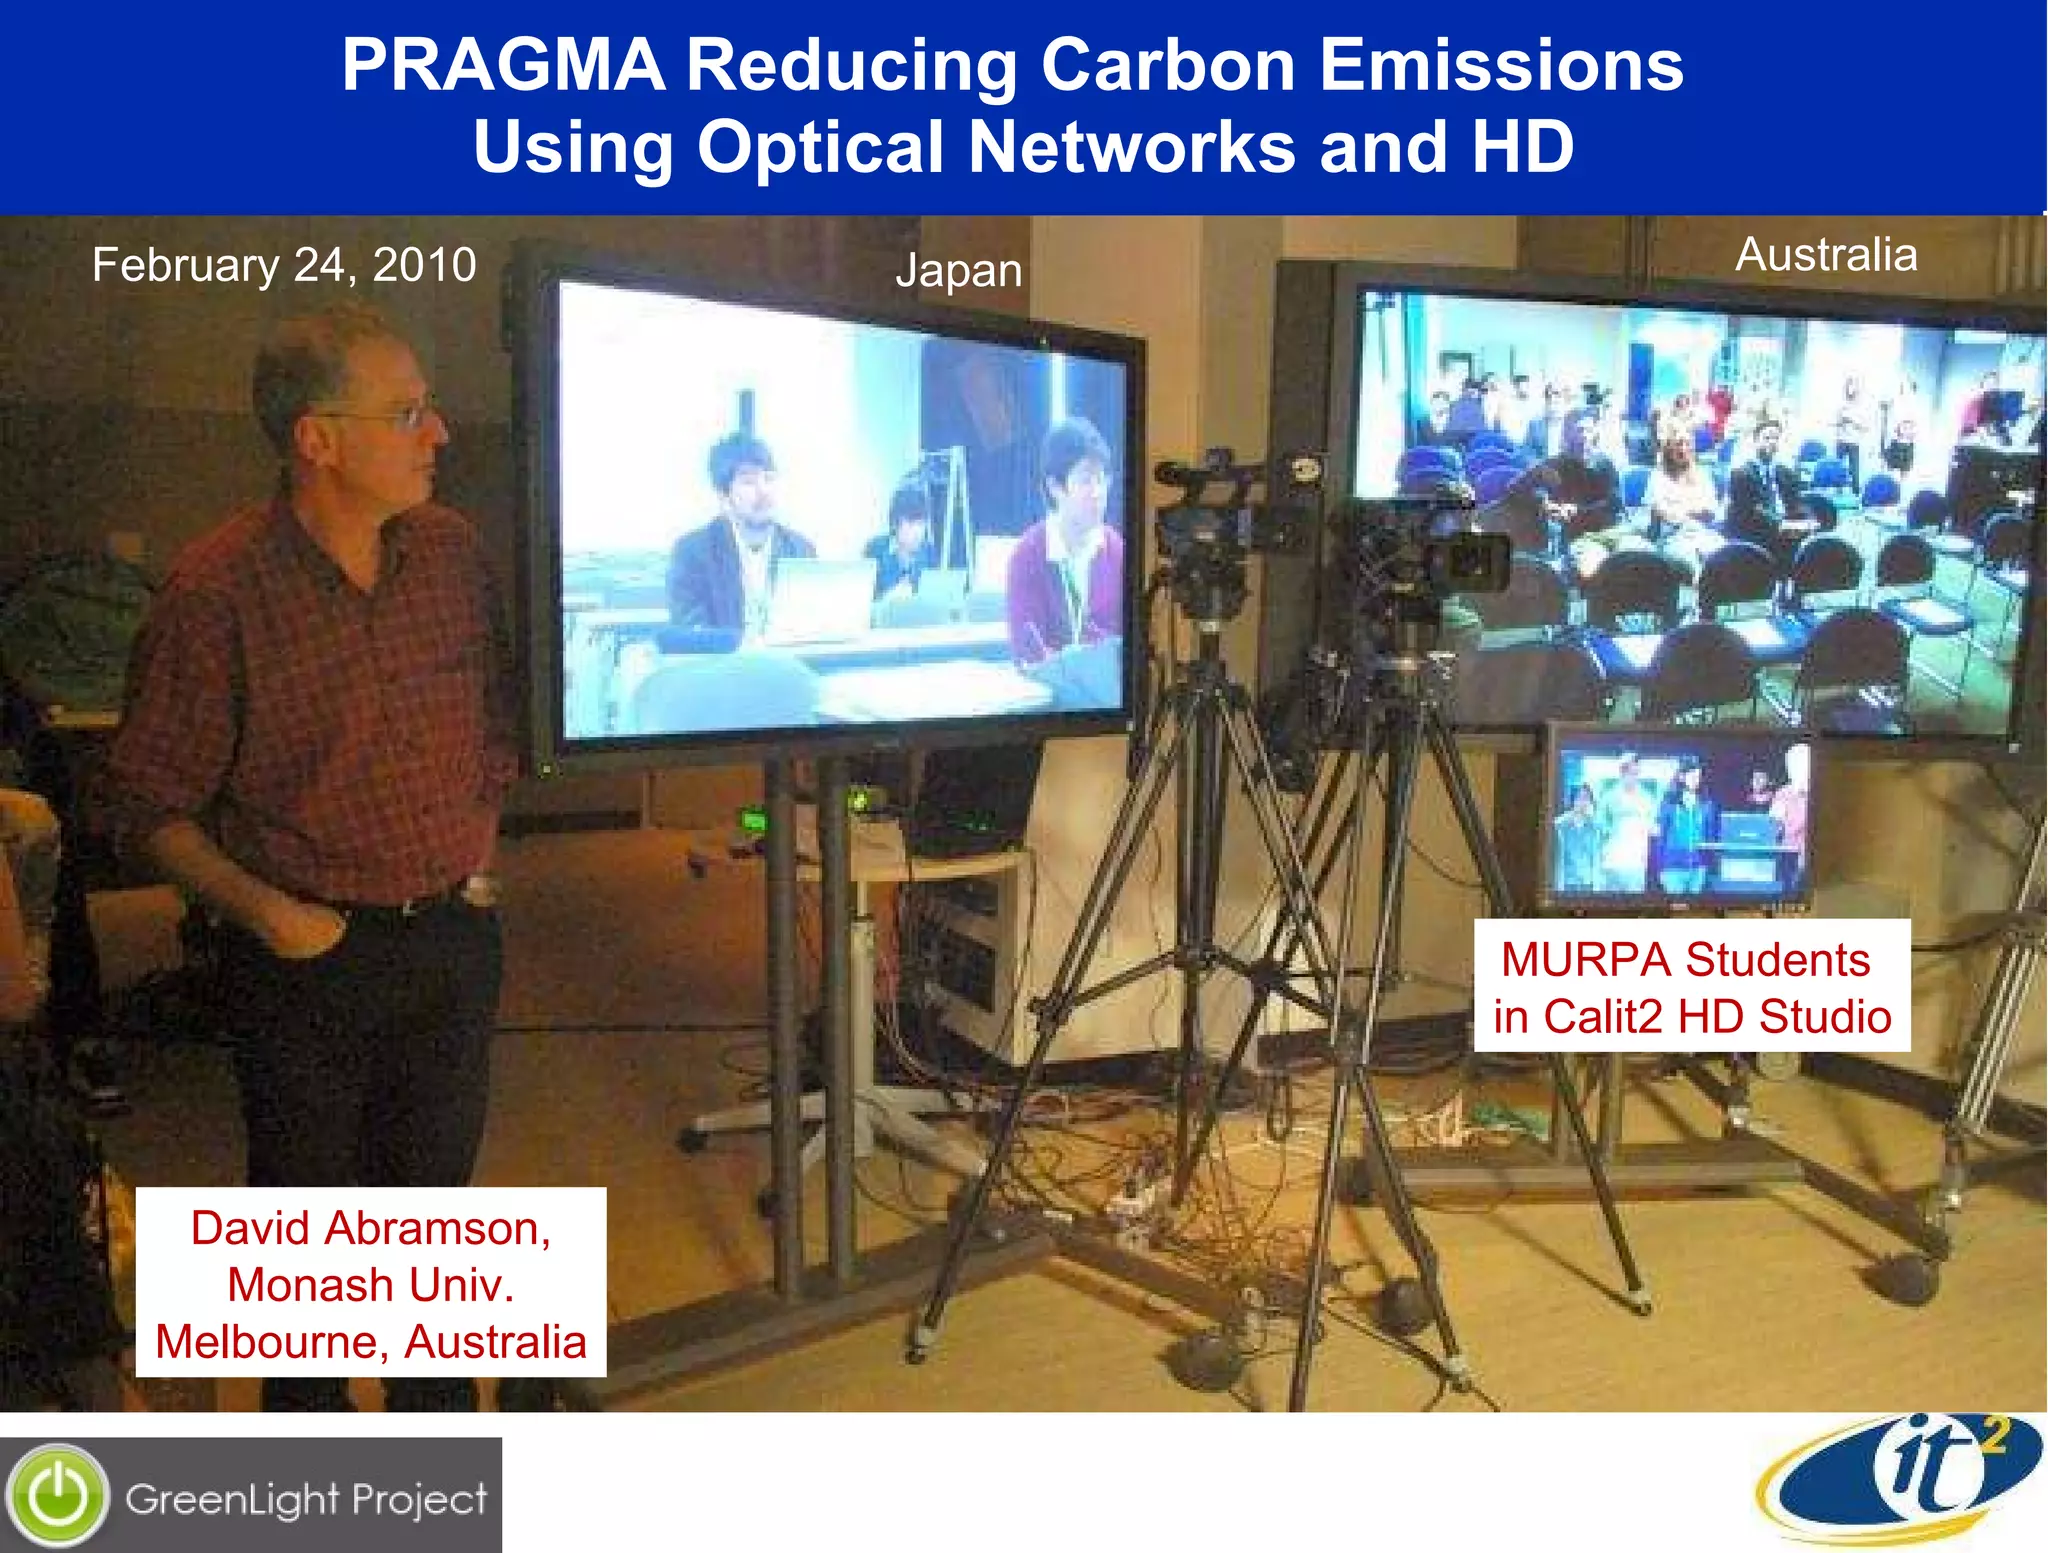

Dr. Larry Smarr's keynote speech discusses how global greenhouse gas emissions are drastically impacting Earth's climate and highlights the urgency of reducing these emissions. He emphasizes the pivotal role of Pacific Rim applications and grid middleware (pragma) in promoting green technology and achieving a low carbon economy. The speech outlines various opportunities for utilizing information and communication technologies (ICT) to significantly mitigate greenhouse gas emissions through innovative solutions like smart grids, buildings, and transportation systems.


