Download to read offline


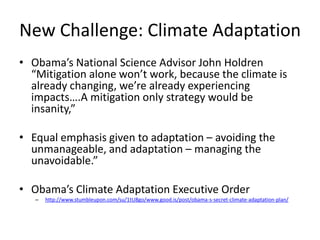


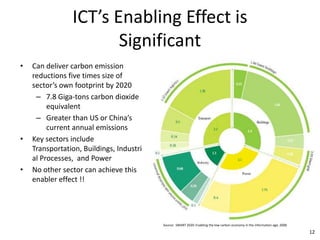


This document summarizes a presentation about using information and communication technologies (ICT) to adapt to rather than mitigate global warming. Some key points: - Mitigation efforts alone will not be enough to address climate change, and adaptation strategies are now needed to survive the impacts. - ICT sector growth is contributing to energy demand and emissions but can also provide solutions if designed to use renewable energy not connected to the grid. - Examples of ICT adaptation solutions proposed include building an "Energy Internet" and moving data centers to remote renewable energy sites instead of cities. - Rewarding carbon reductions through ICT services like broadband could be an alternative to carbon taxes.


