Downloaded 12 times

![Symposia on Green ICT: Greening ICT and Applying ICT to Green Infrastructures [email_address] Webcasts Available at: www.calit2.net/newsroom/article.php?id=1456 www.calit2.net/newsroom/article.php?id=1498](https://image.slidesharecdn.com/att072810-100813004254-phpapp02/75/Sustainable-Computing-and-Telecom-Can-Contribute-to-Limiting-Global-Climatic-Disruption-48-2048.jpg)

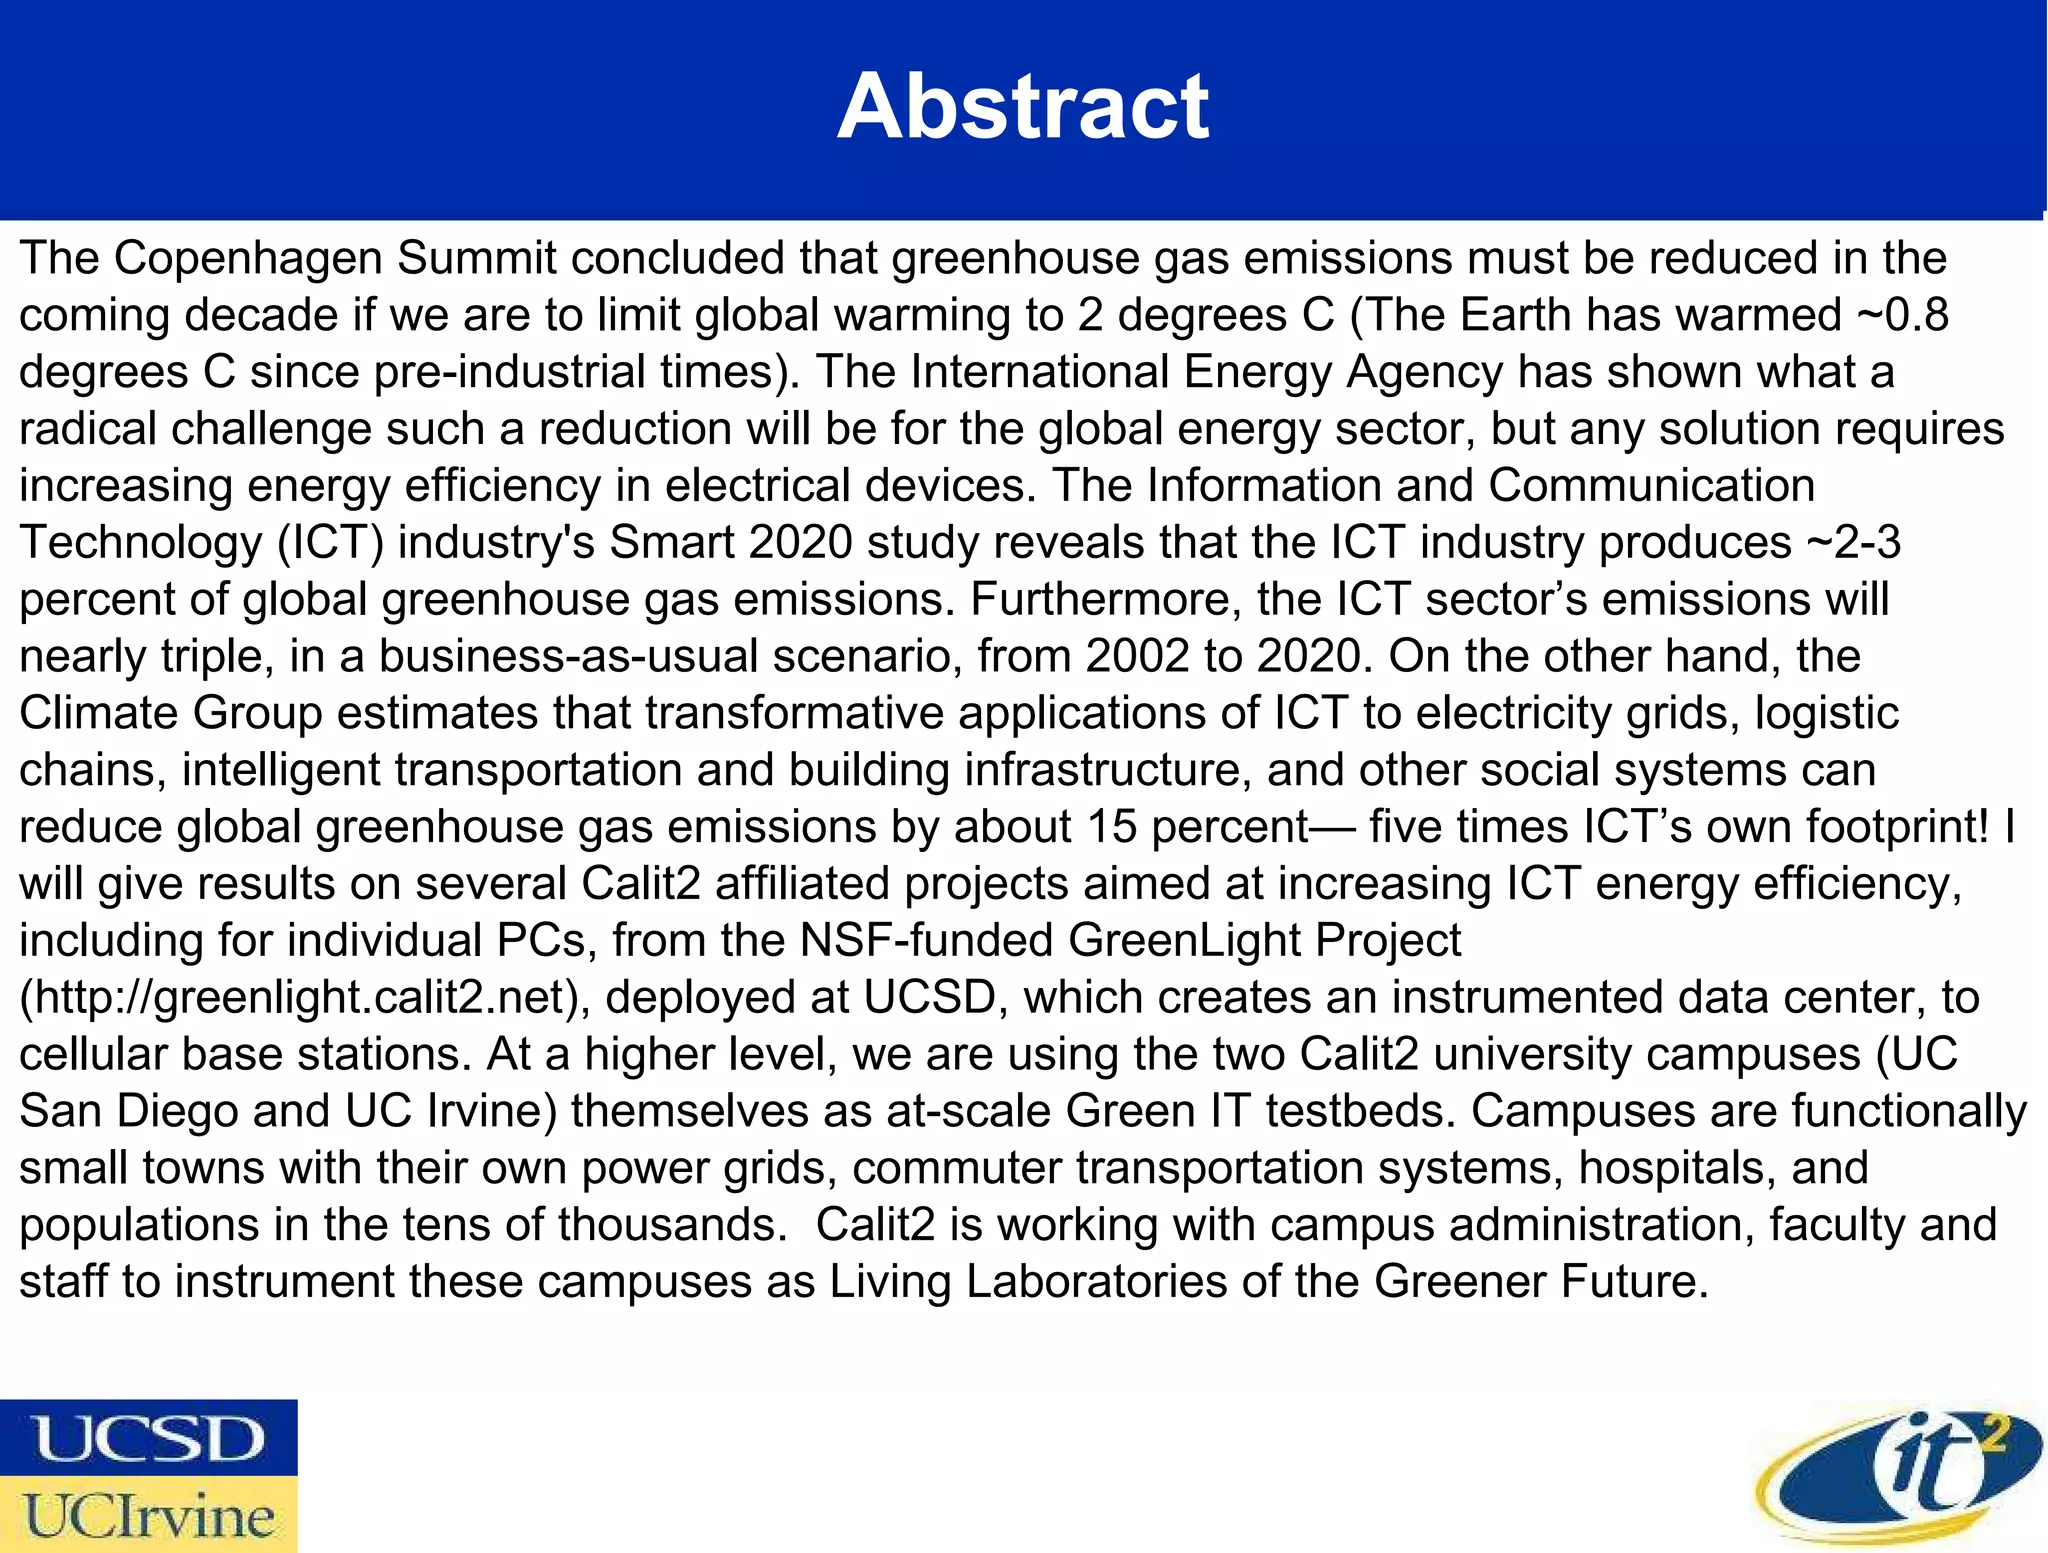
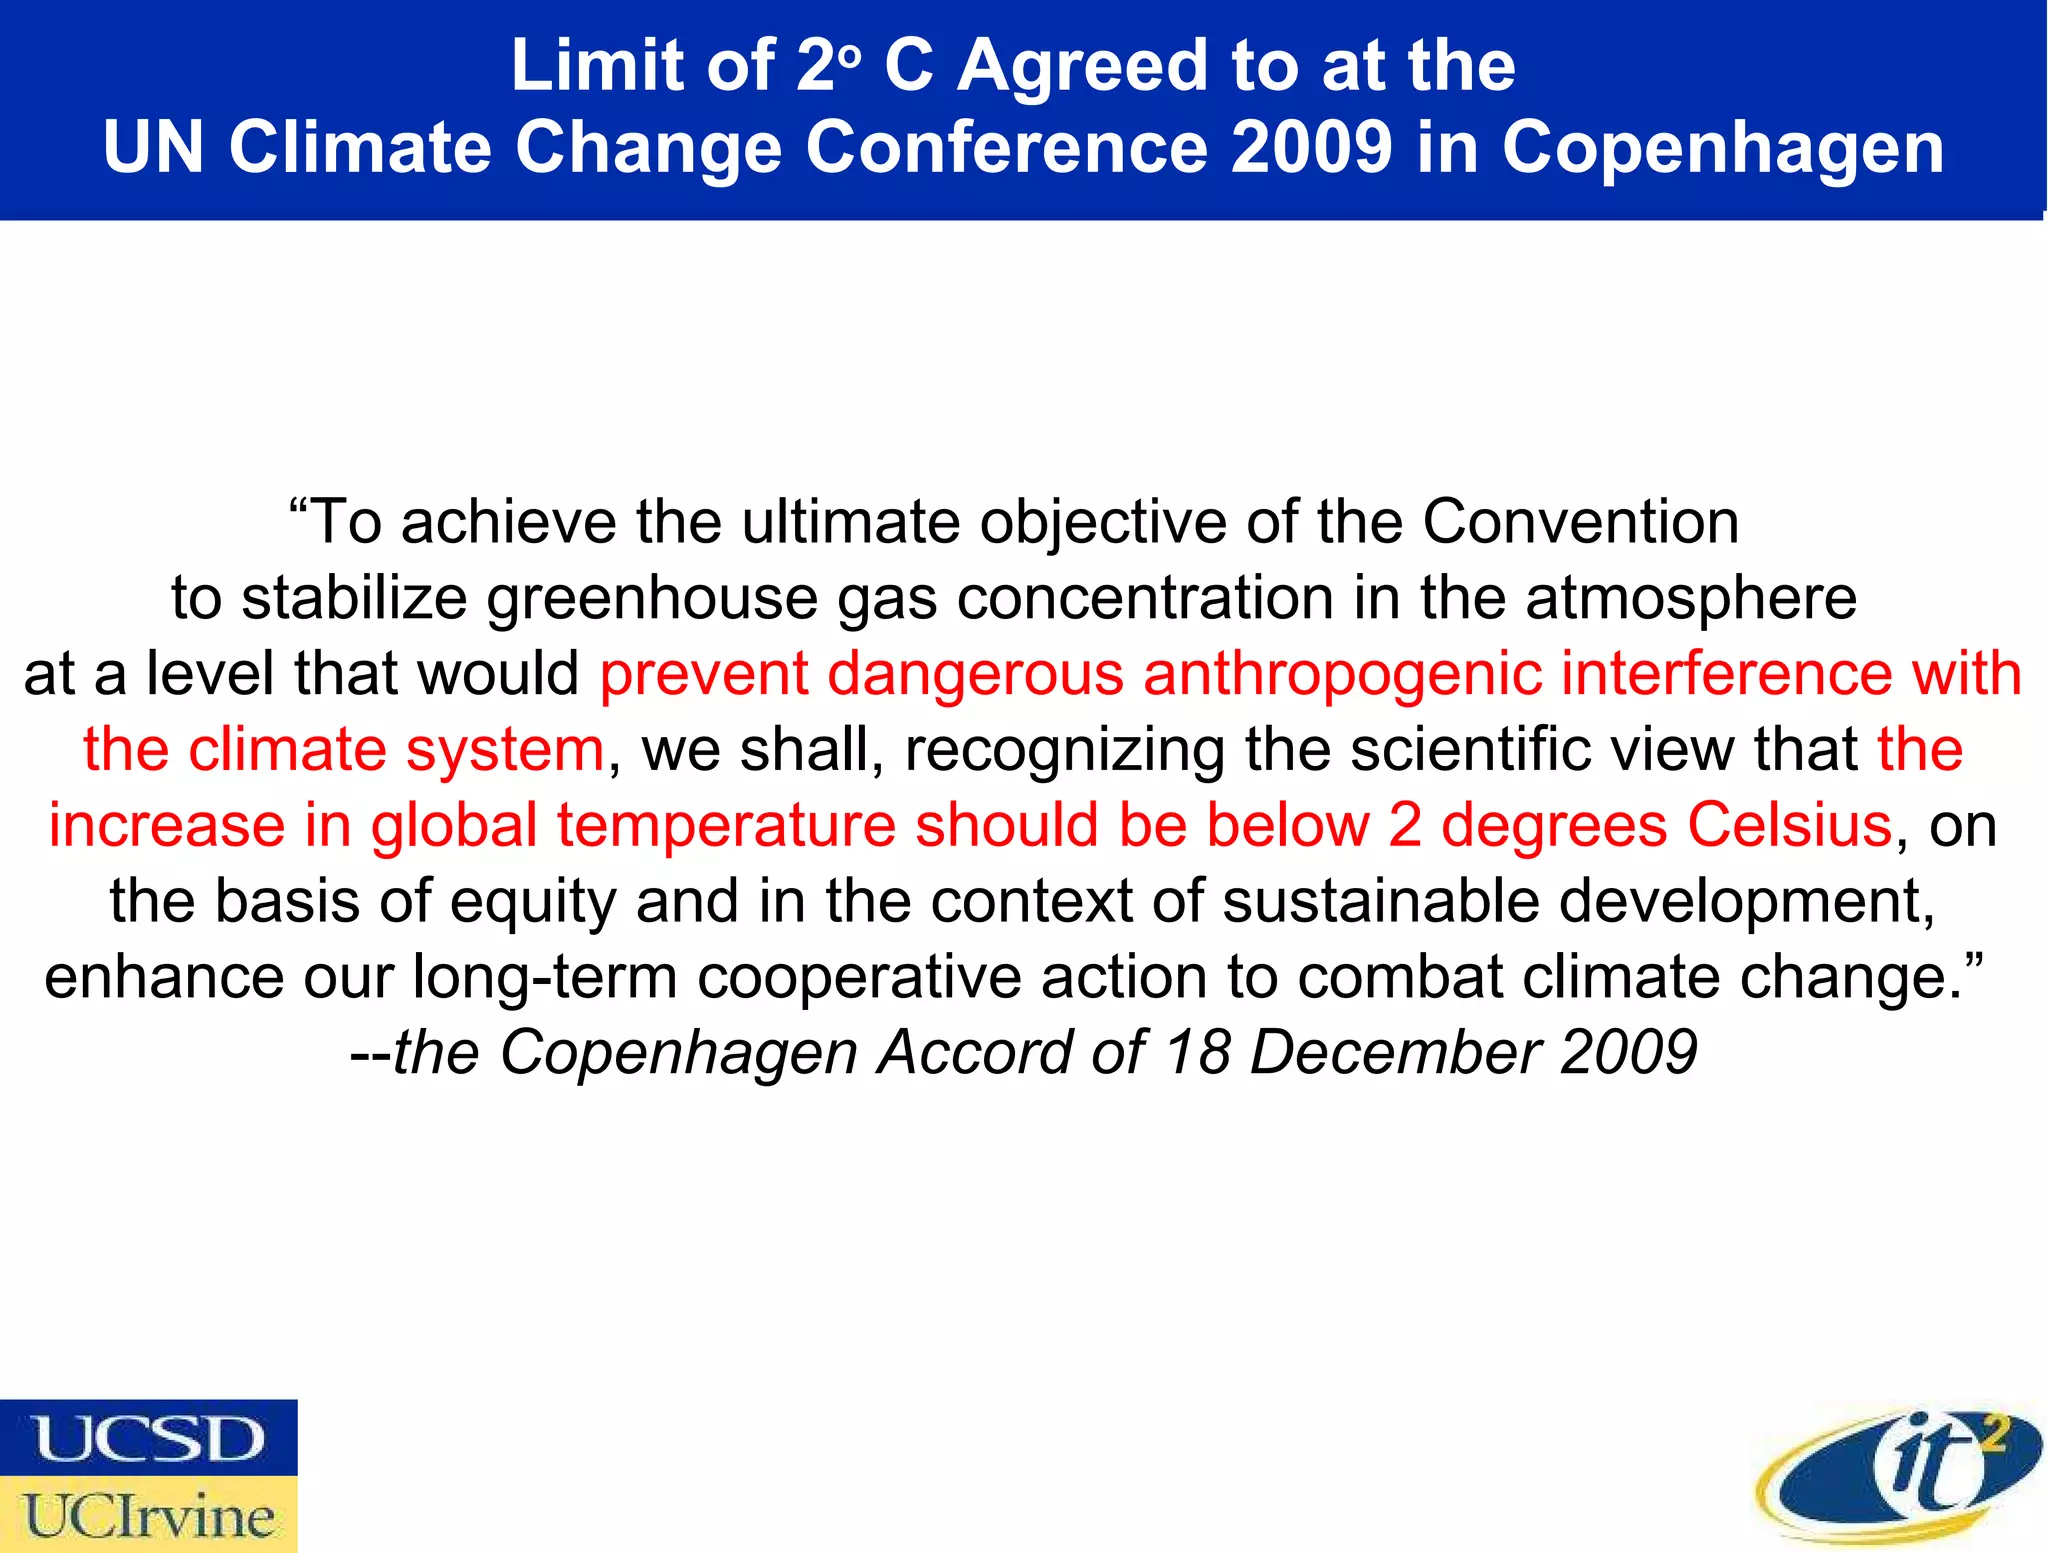
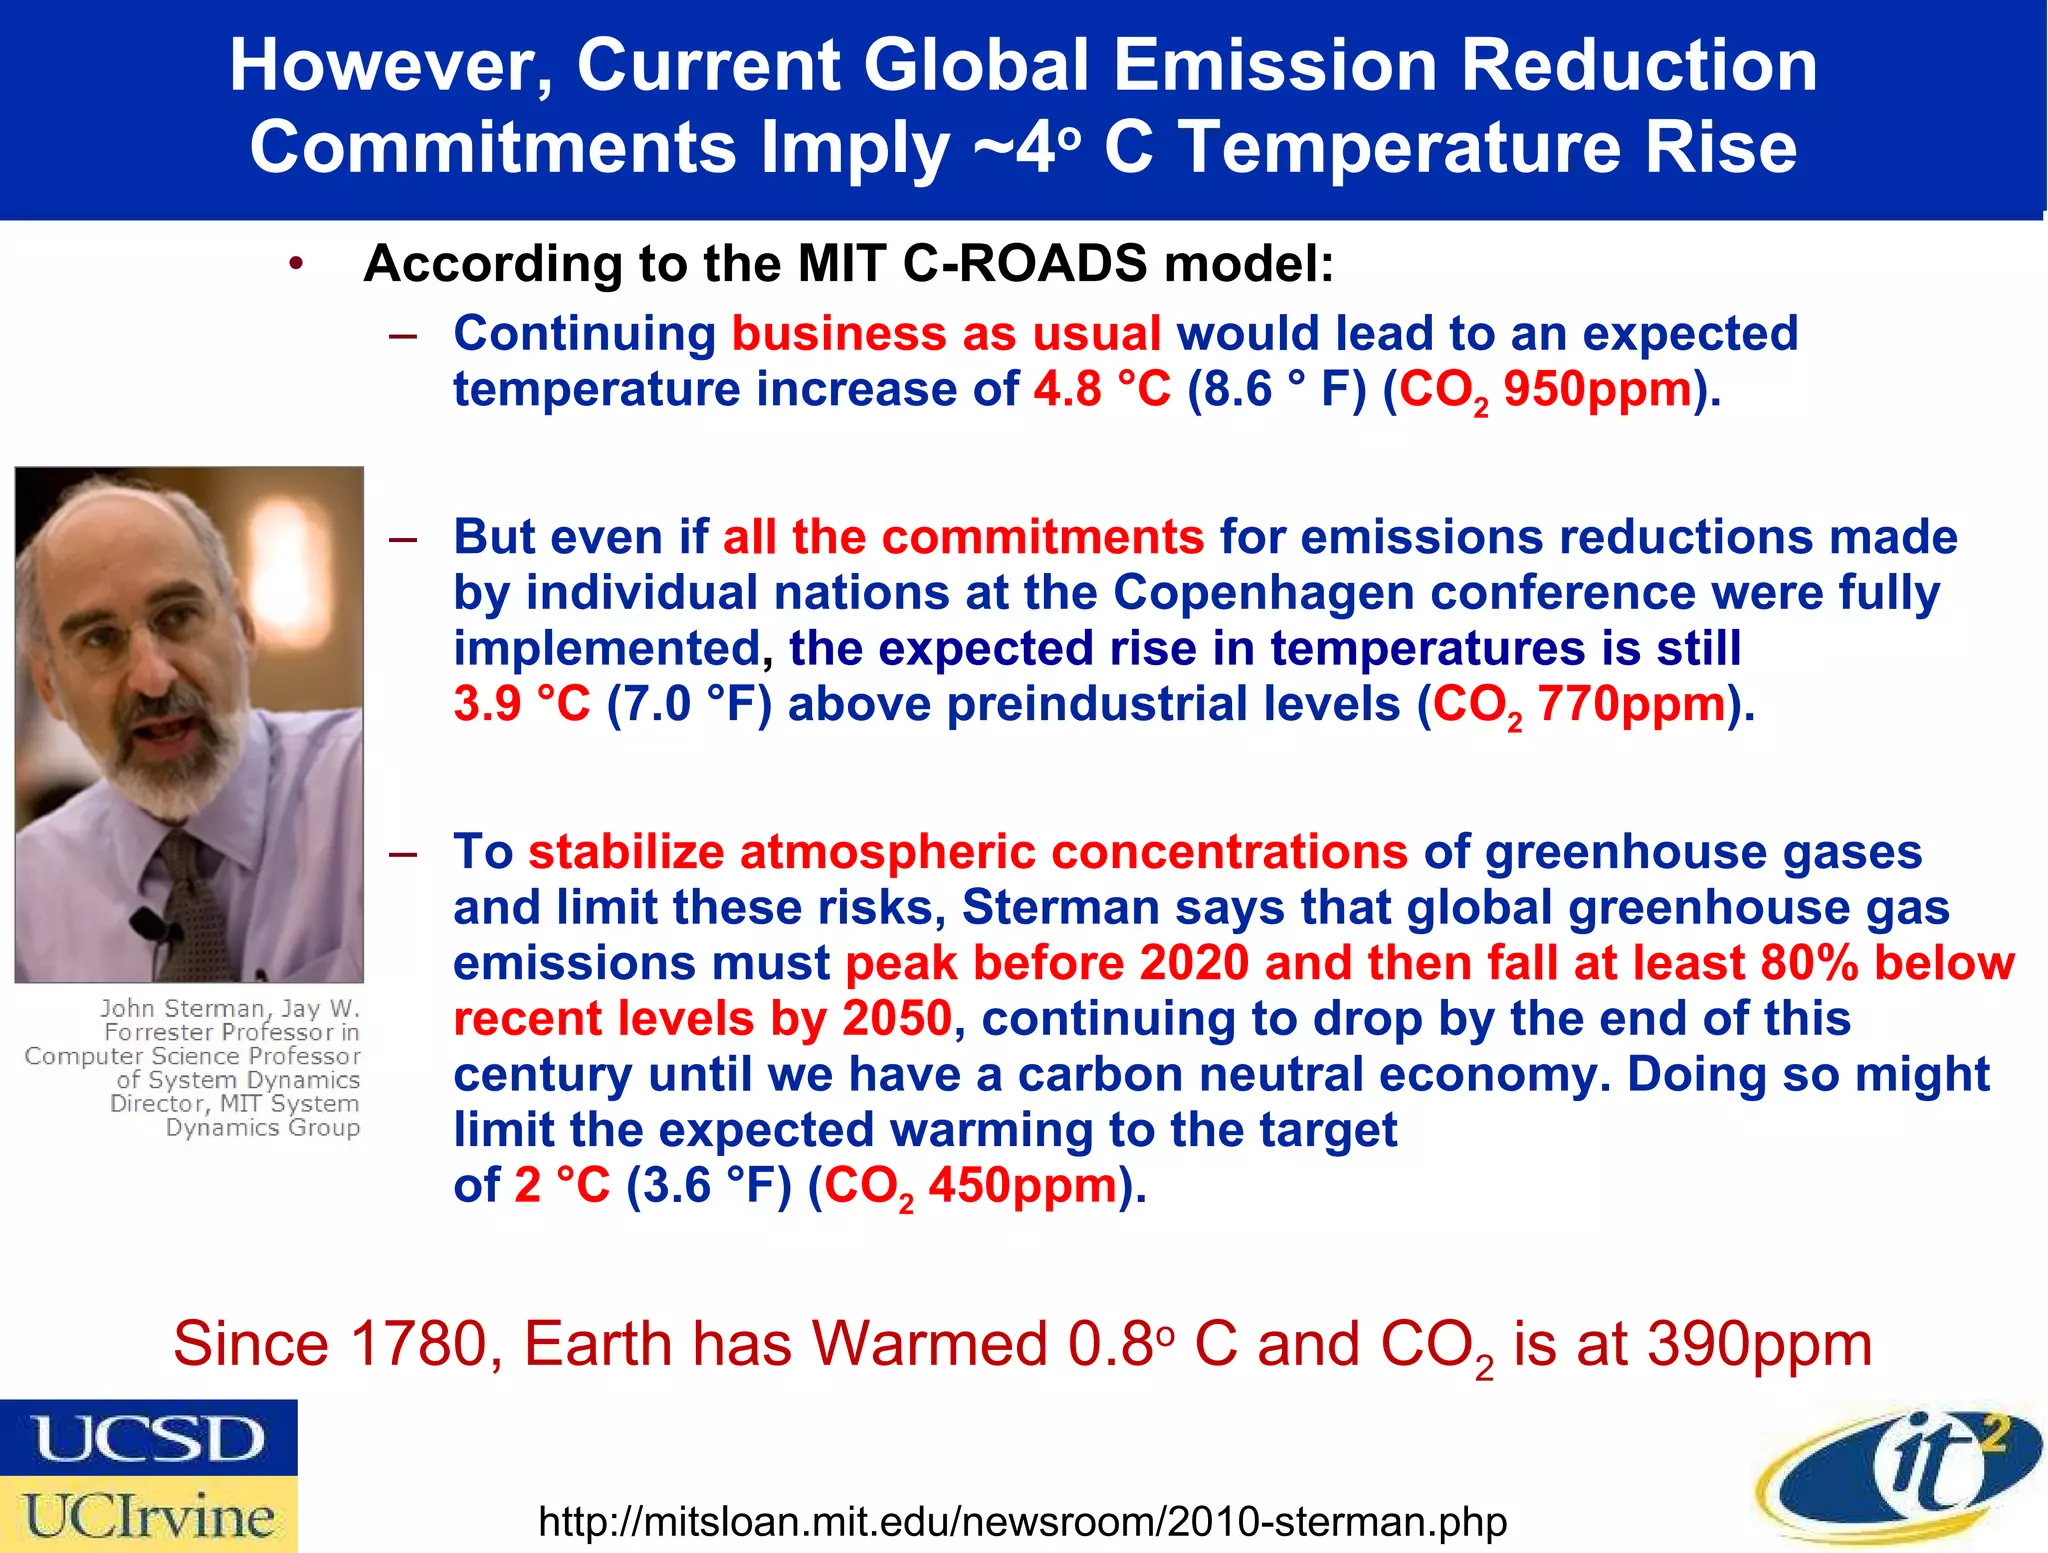
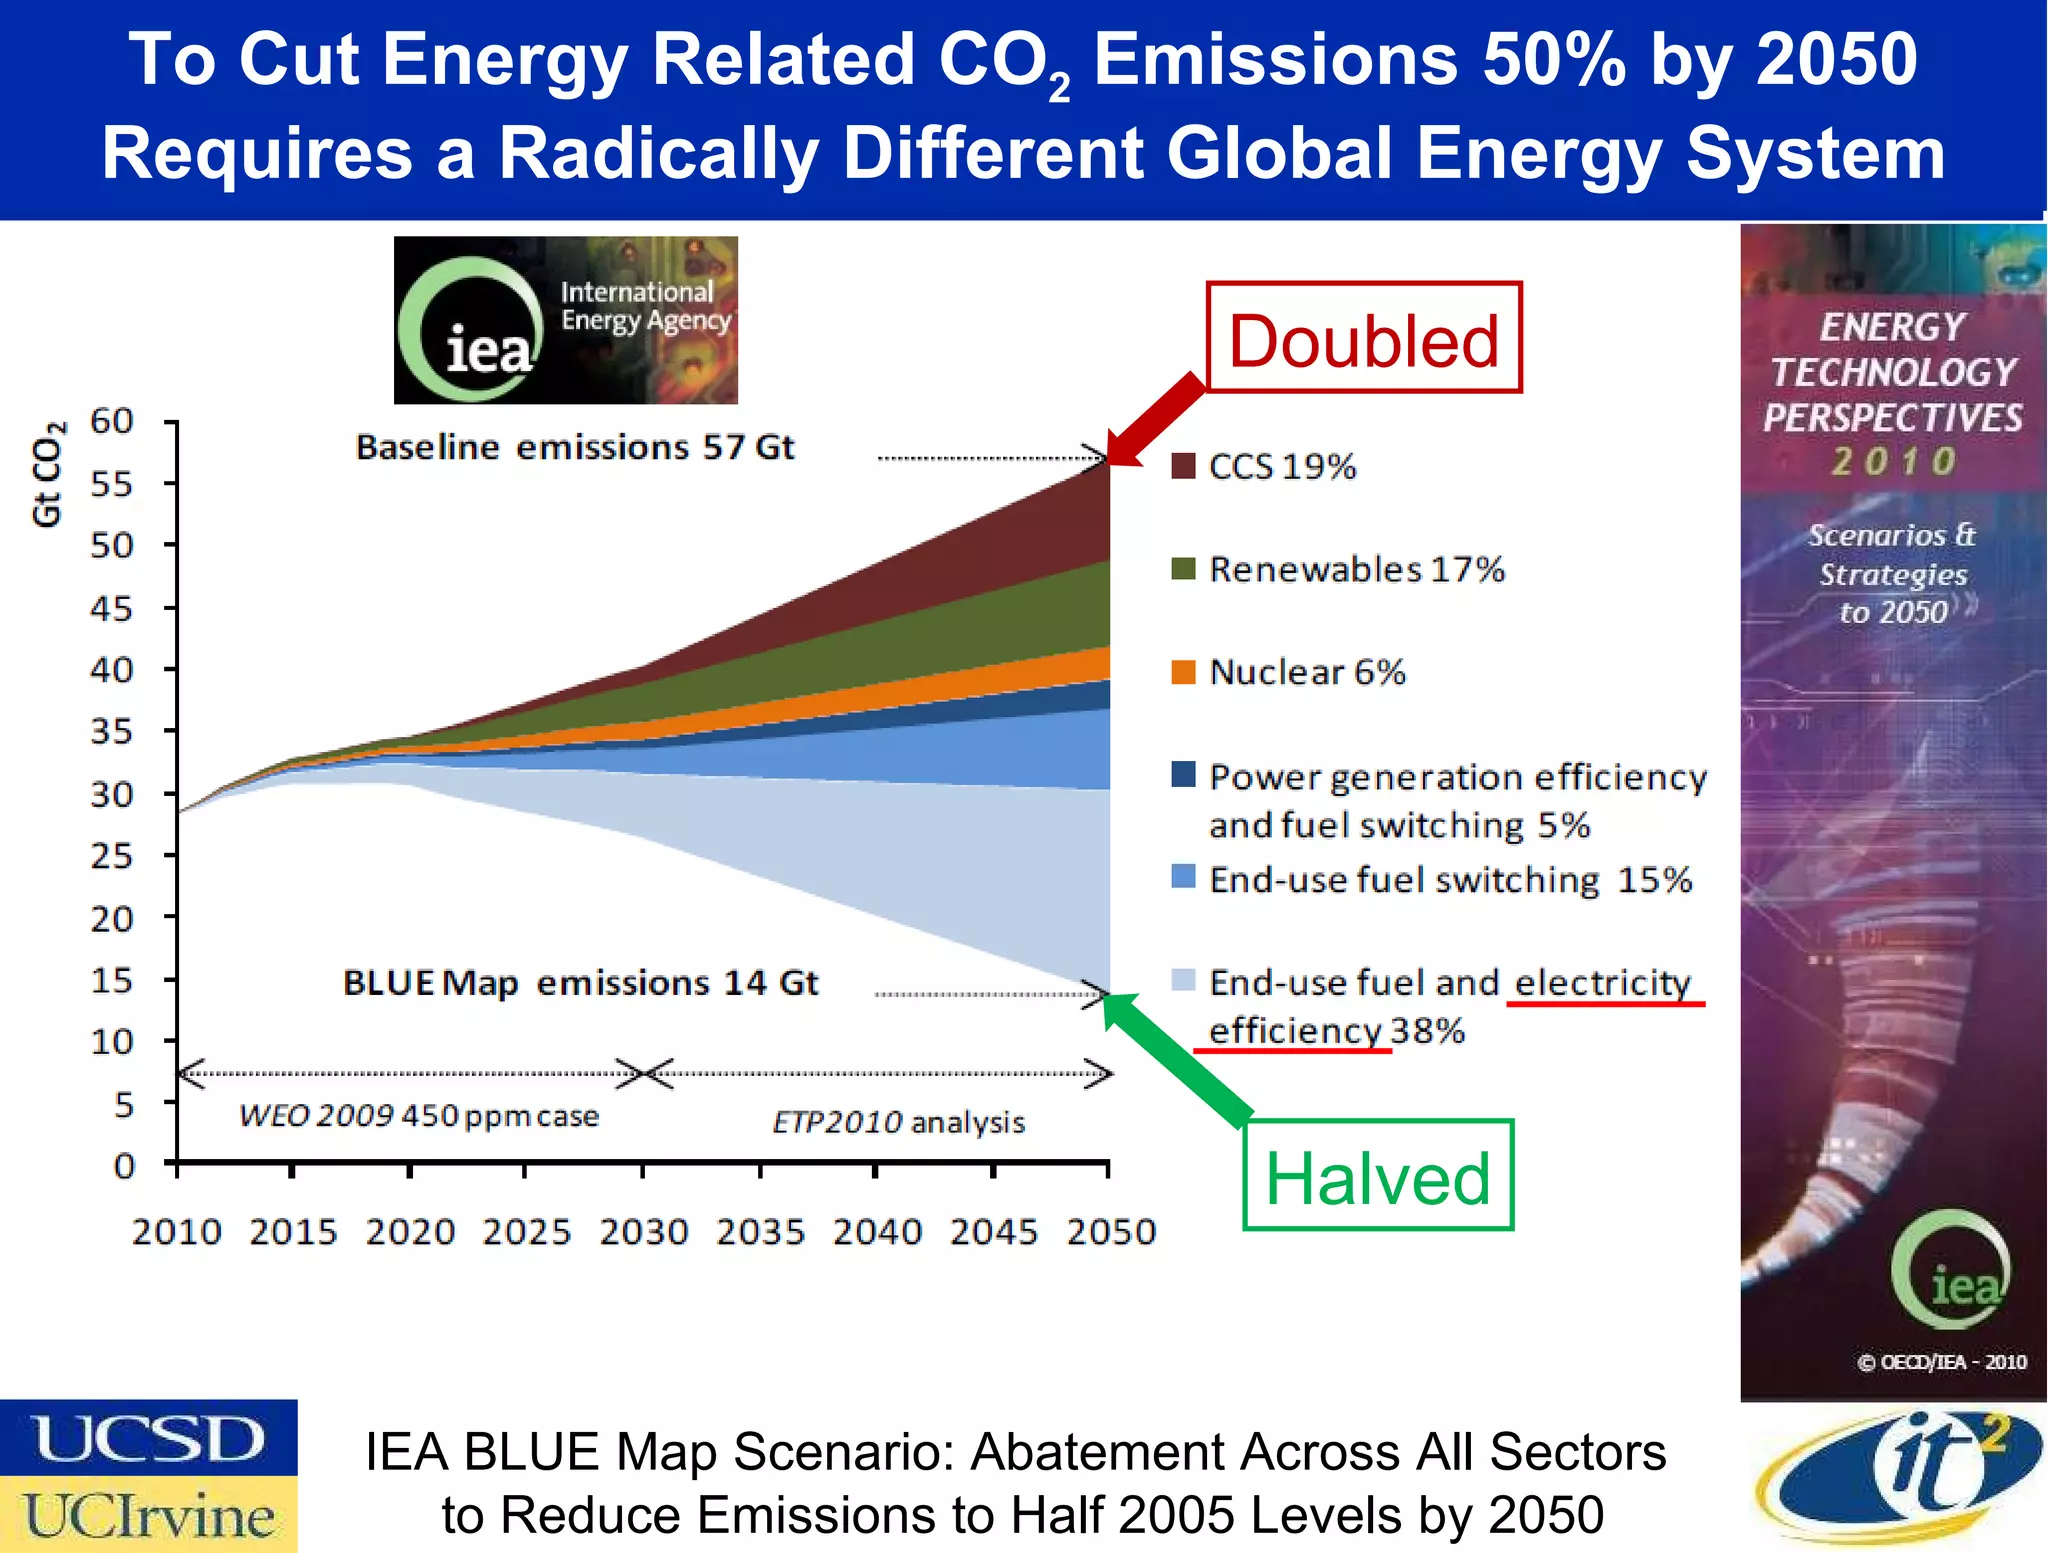
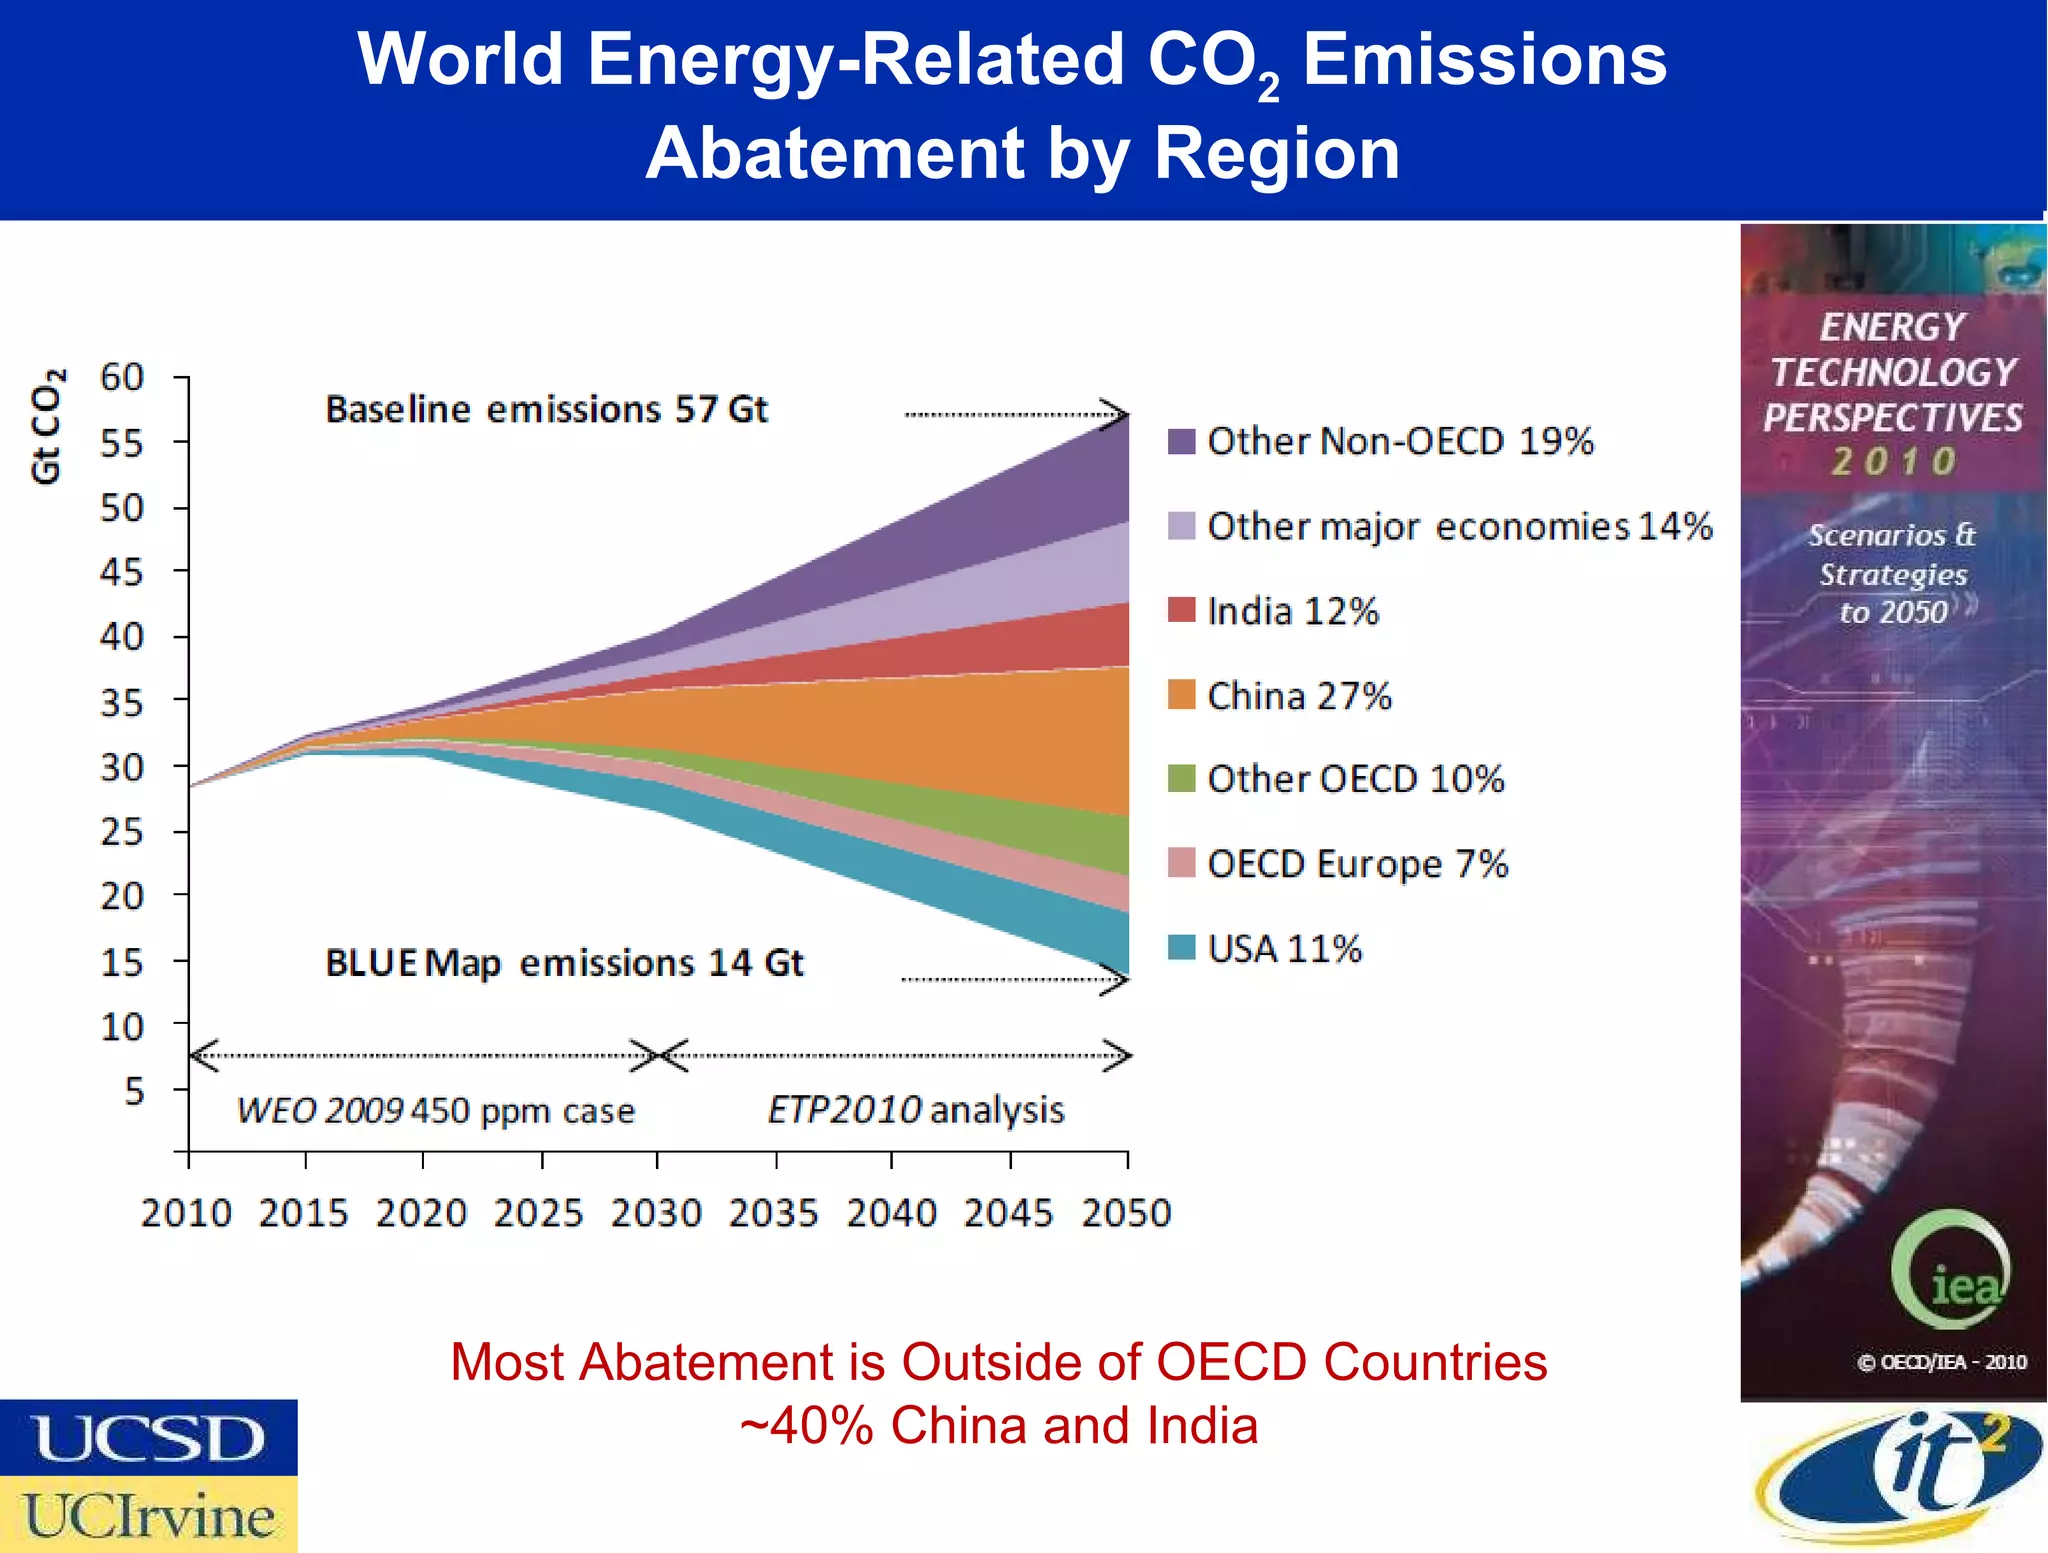
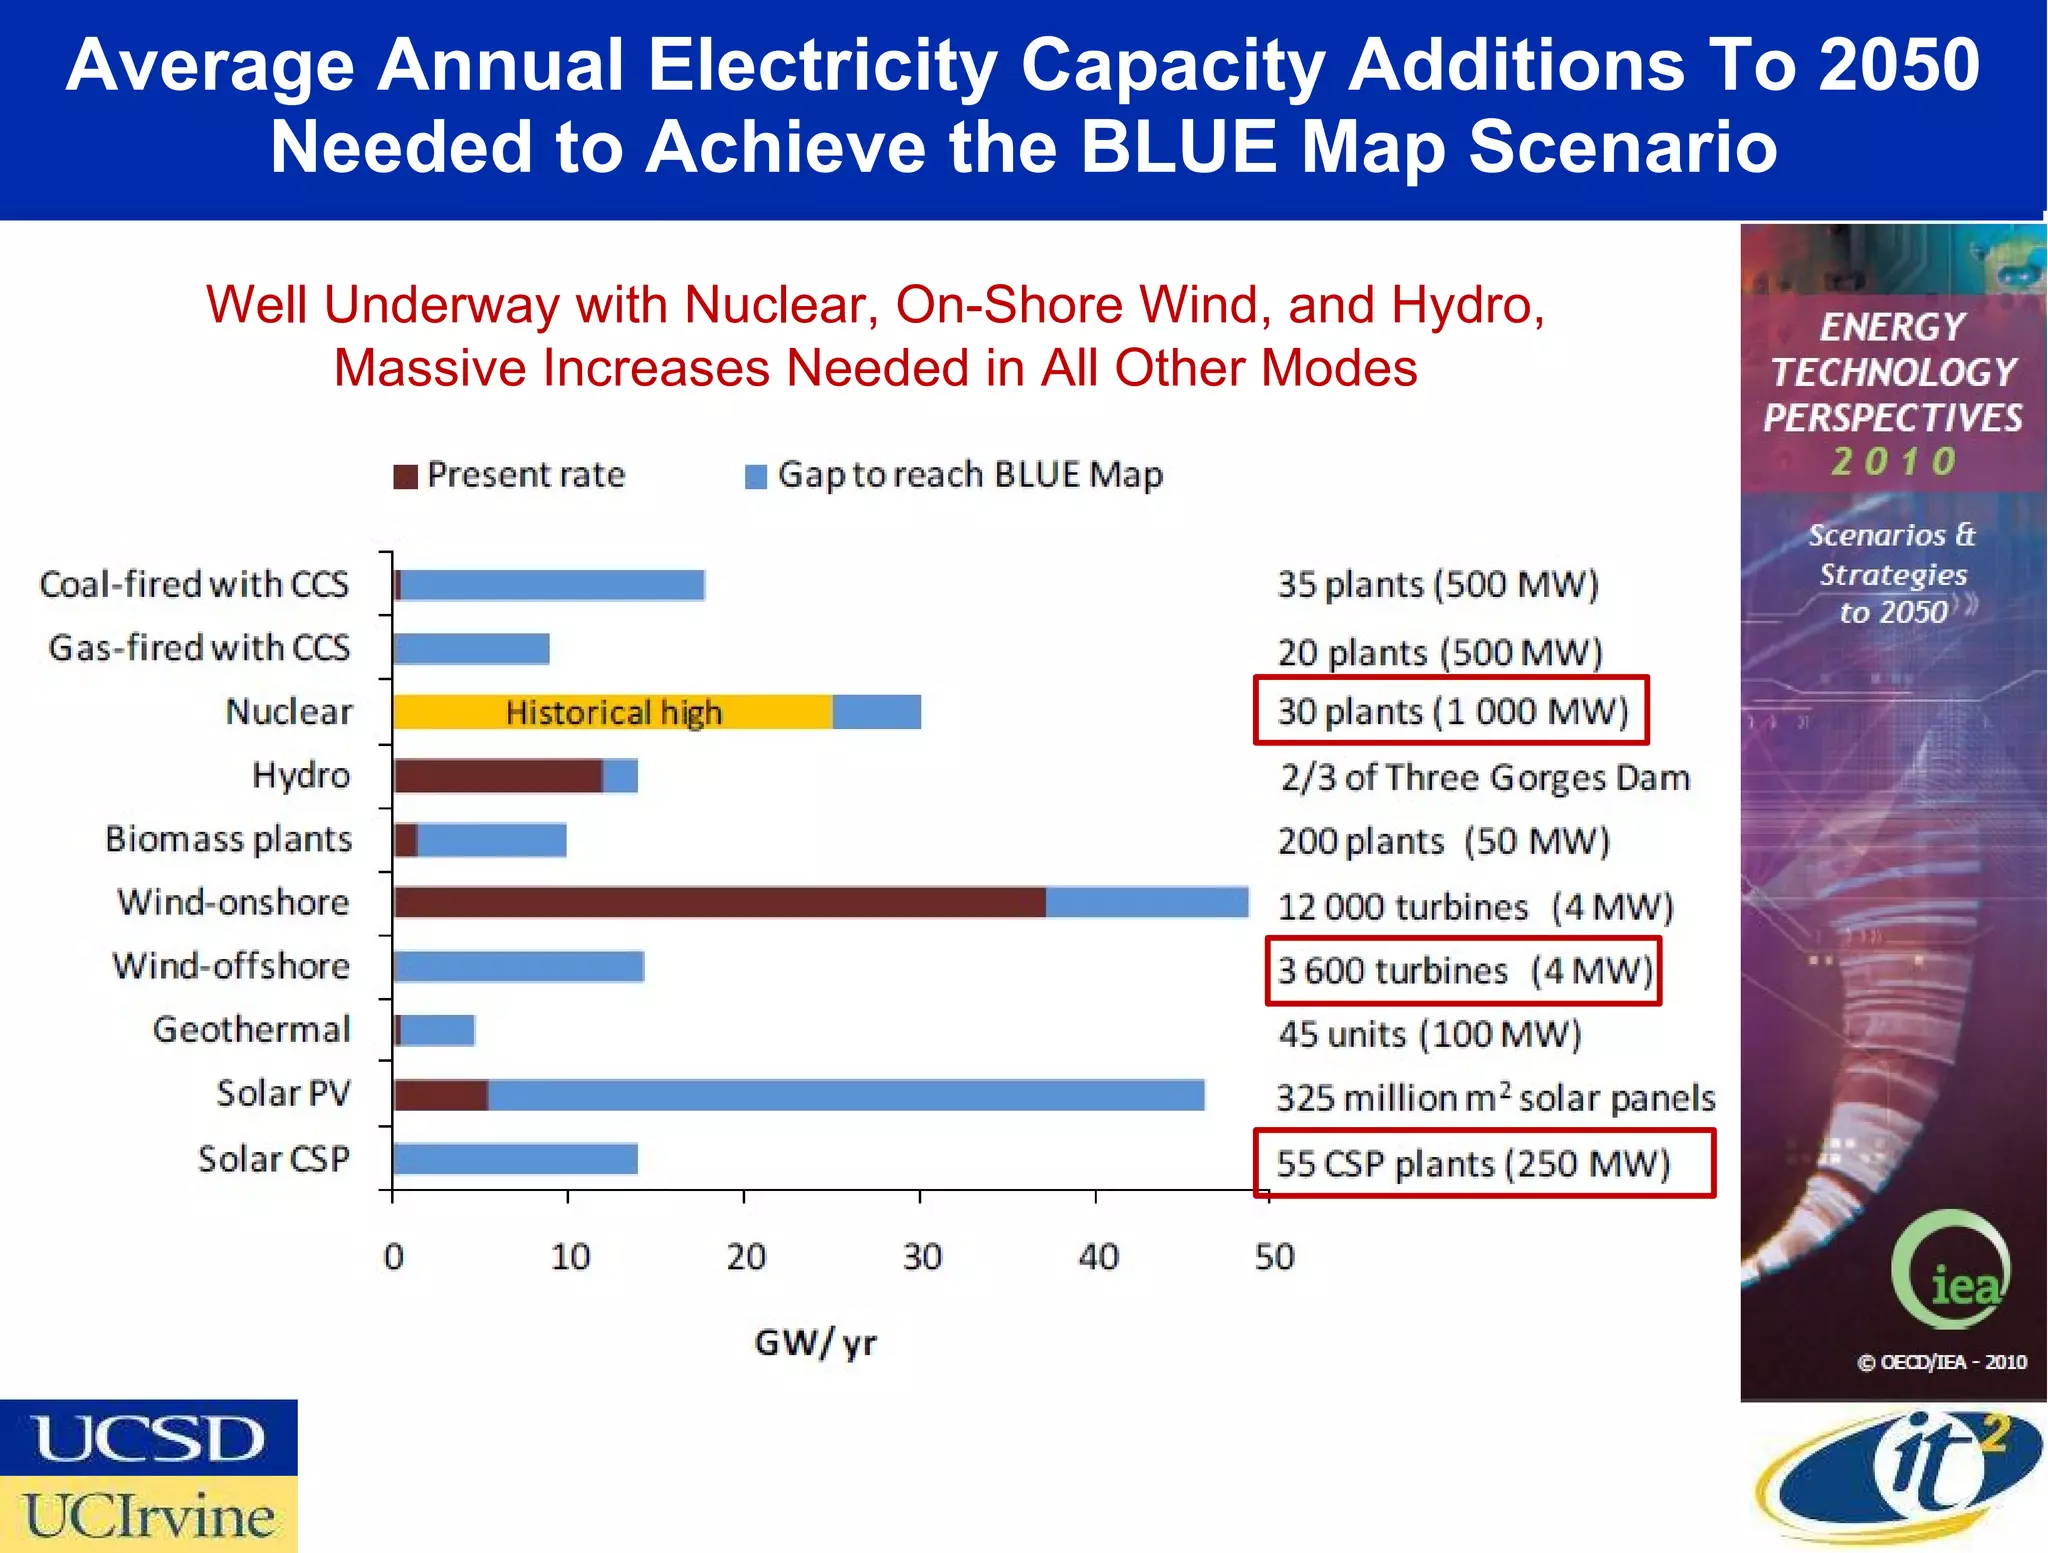
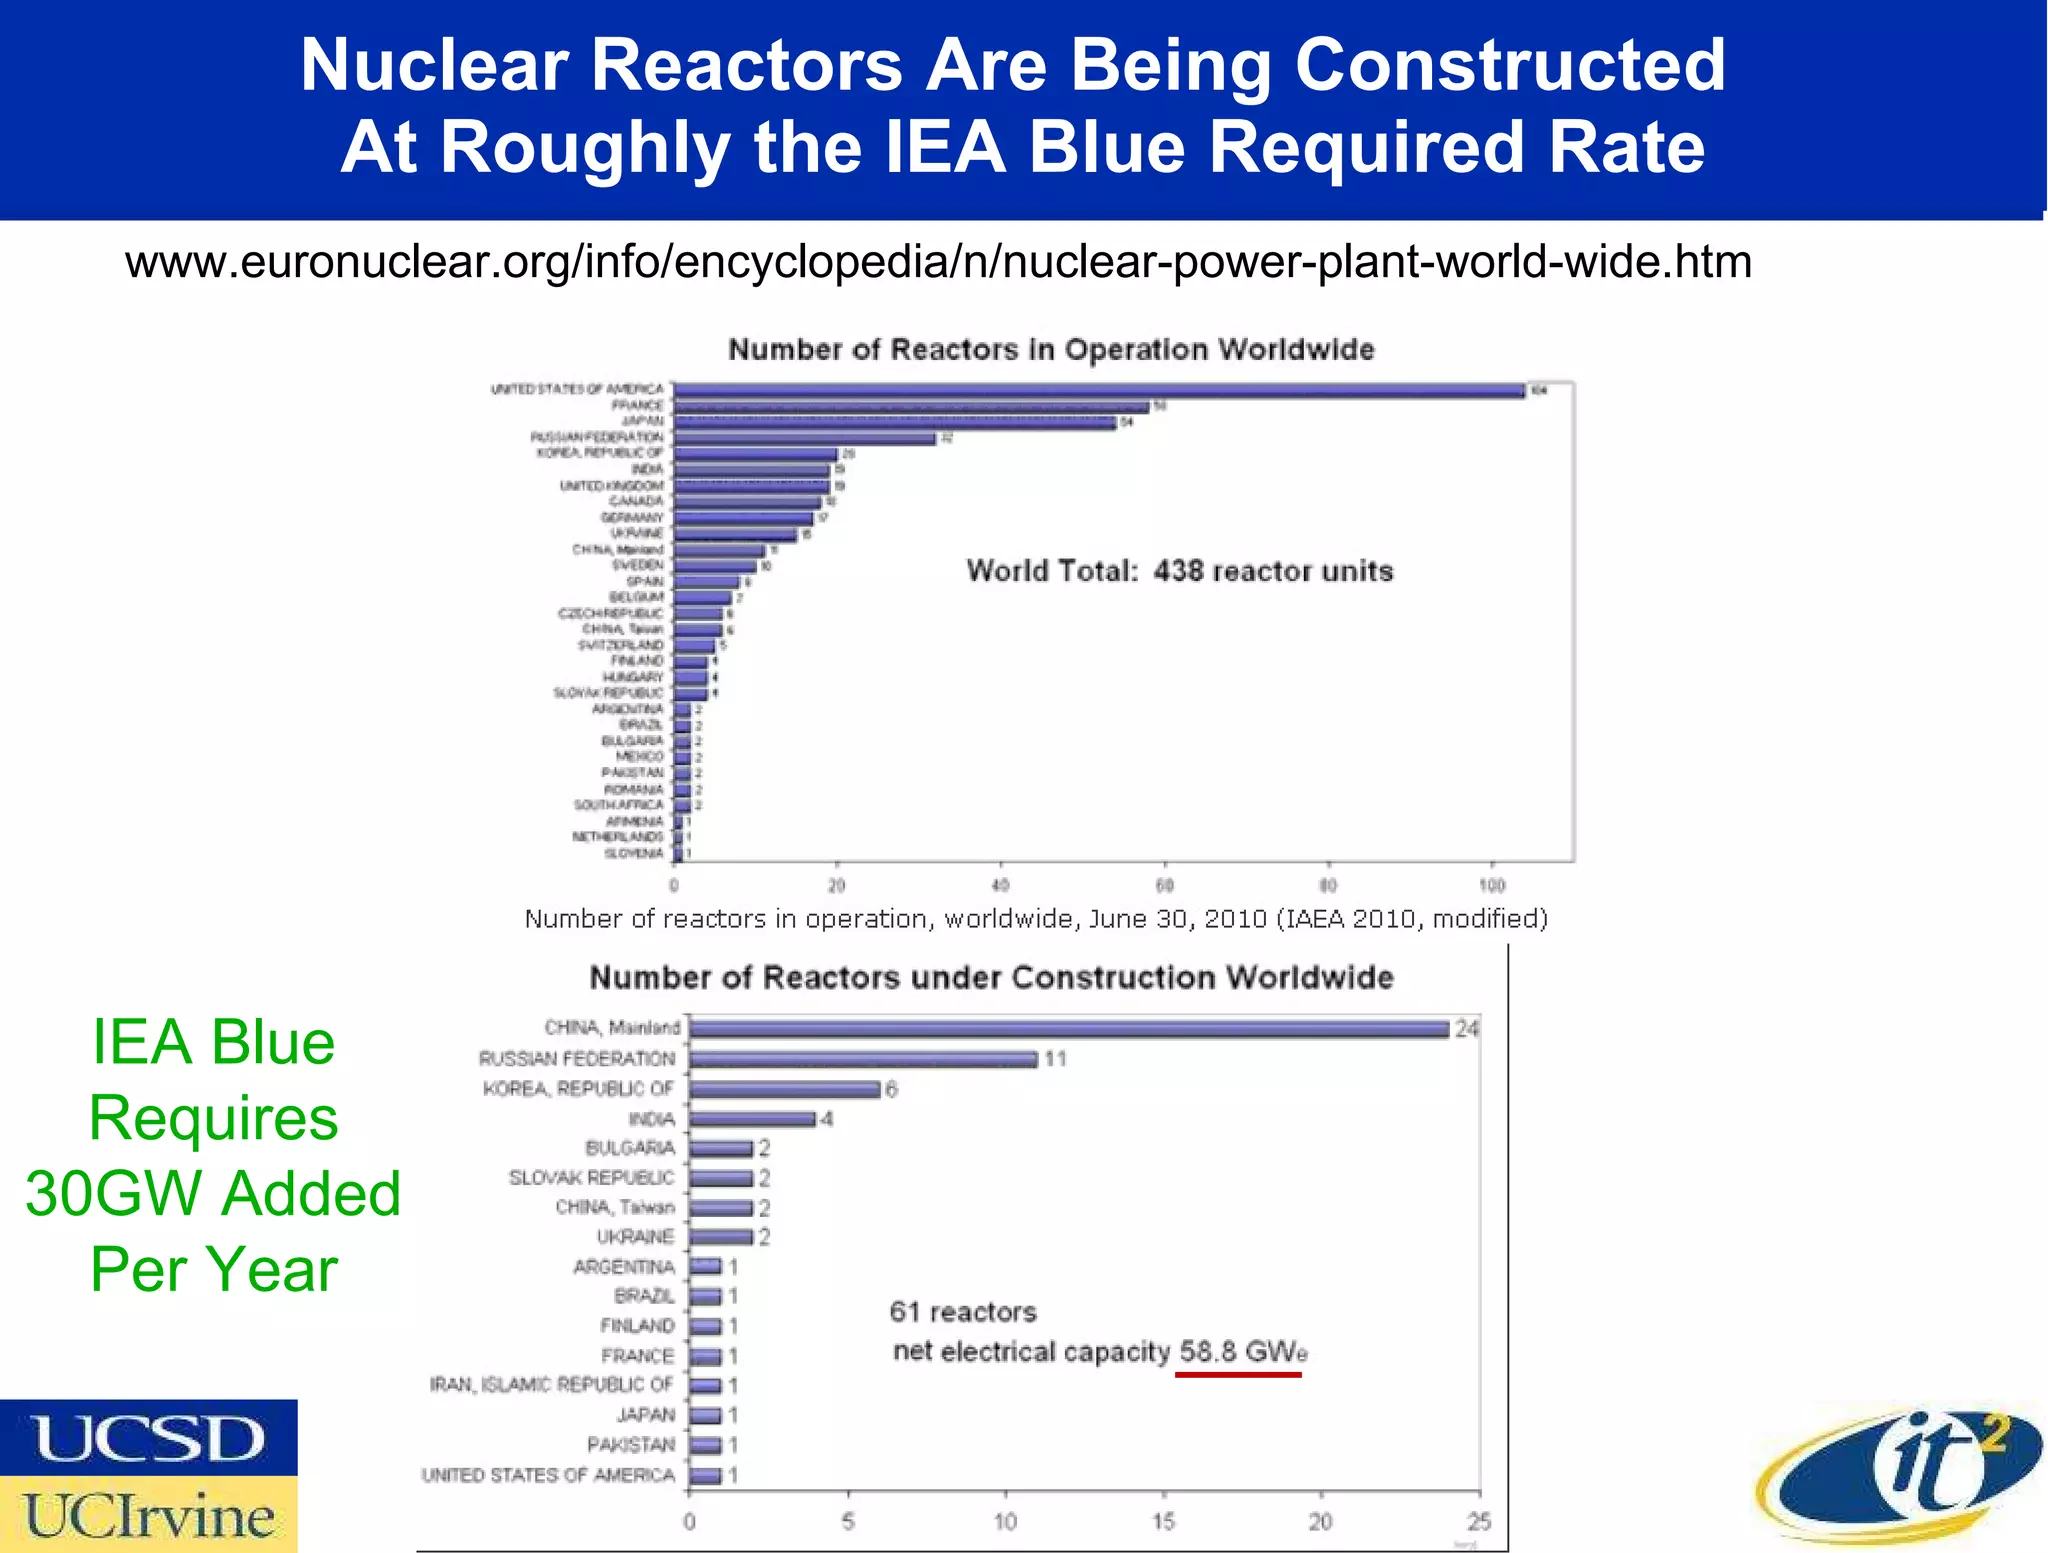
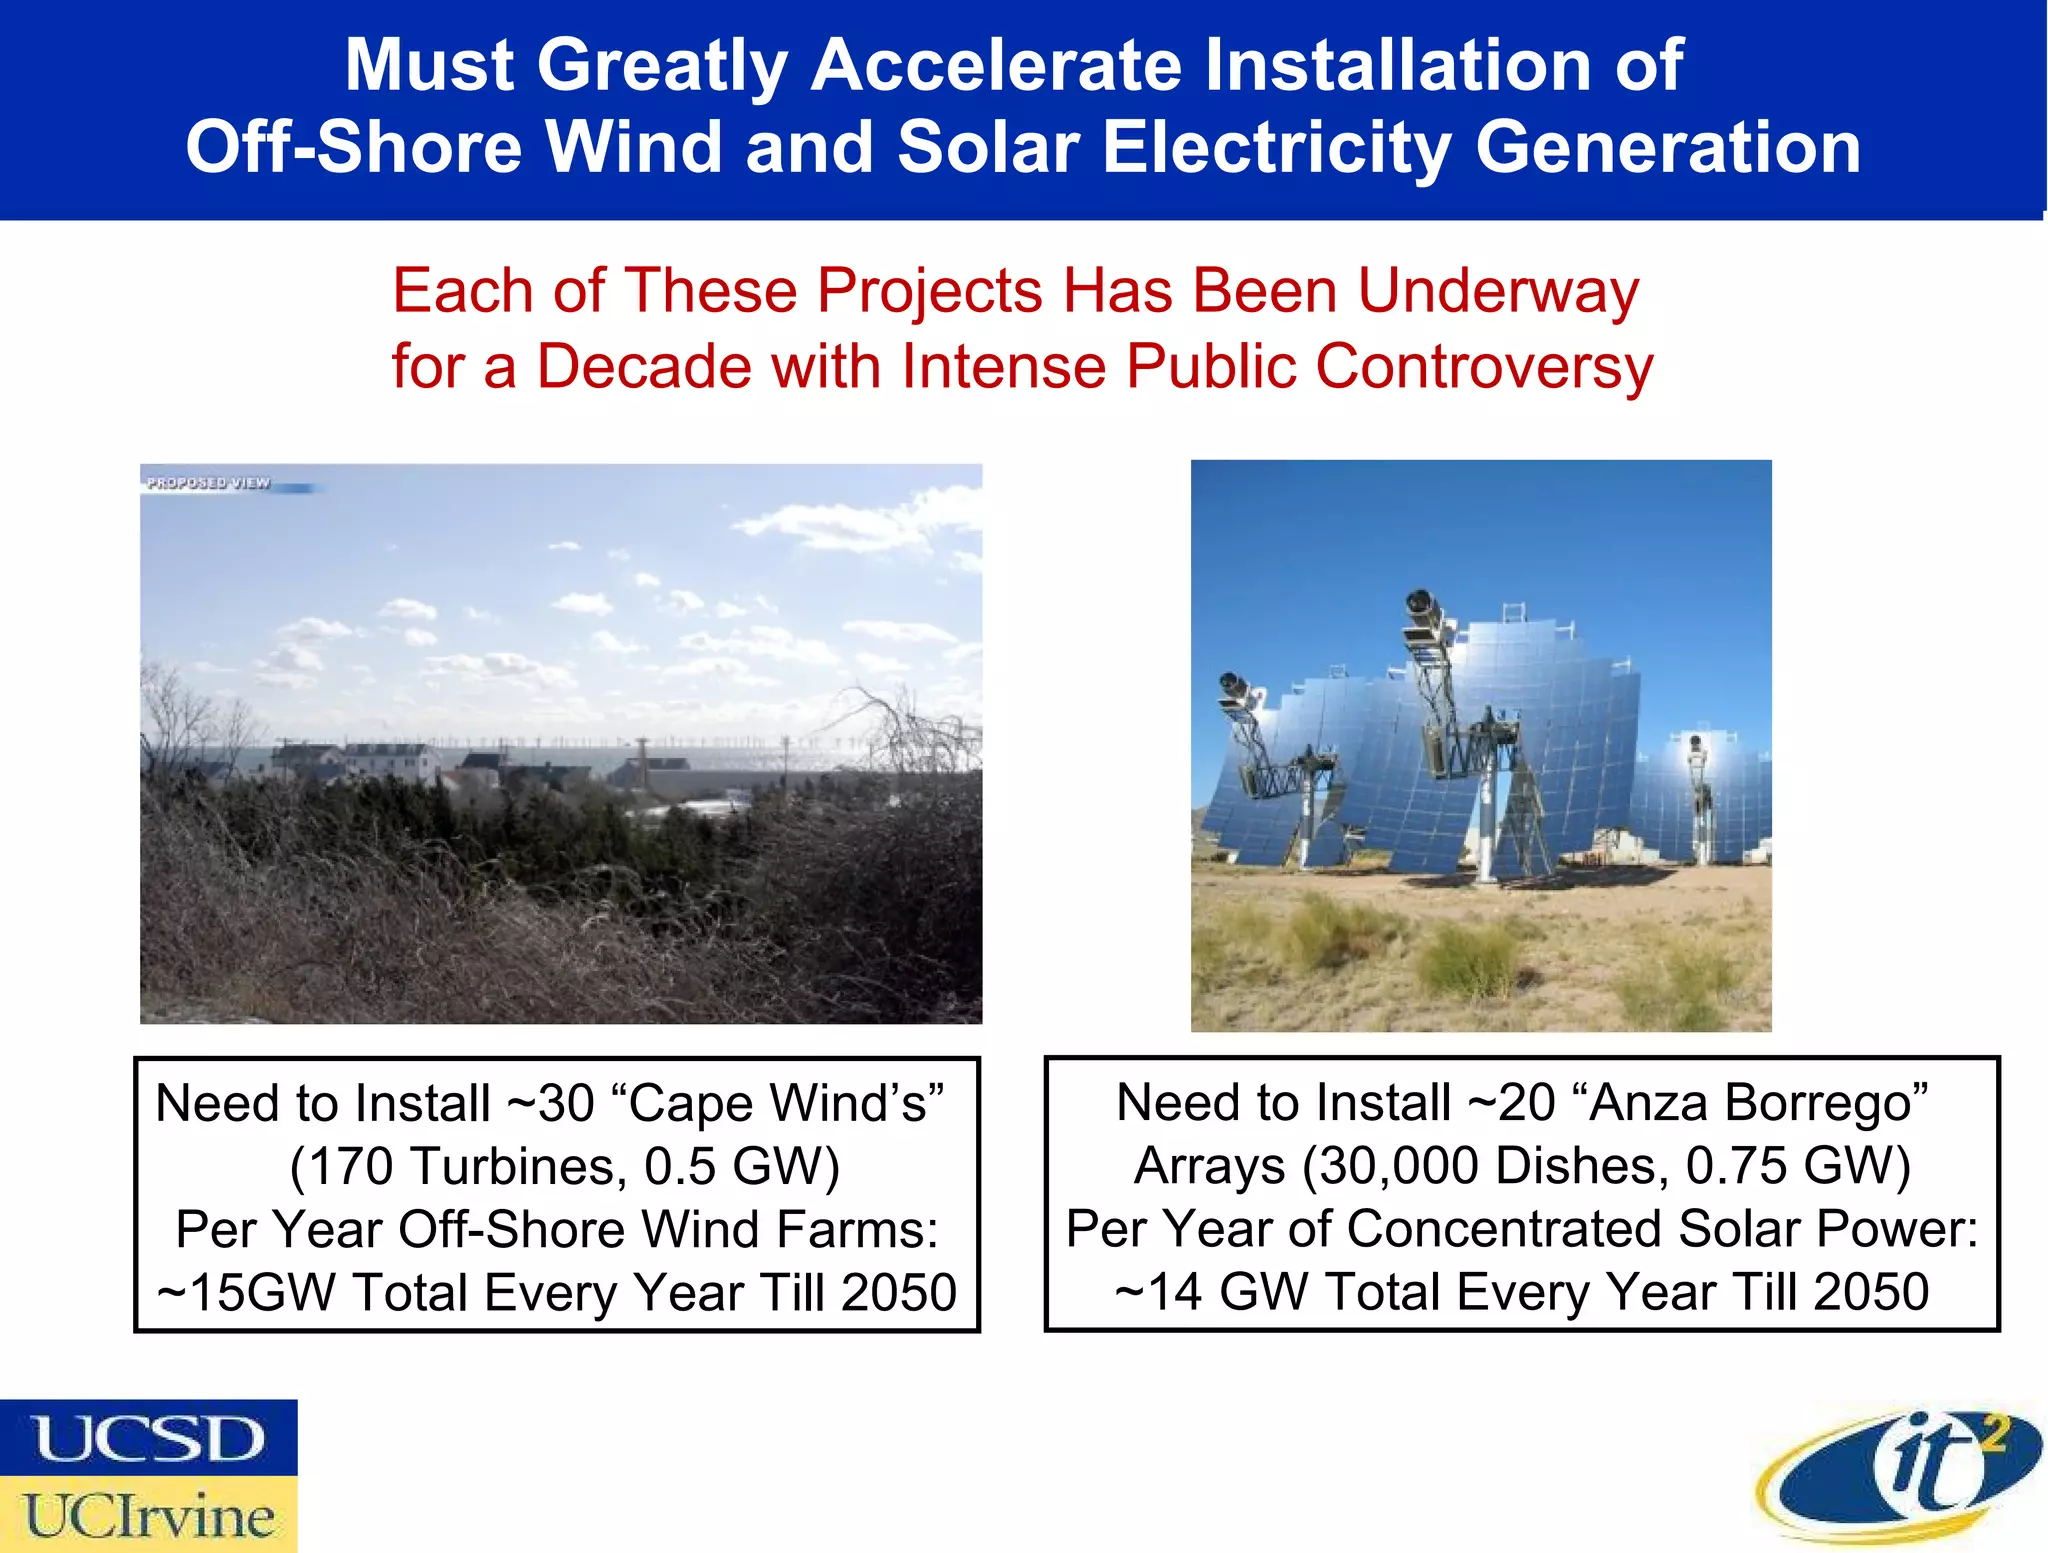
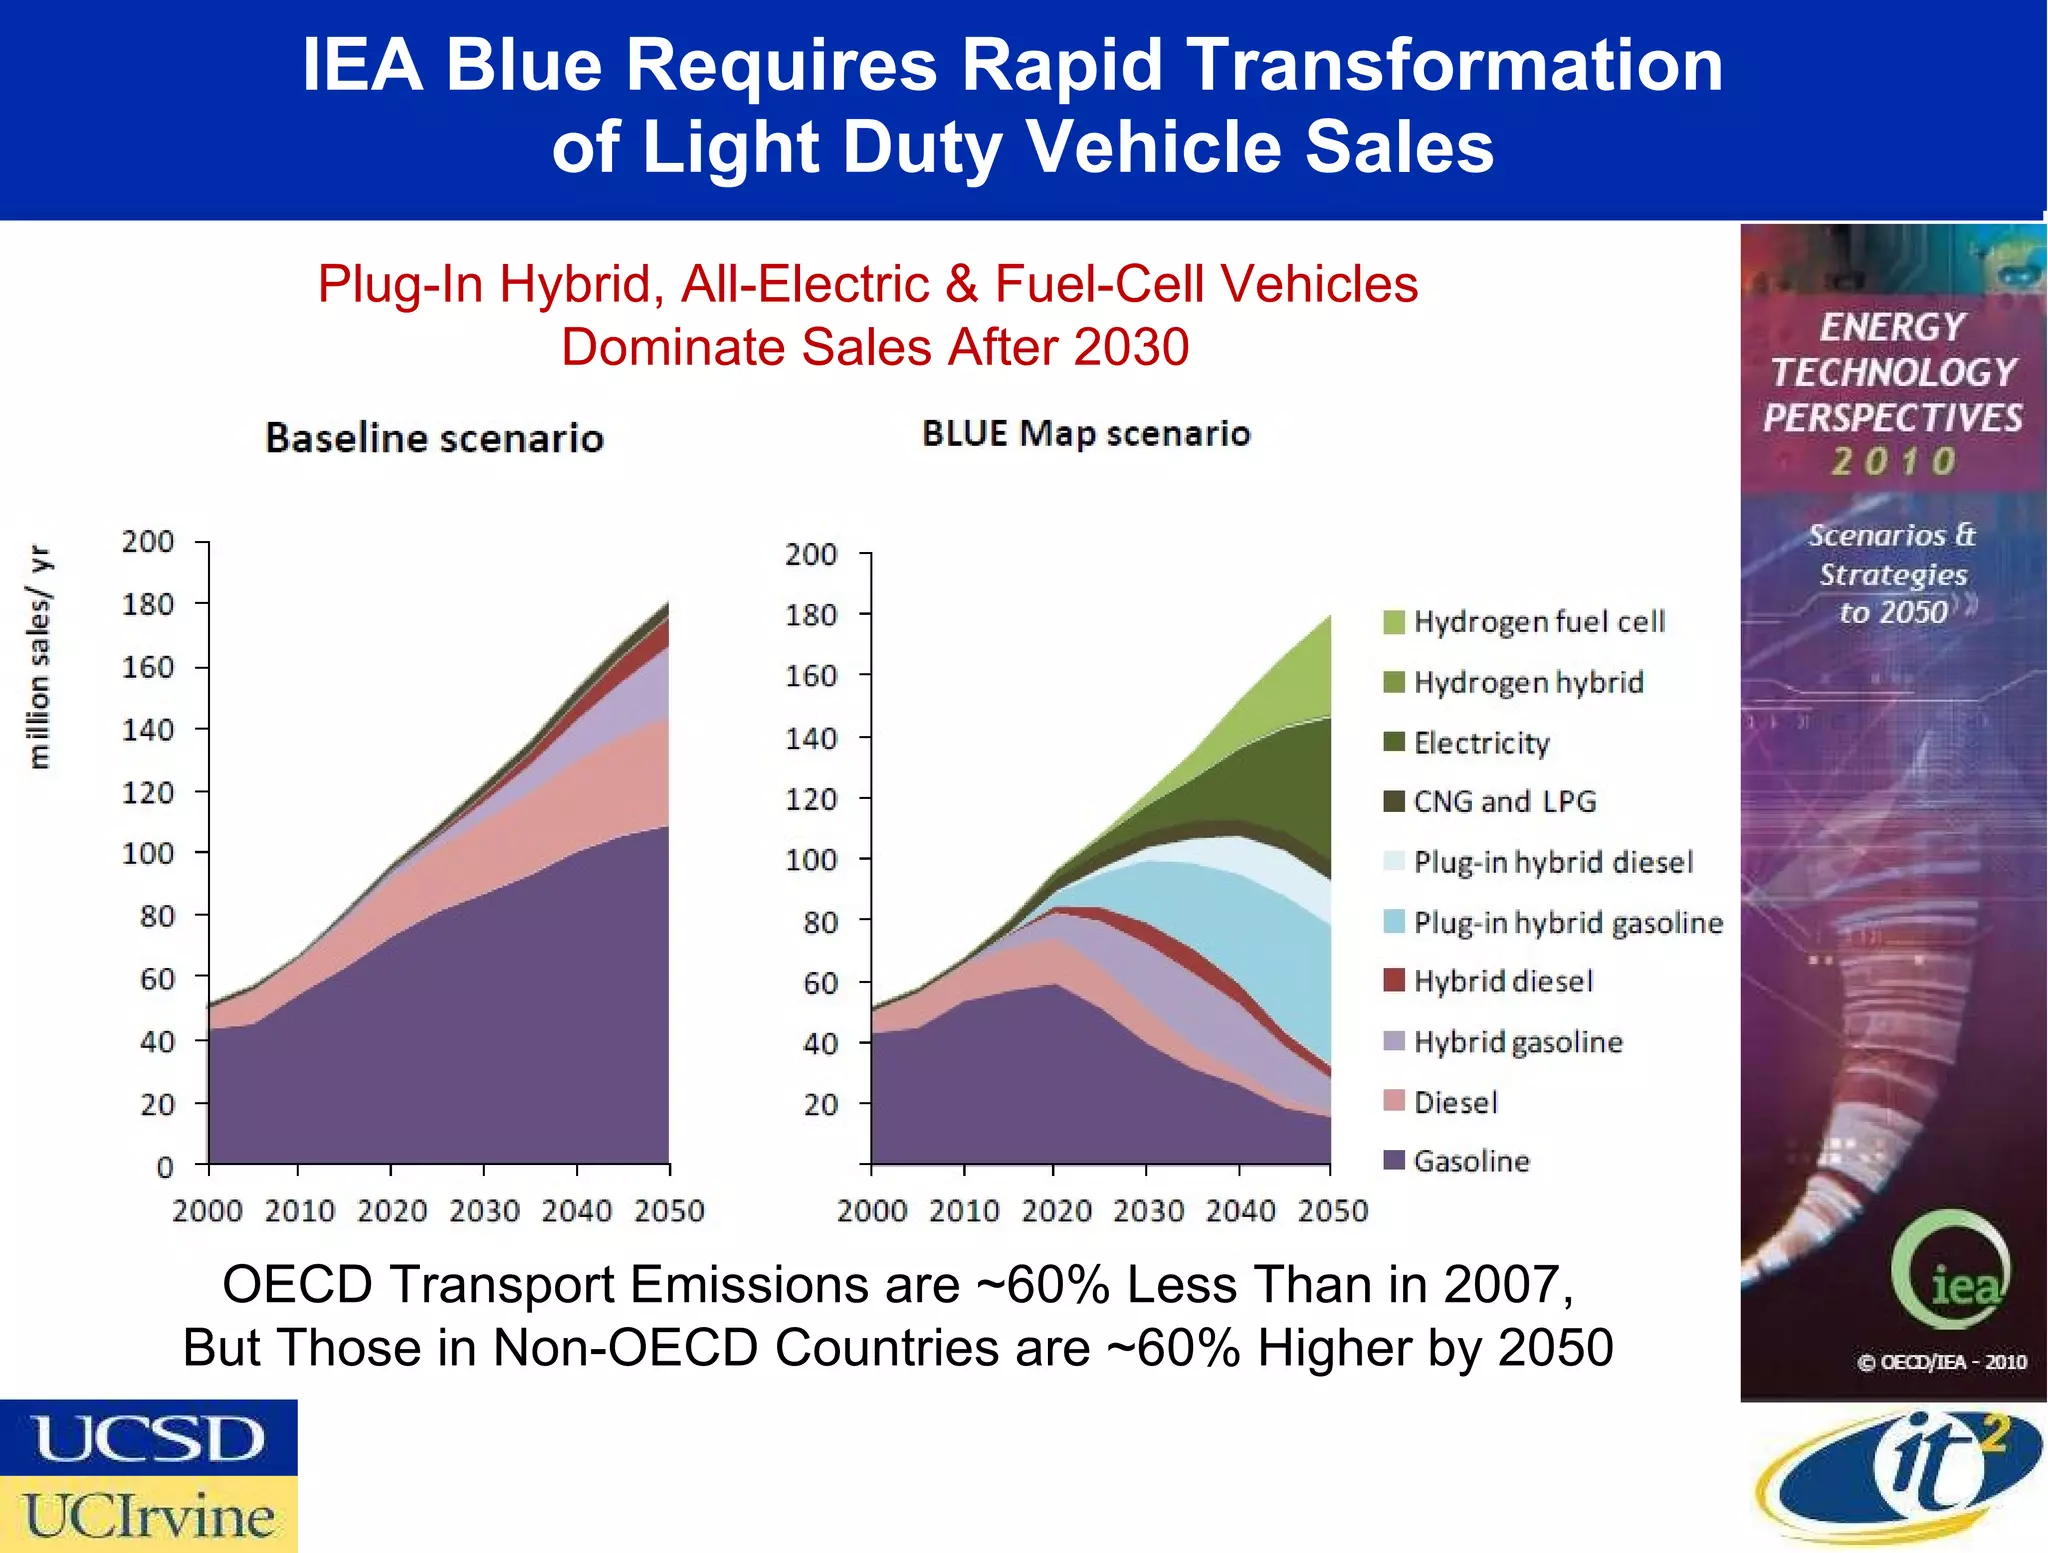
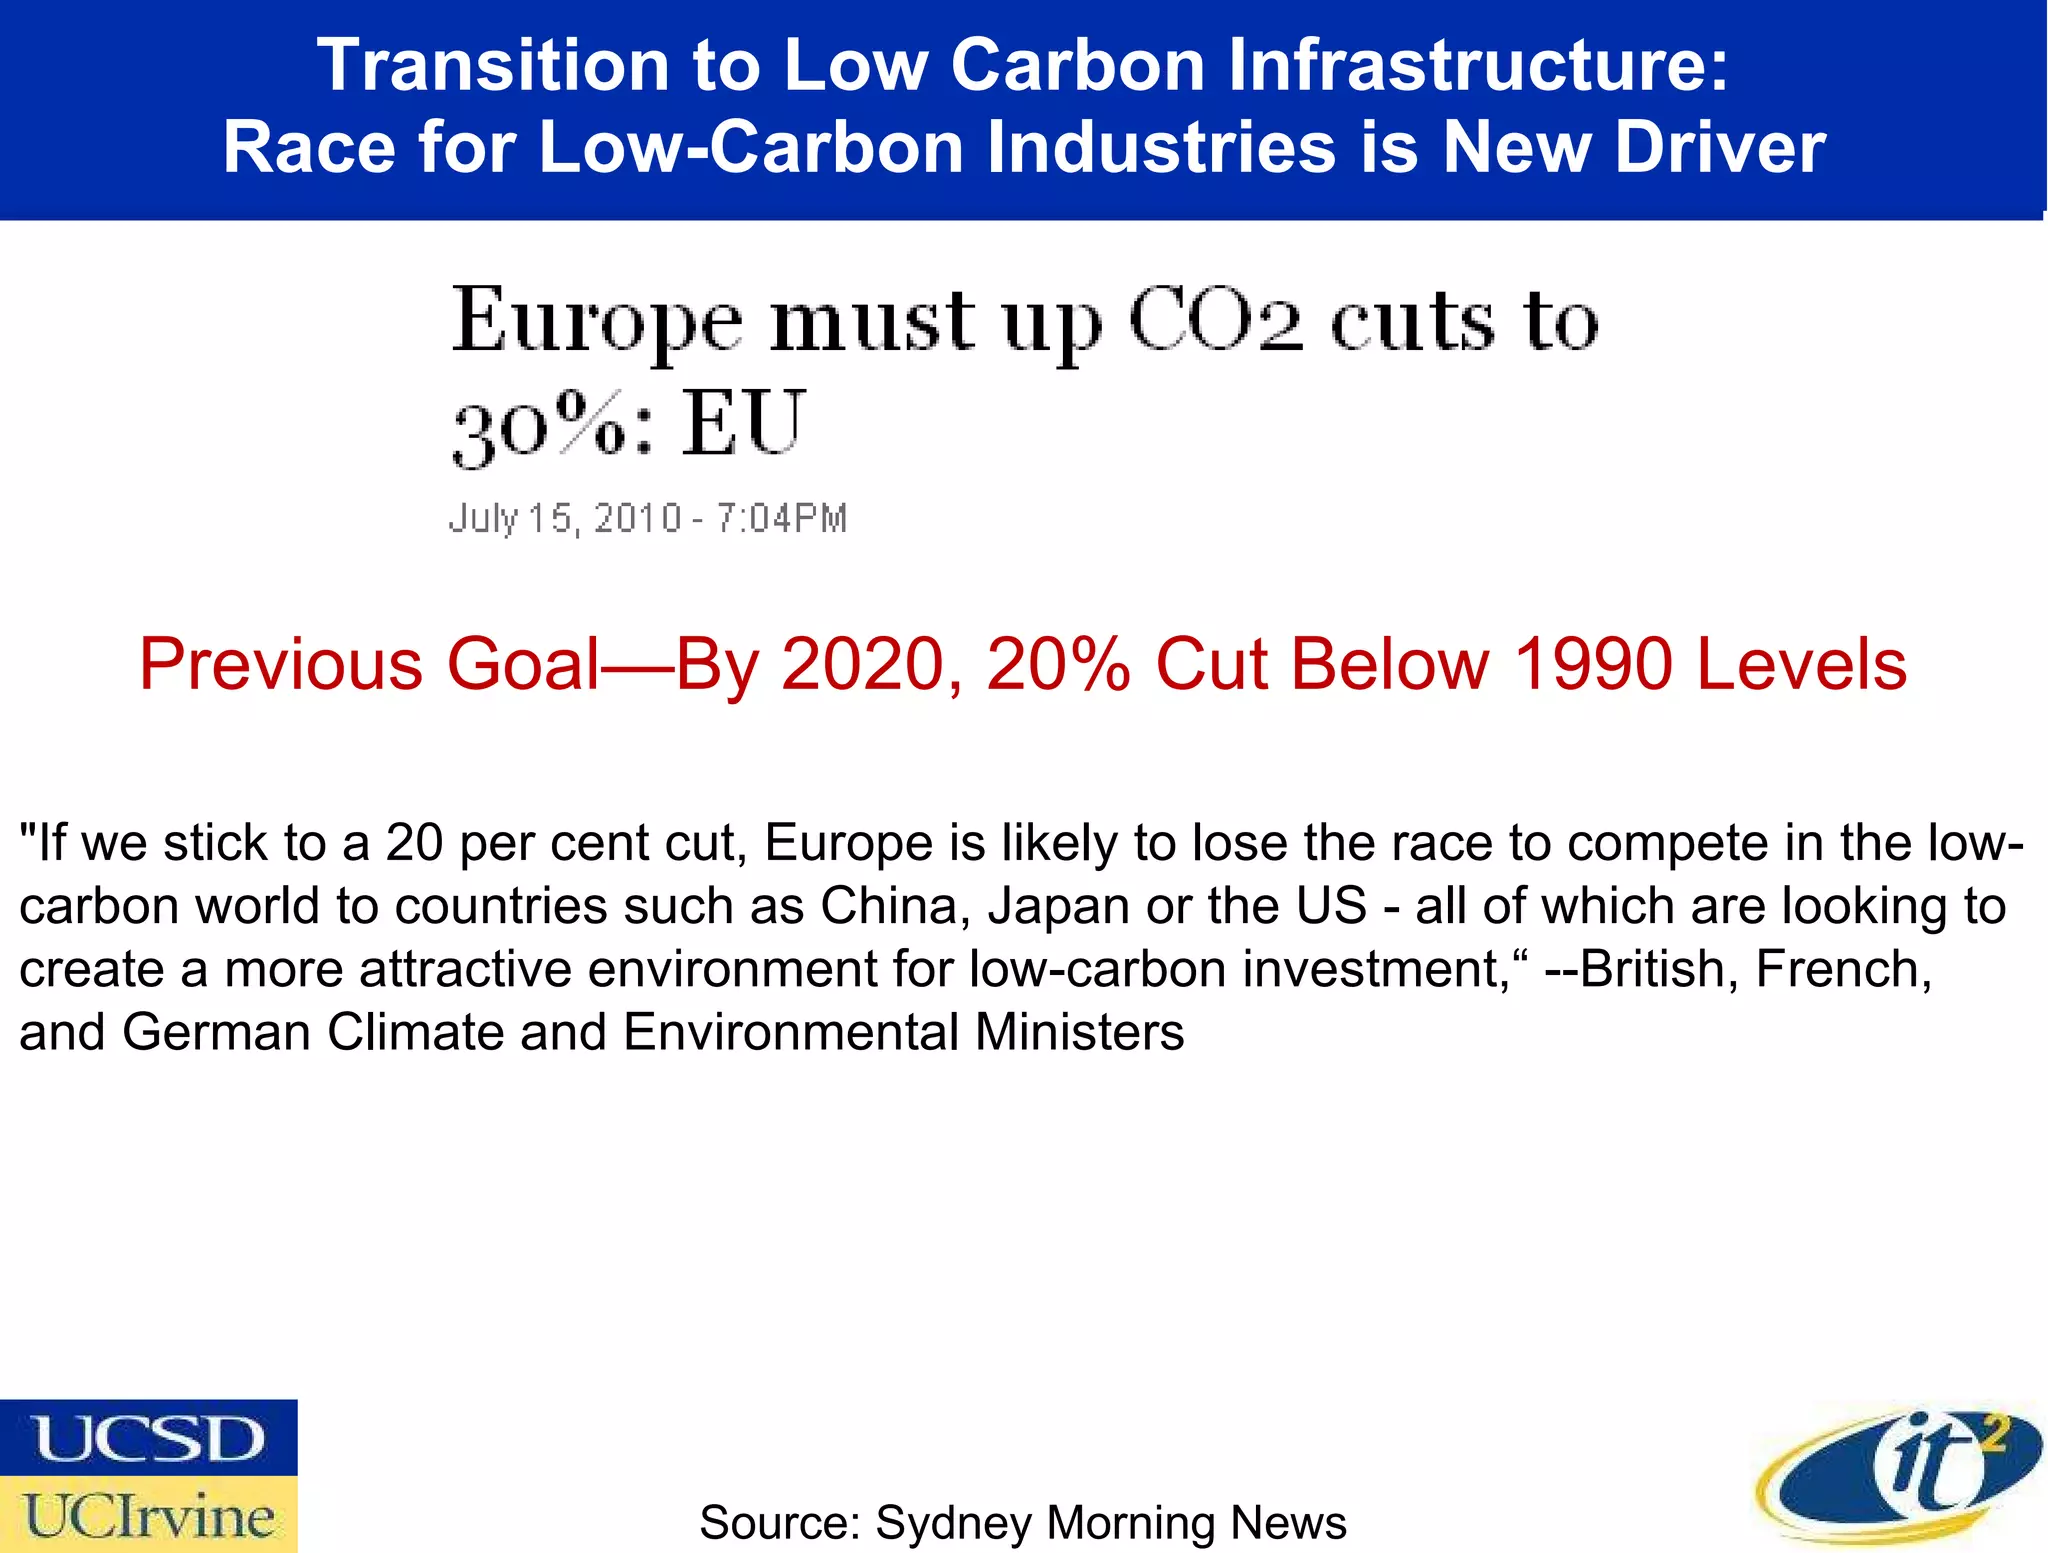
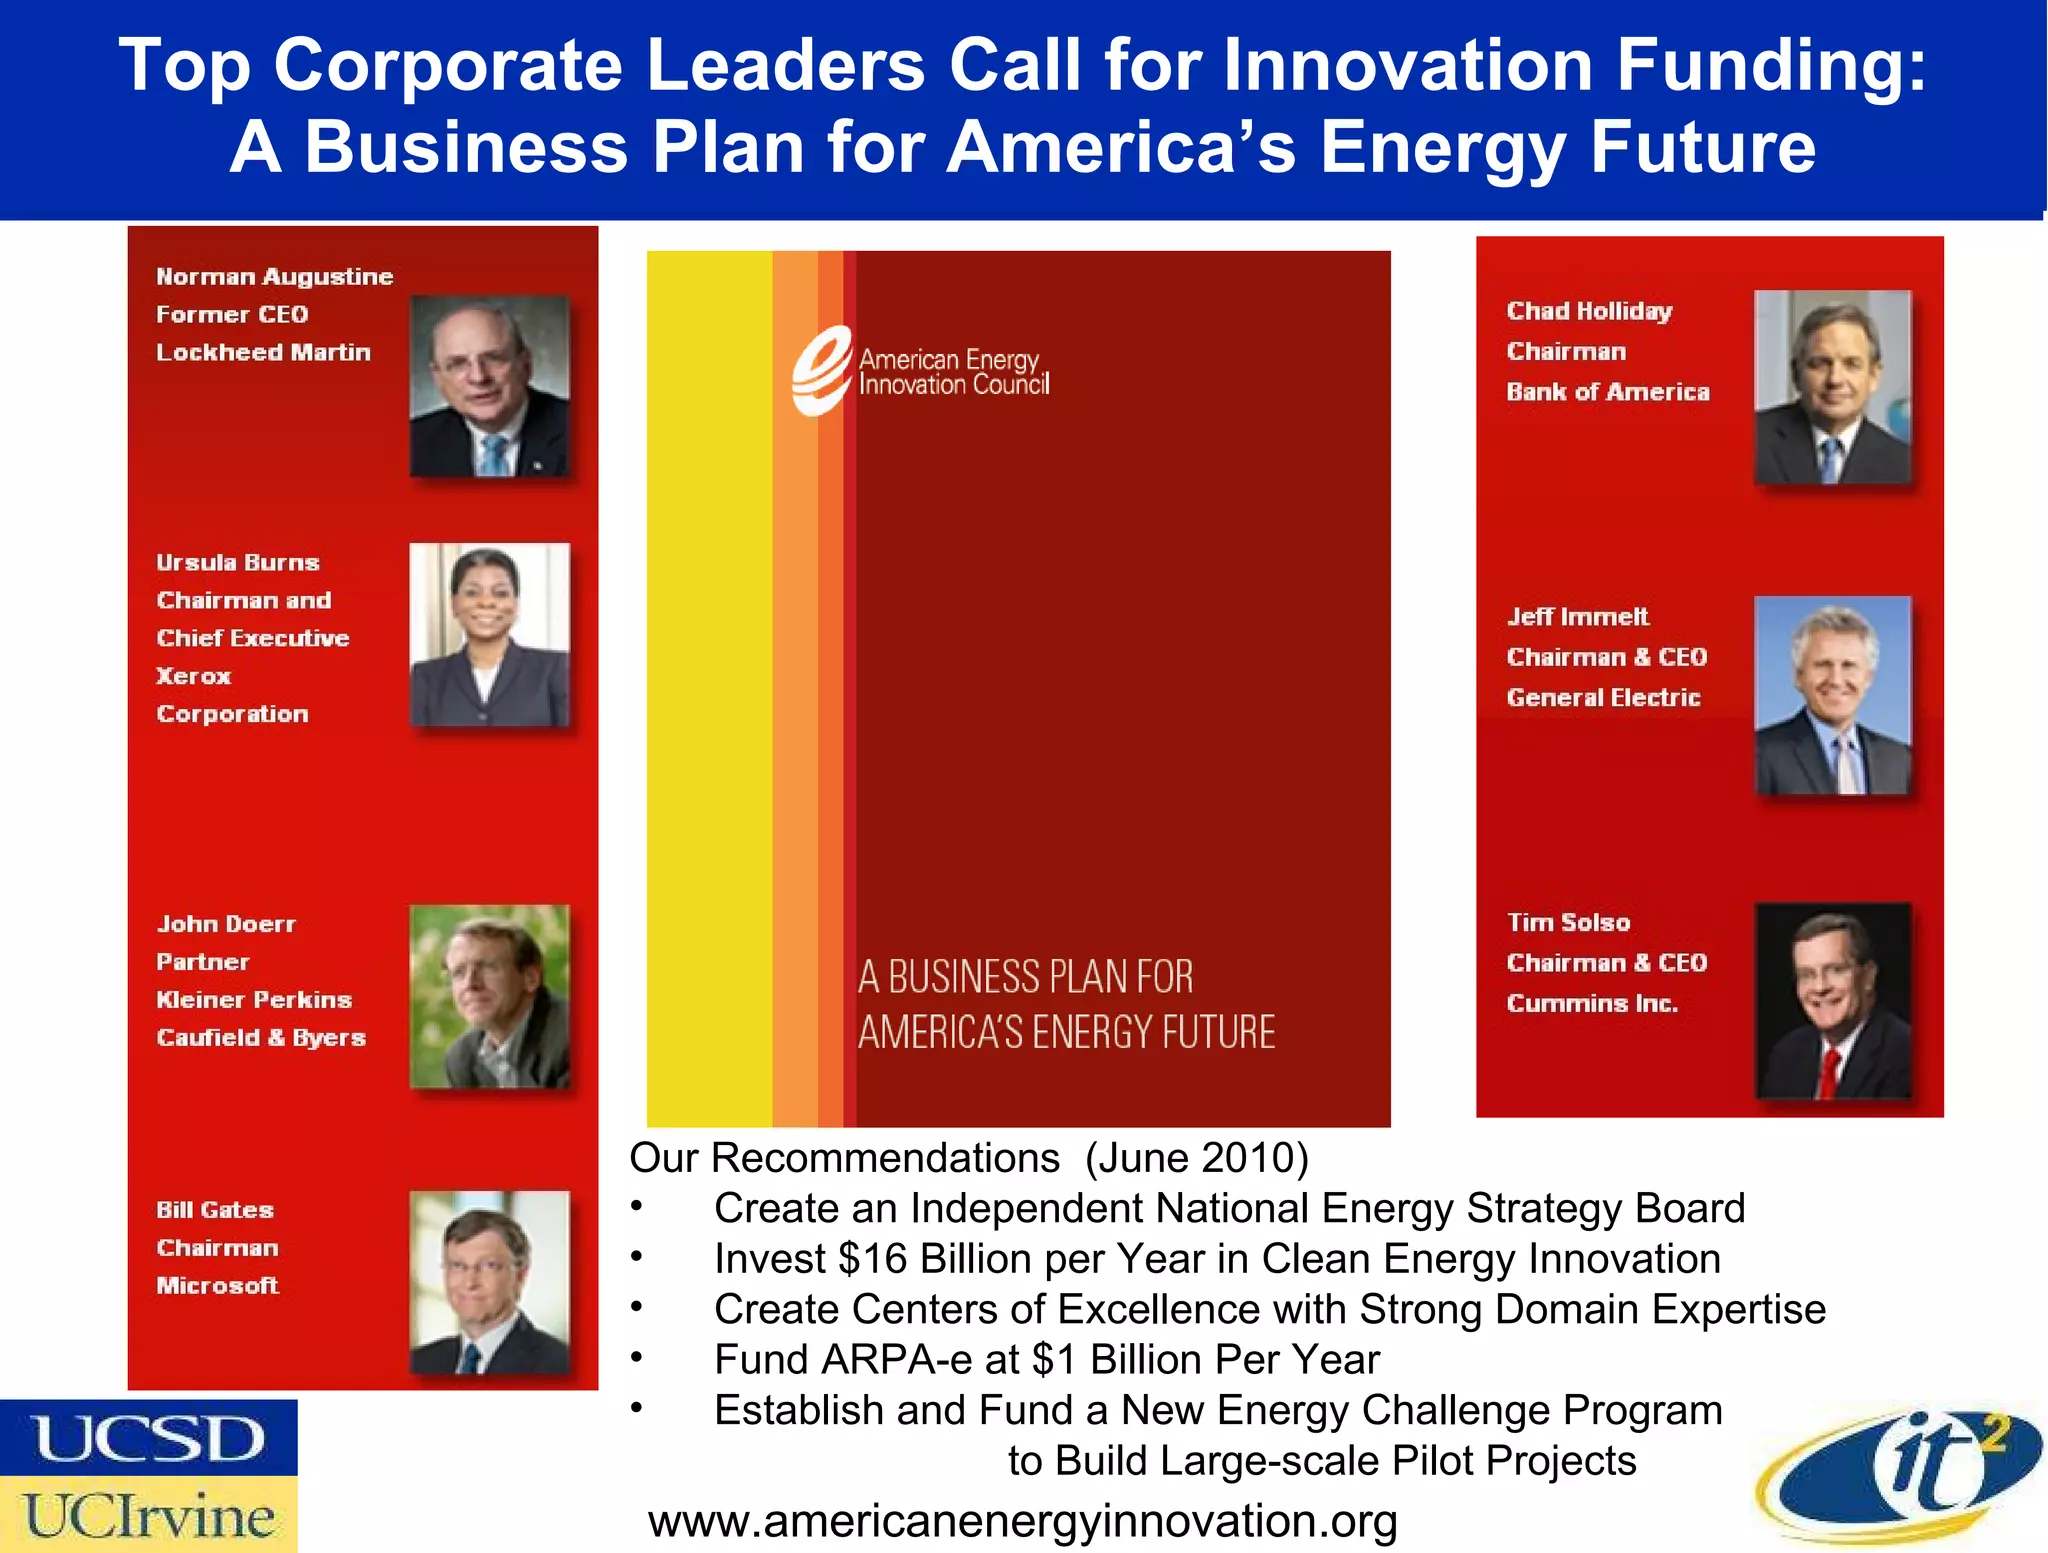
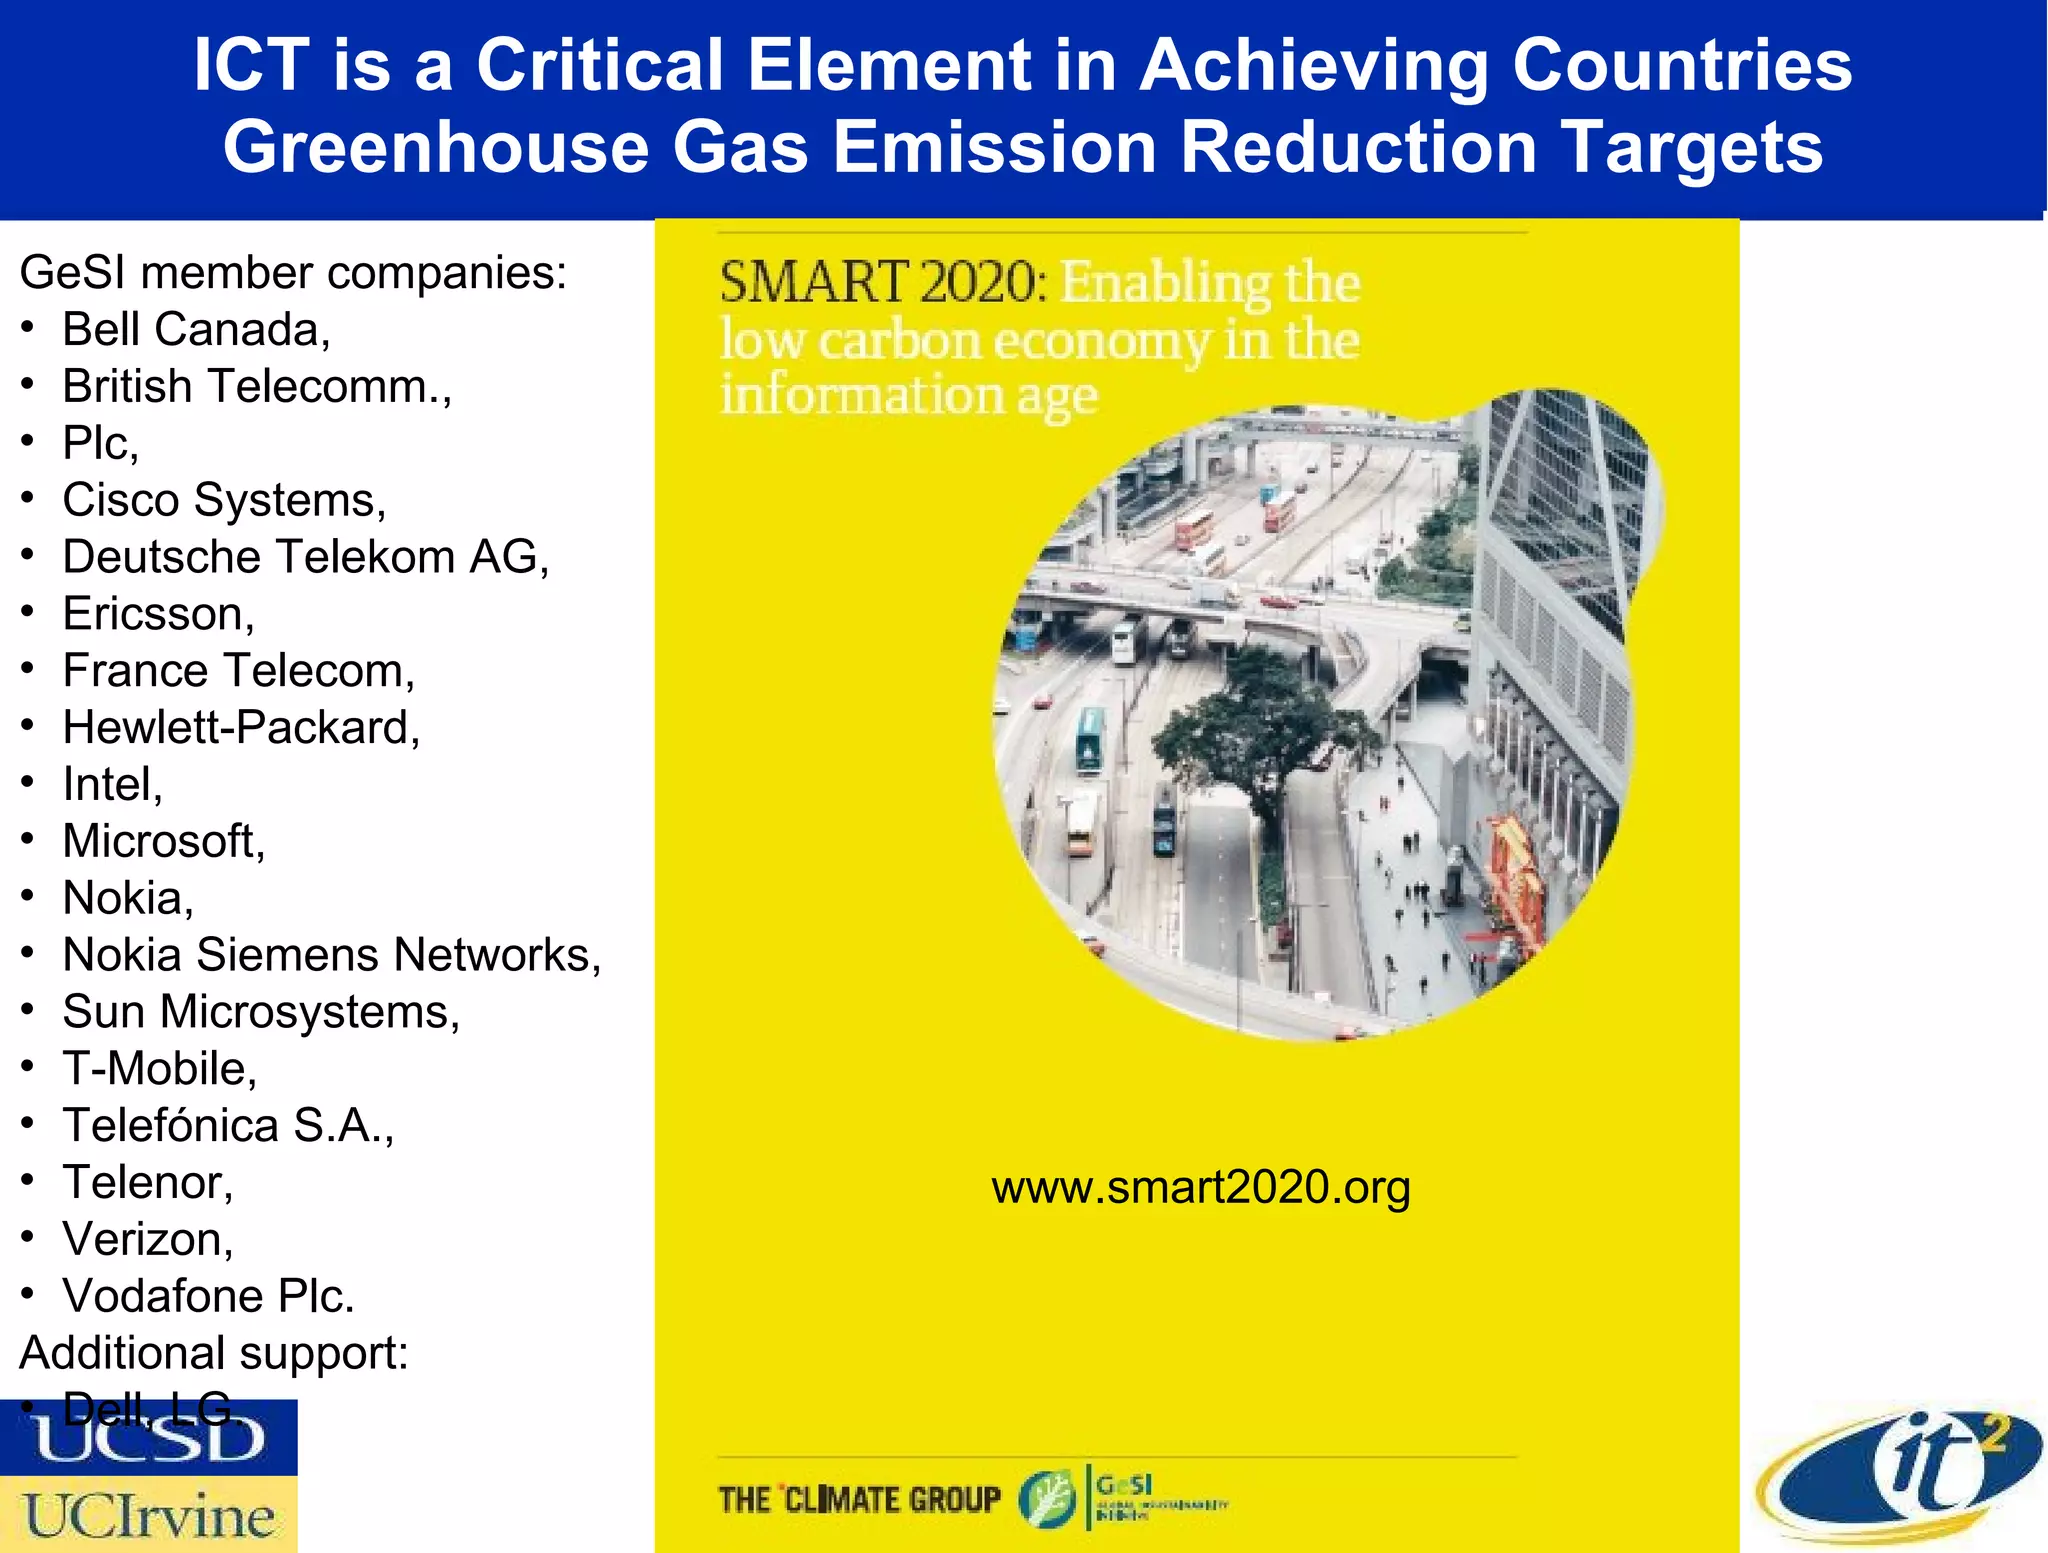
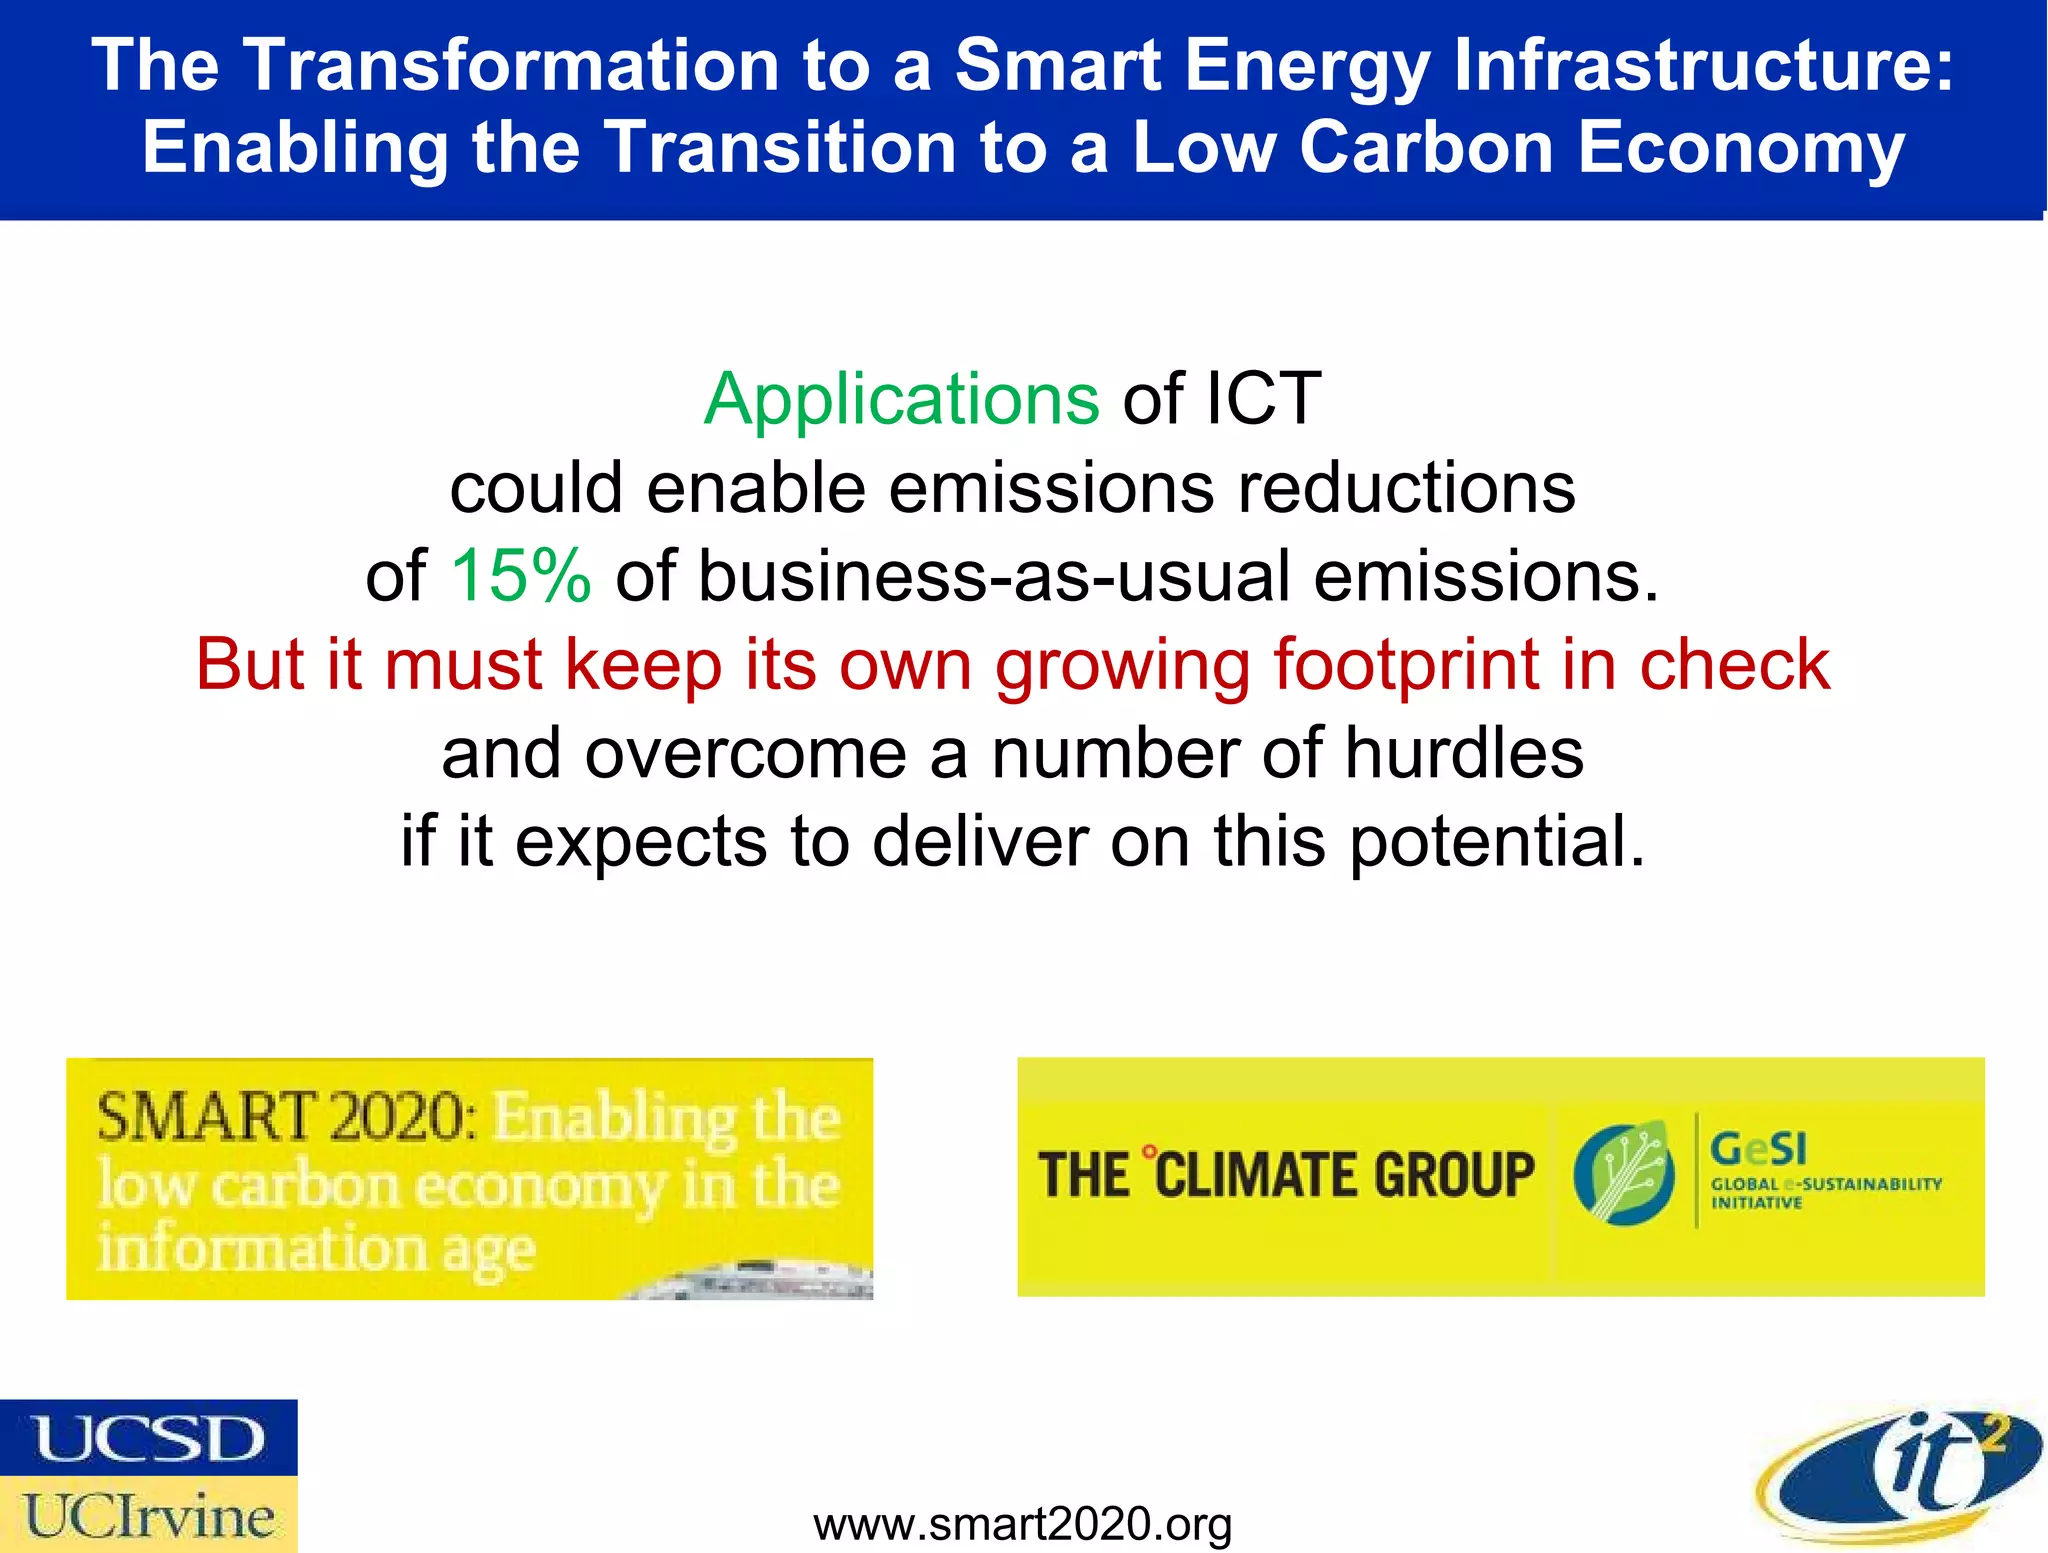
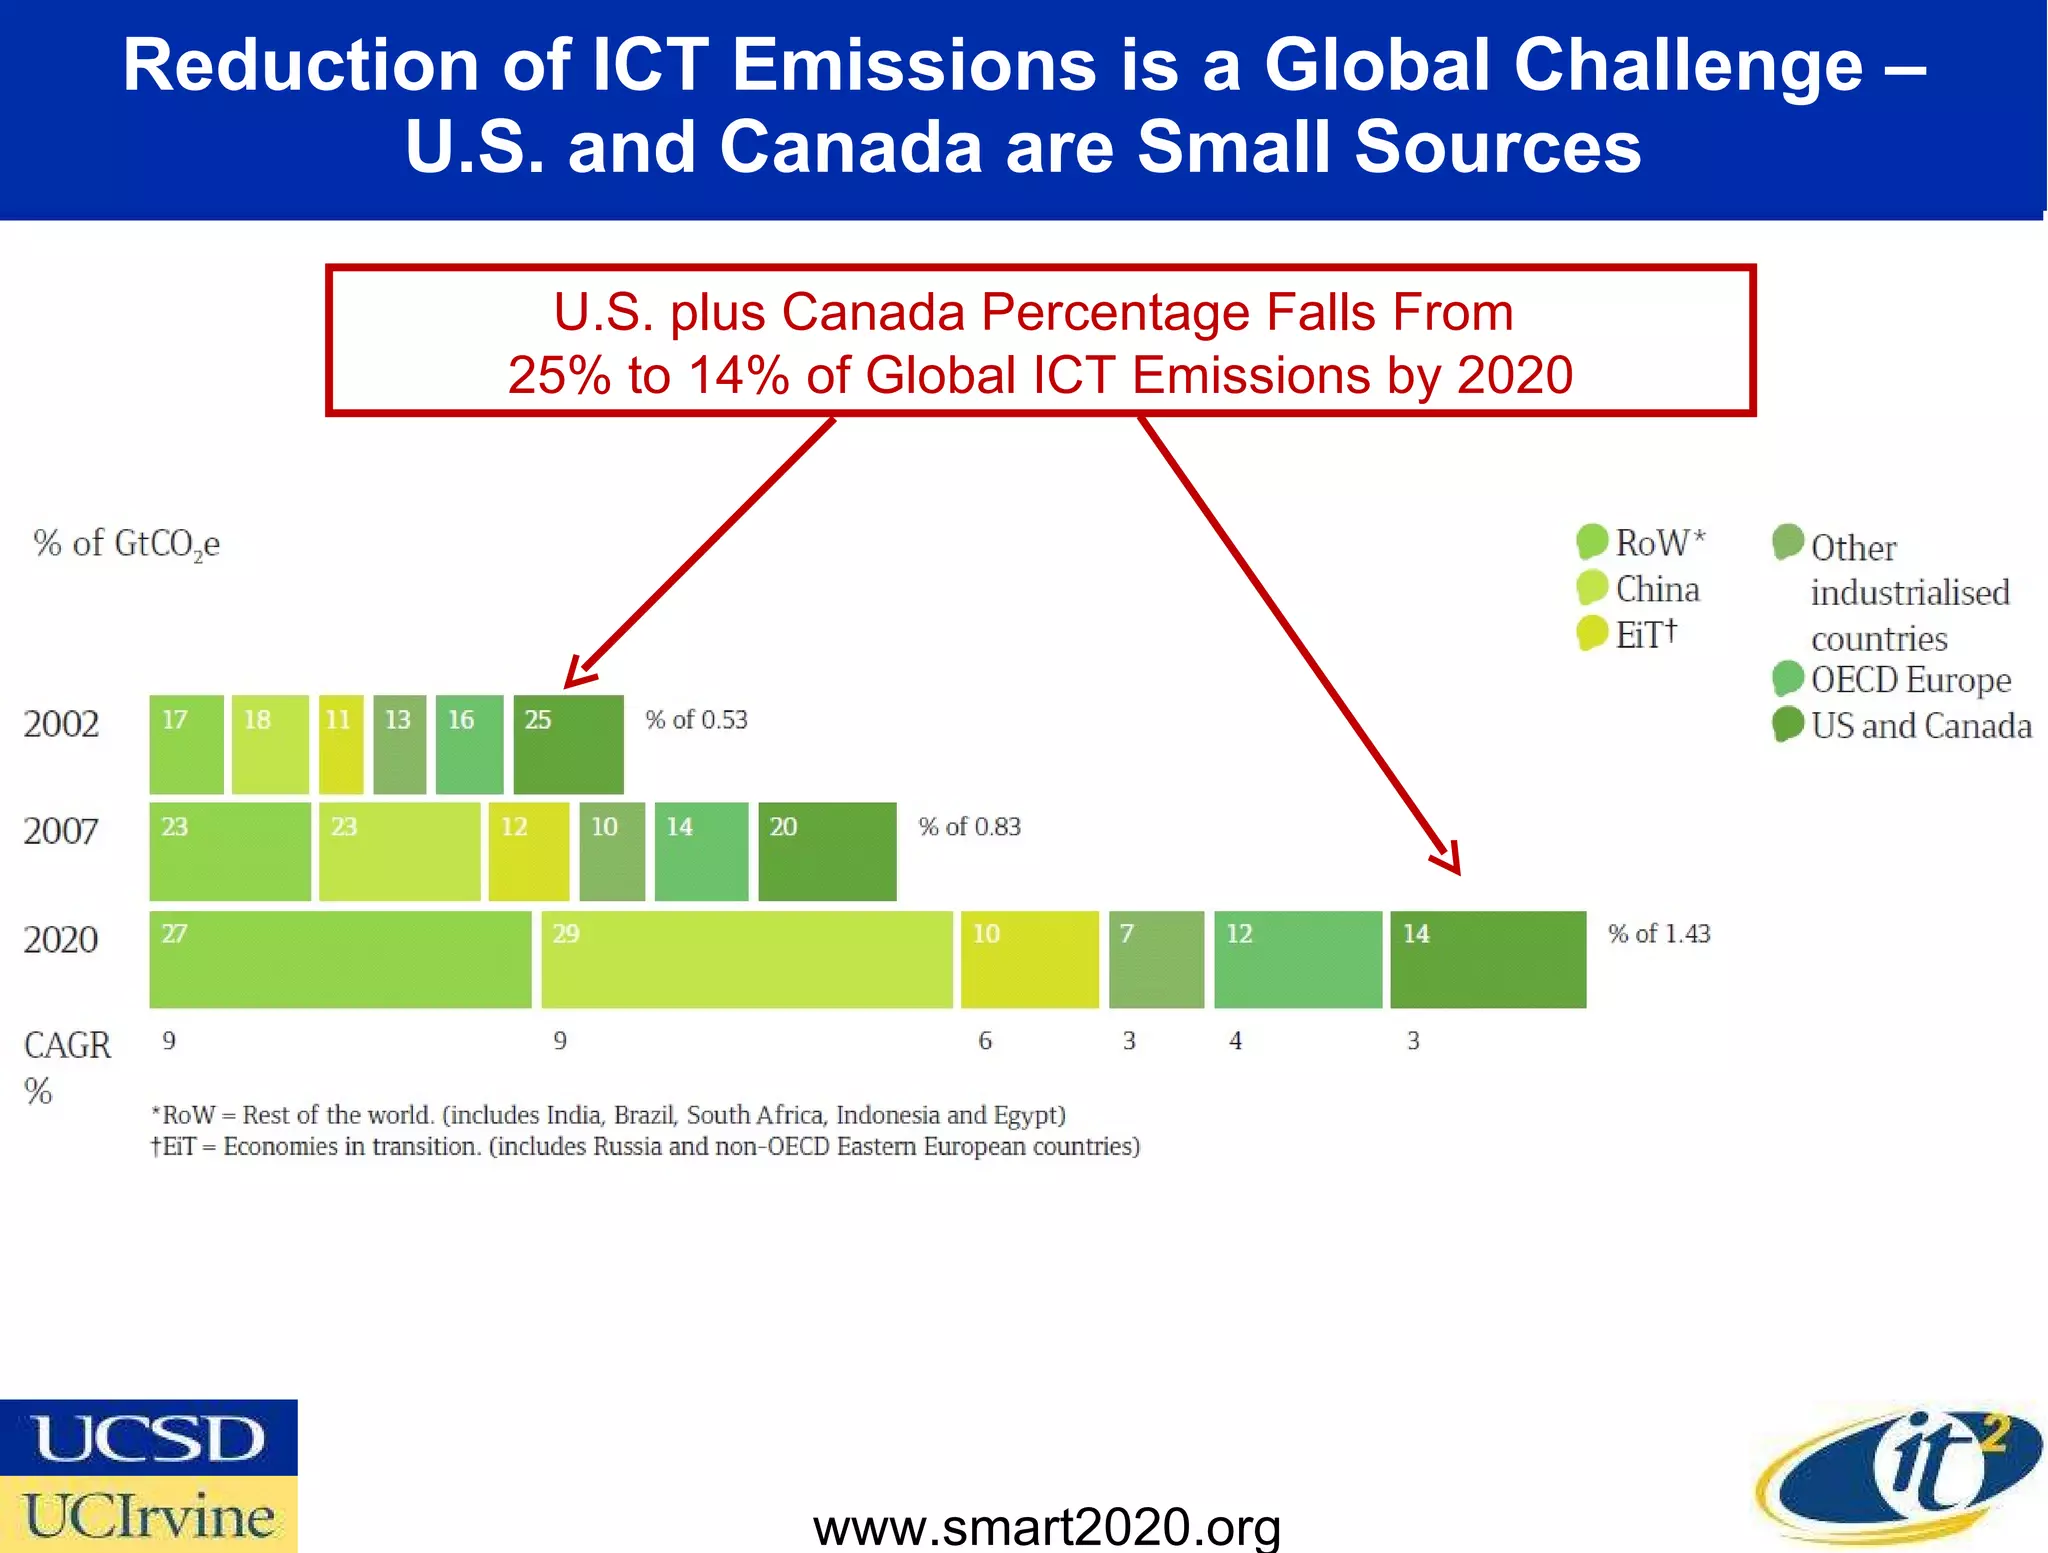
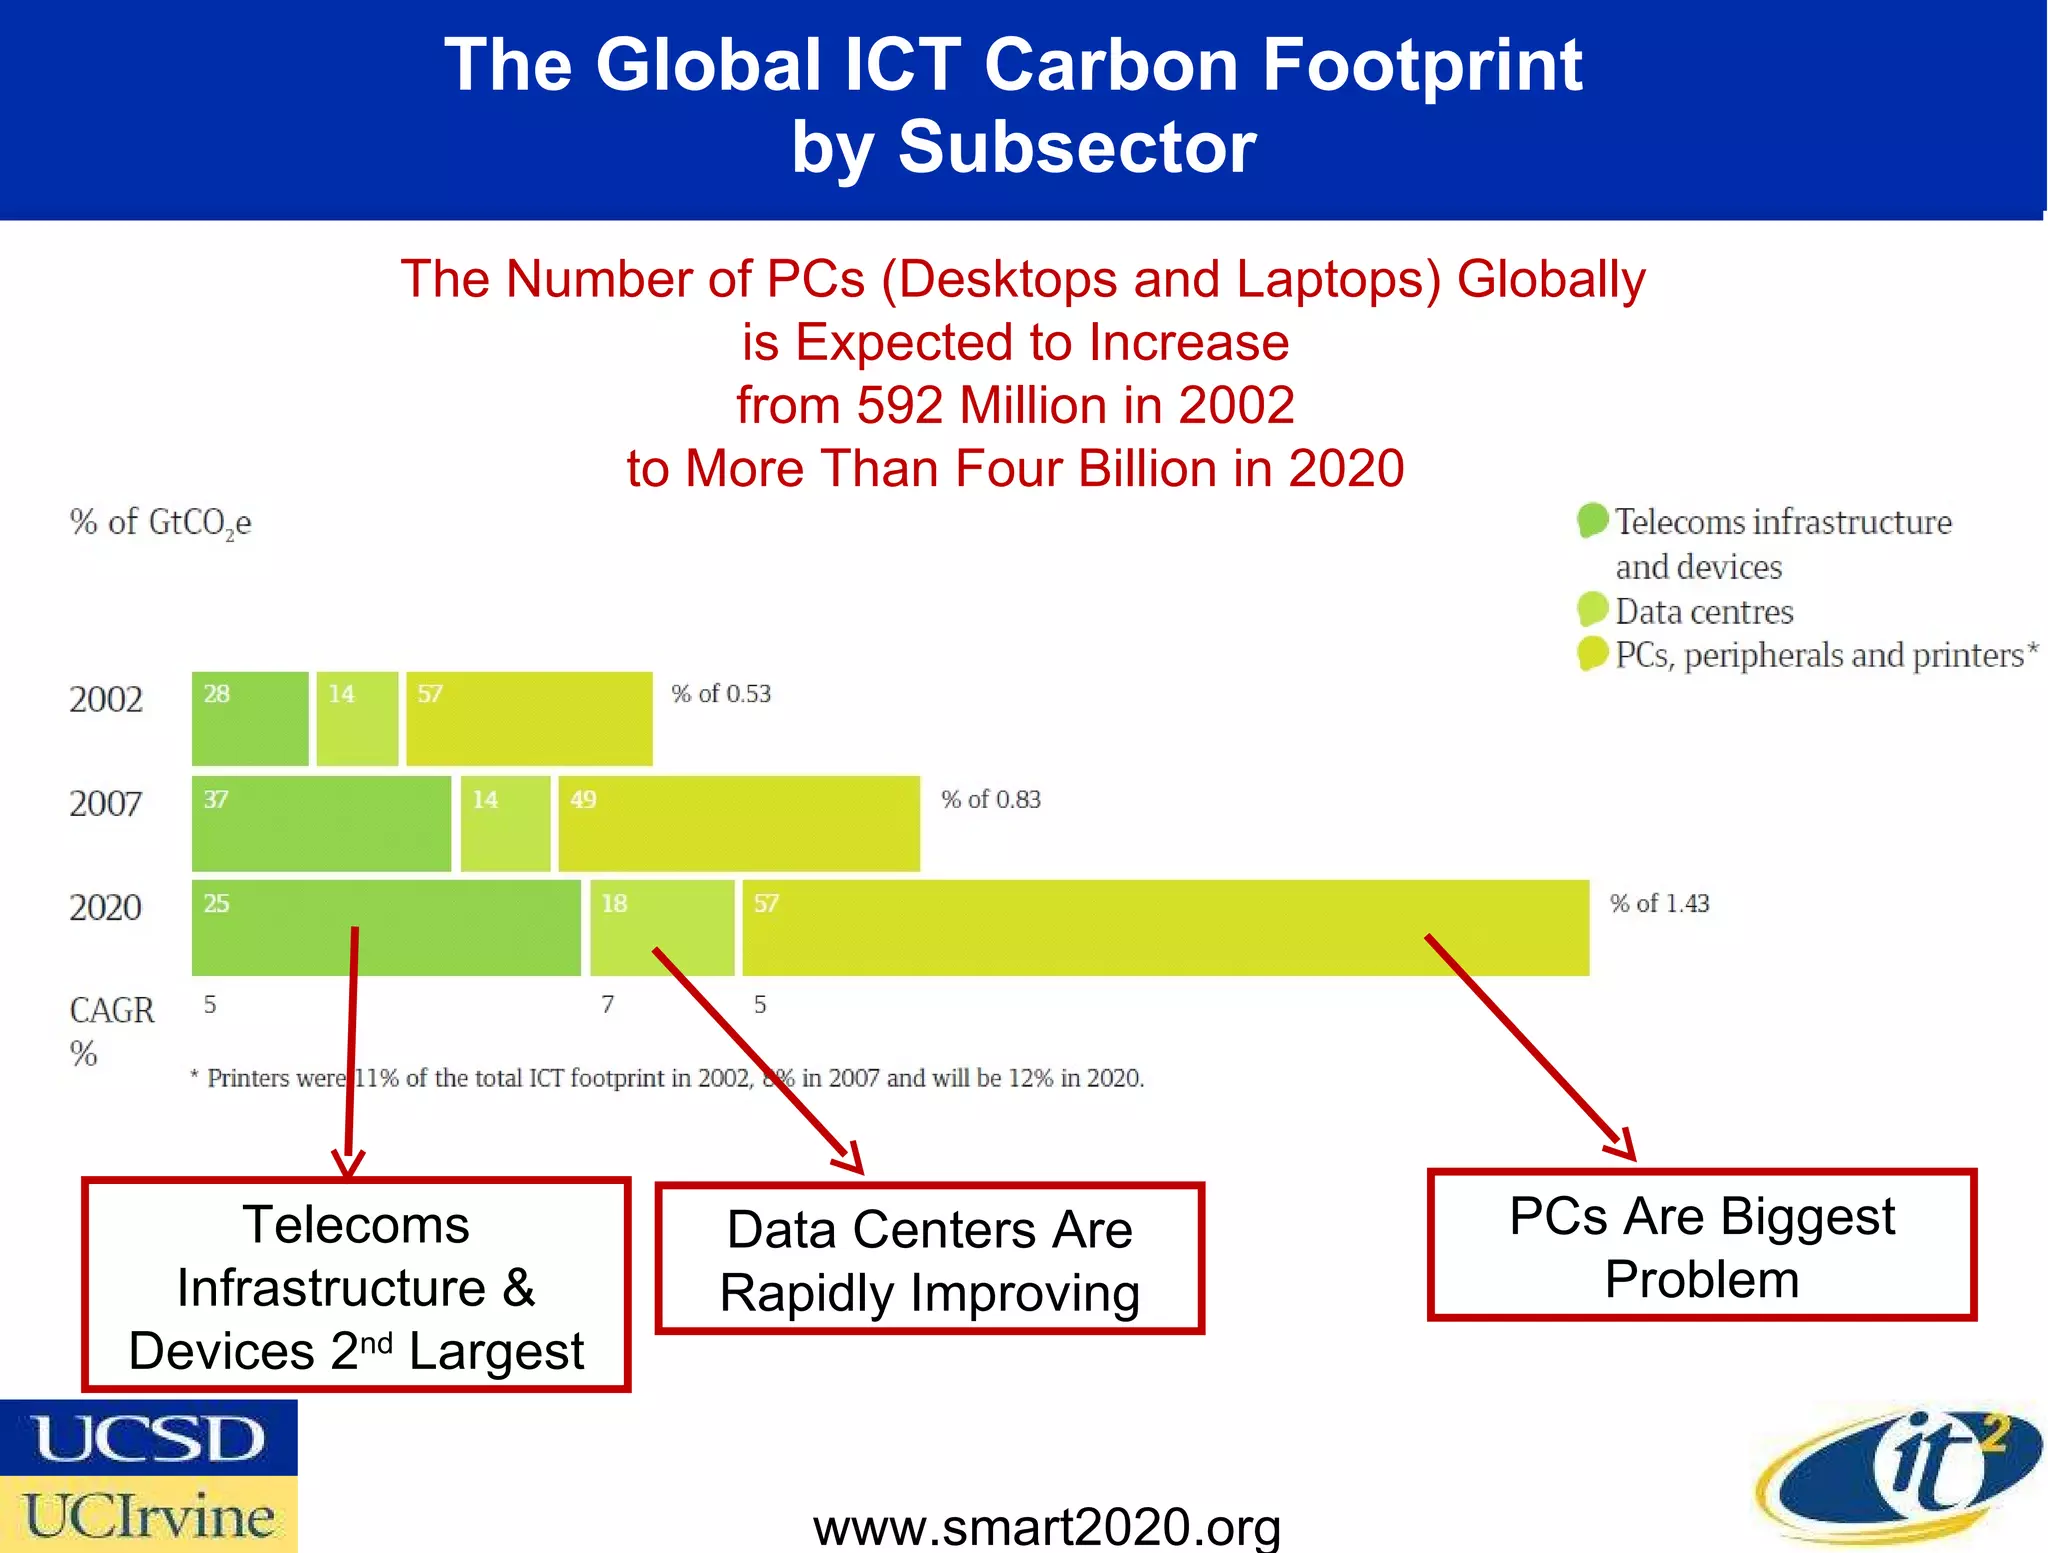
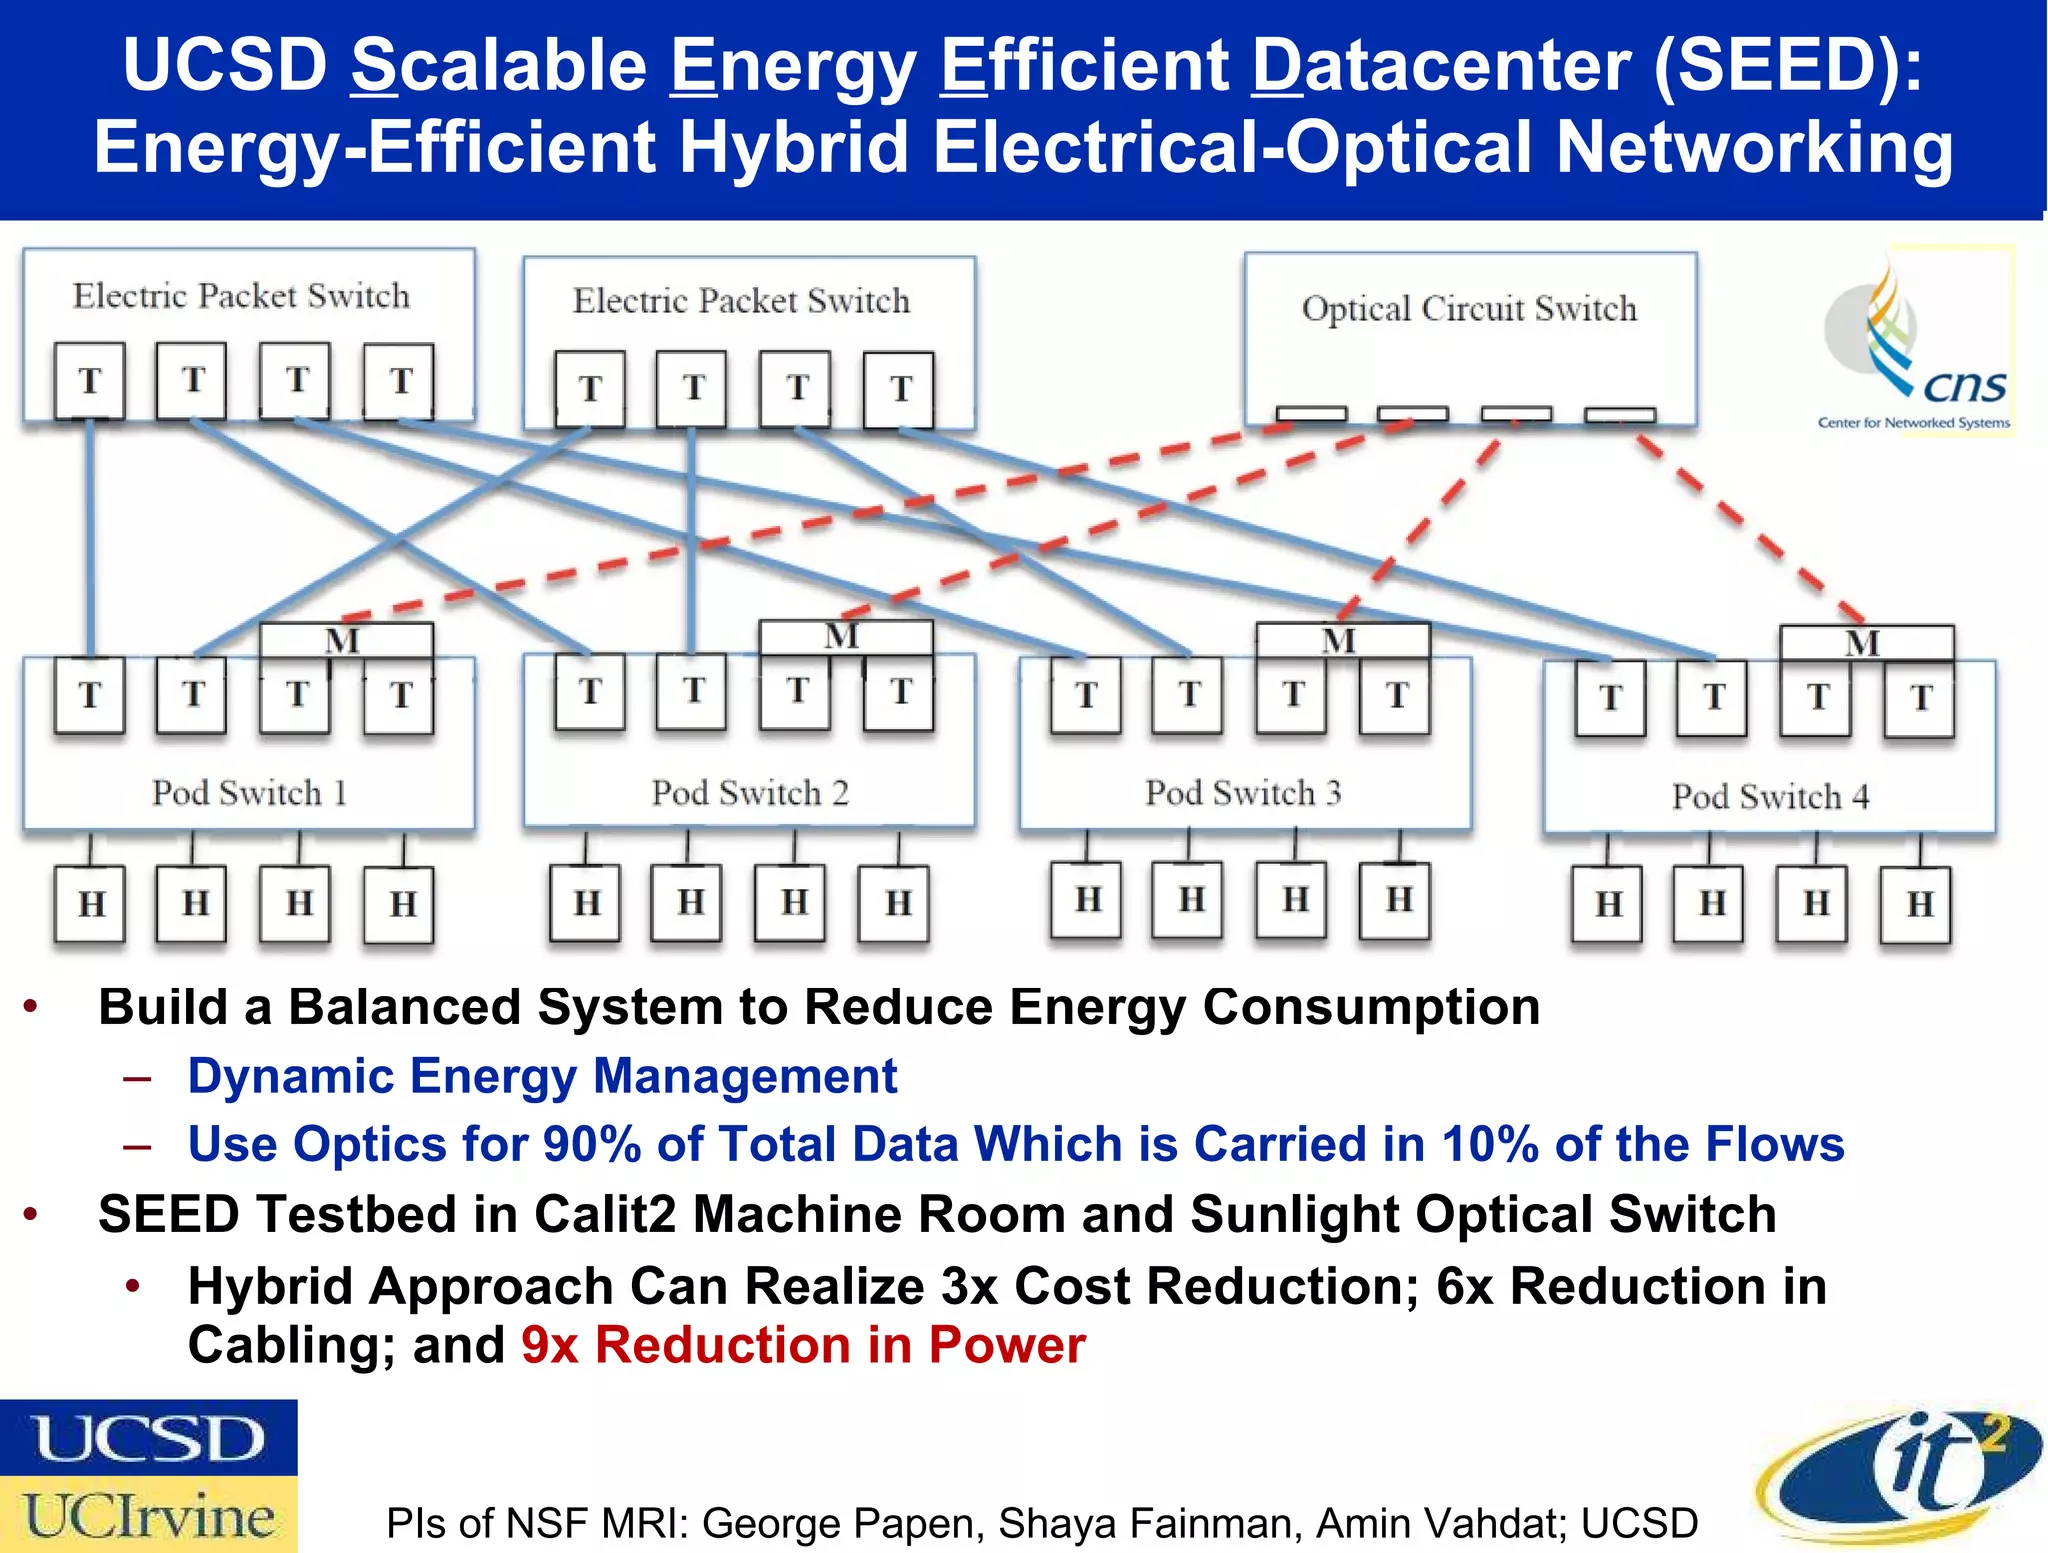
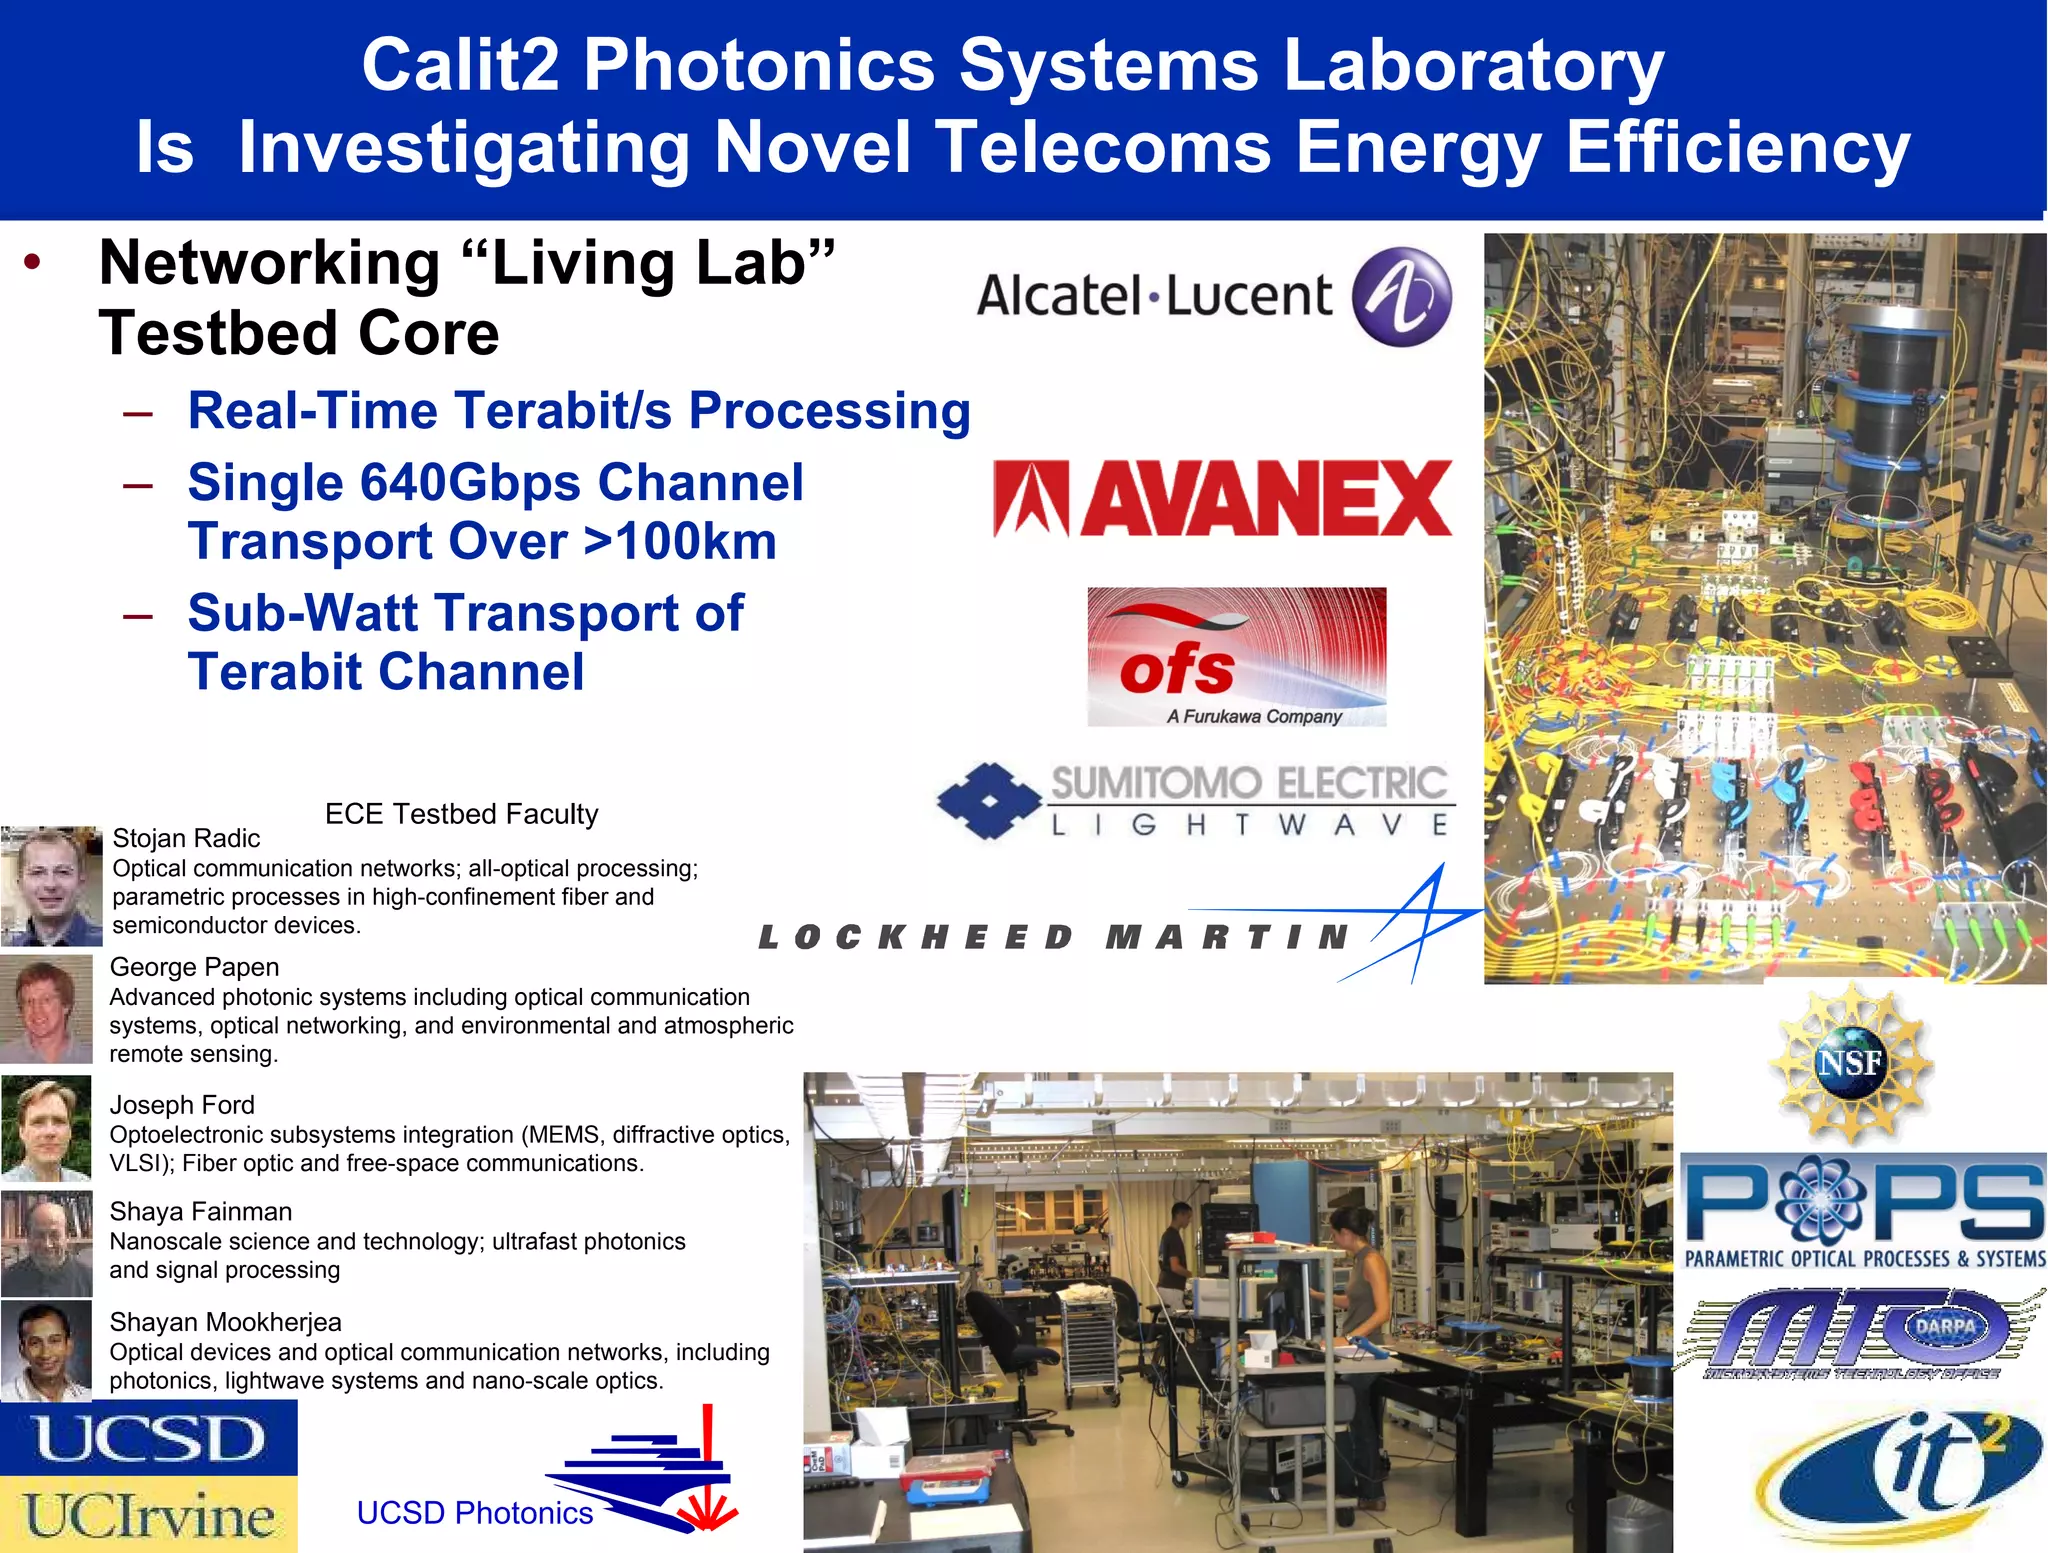
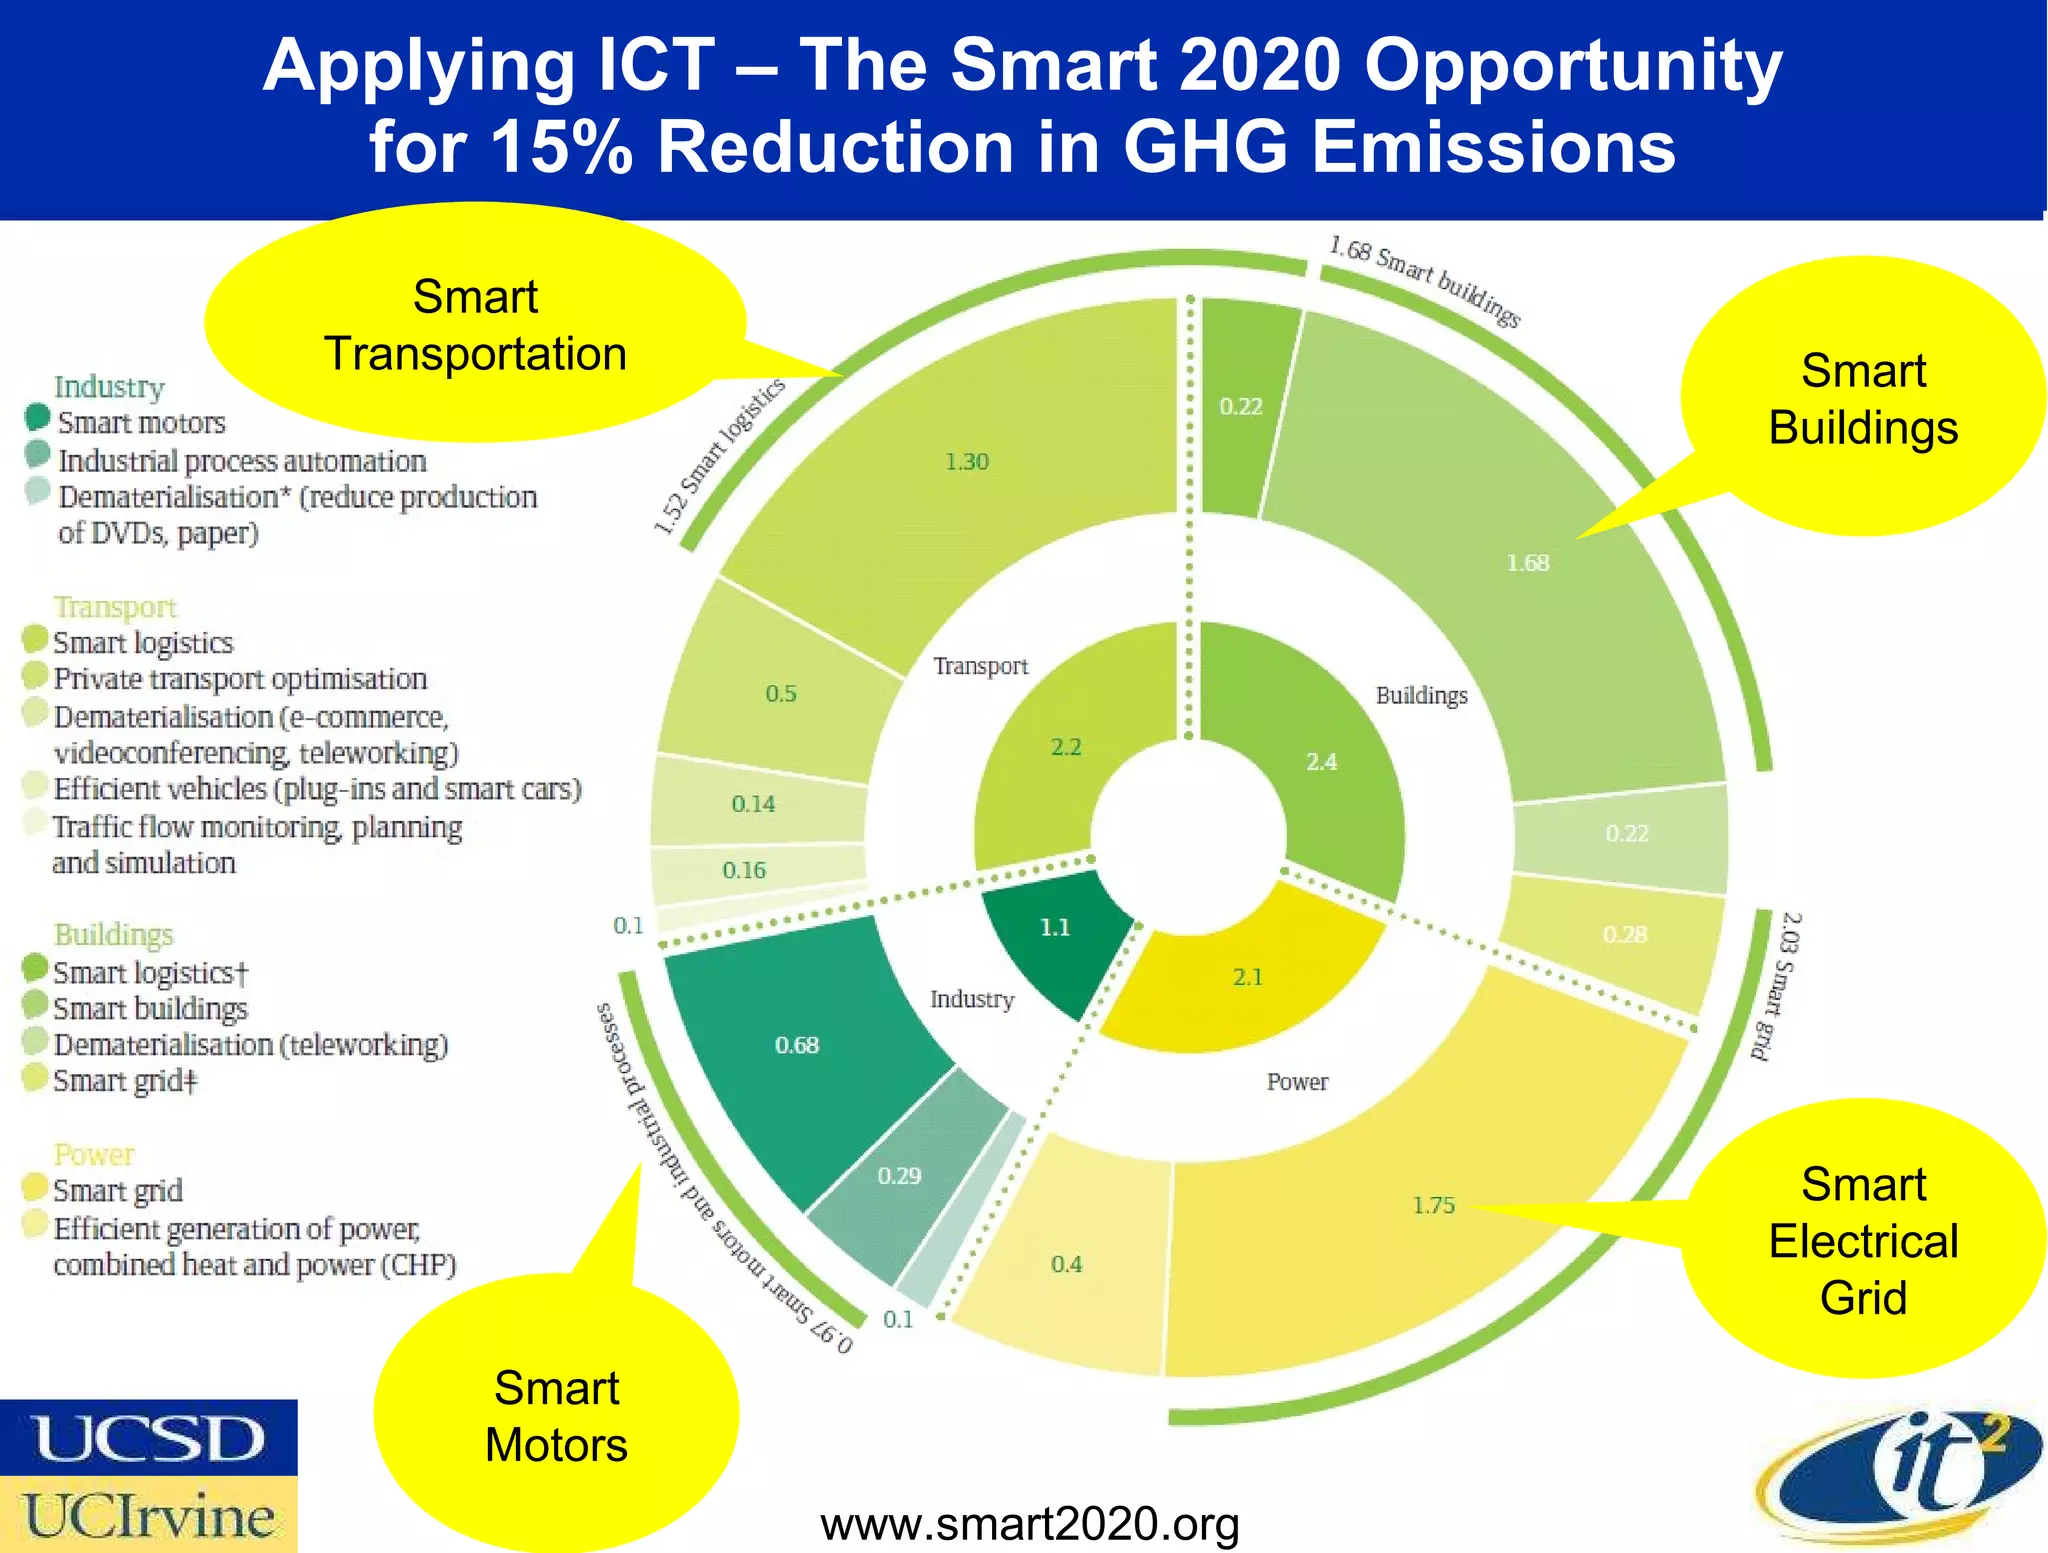
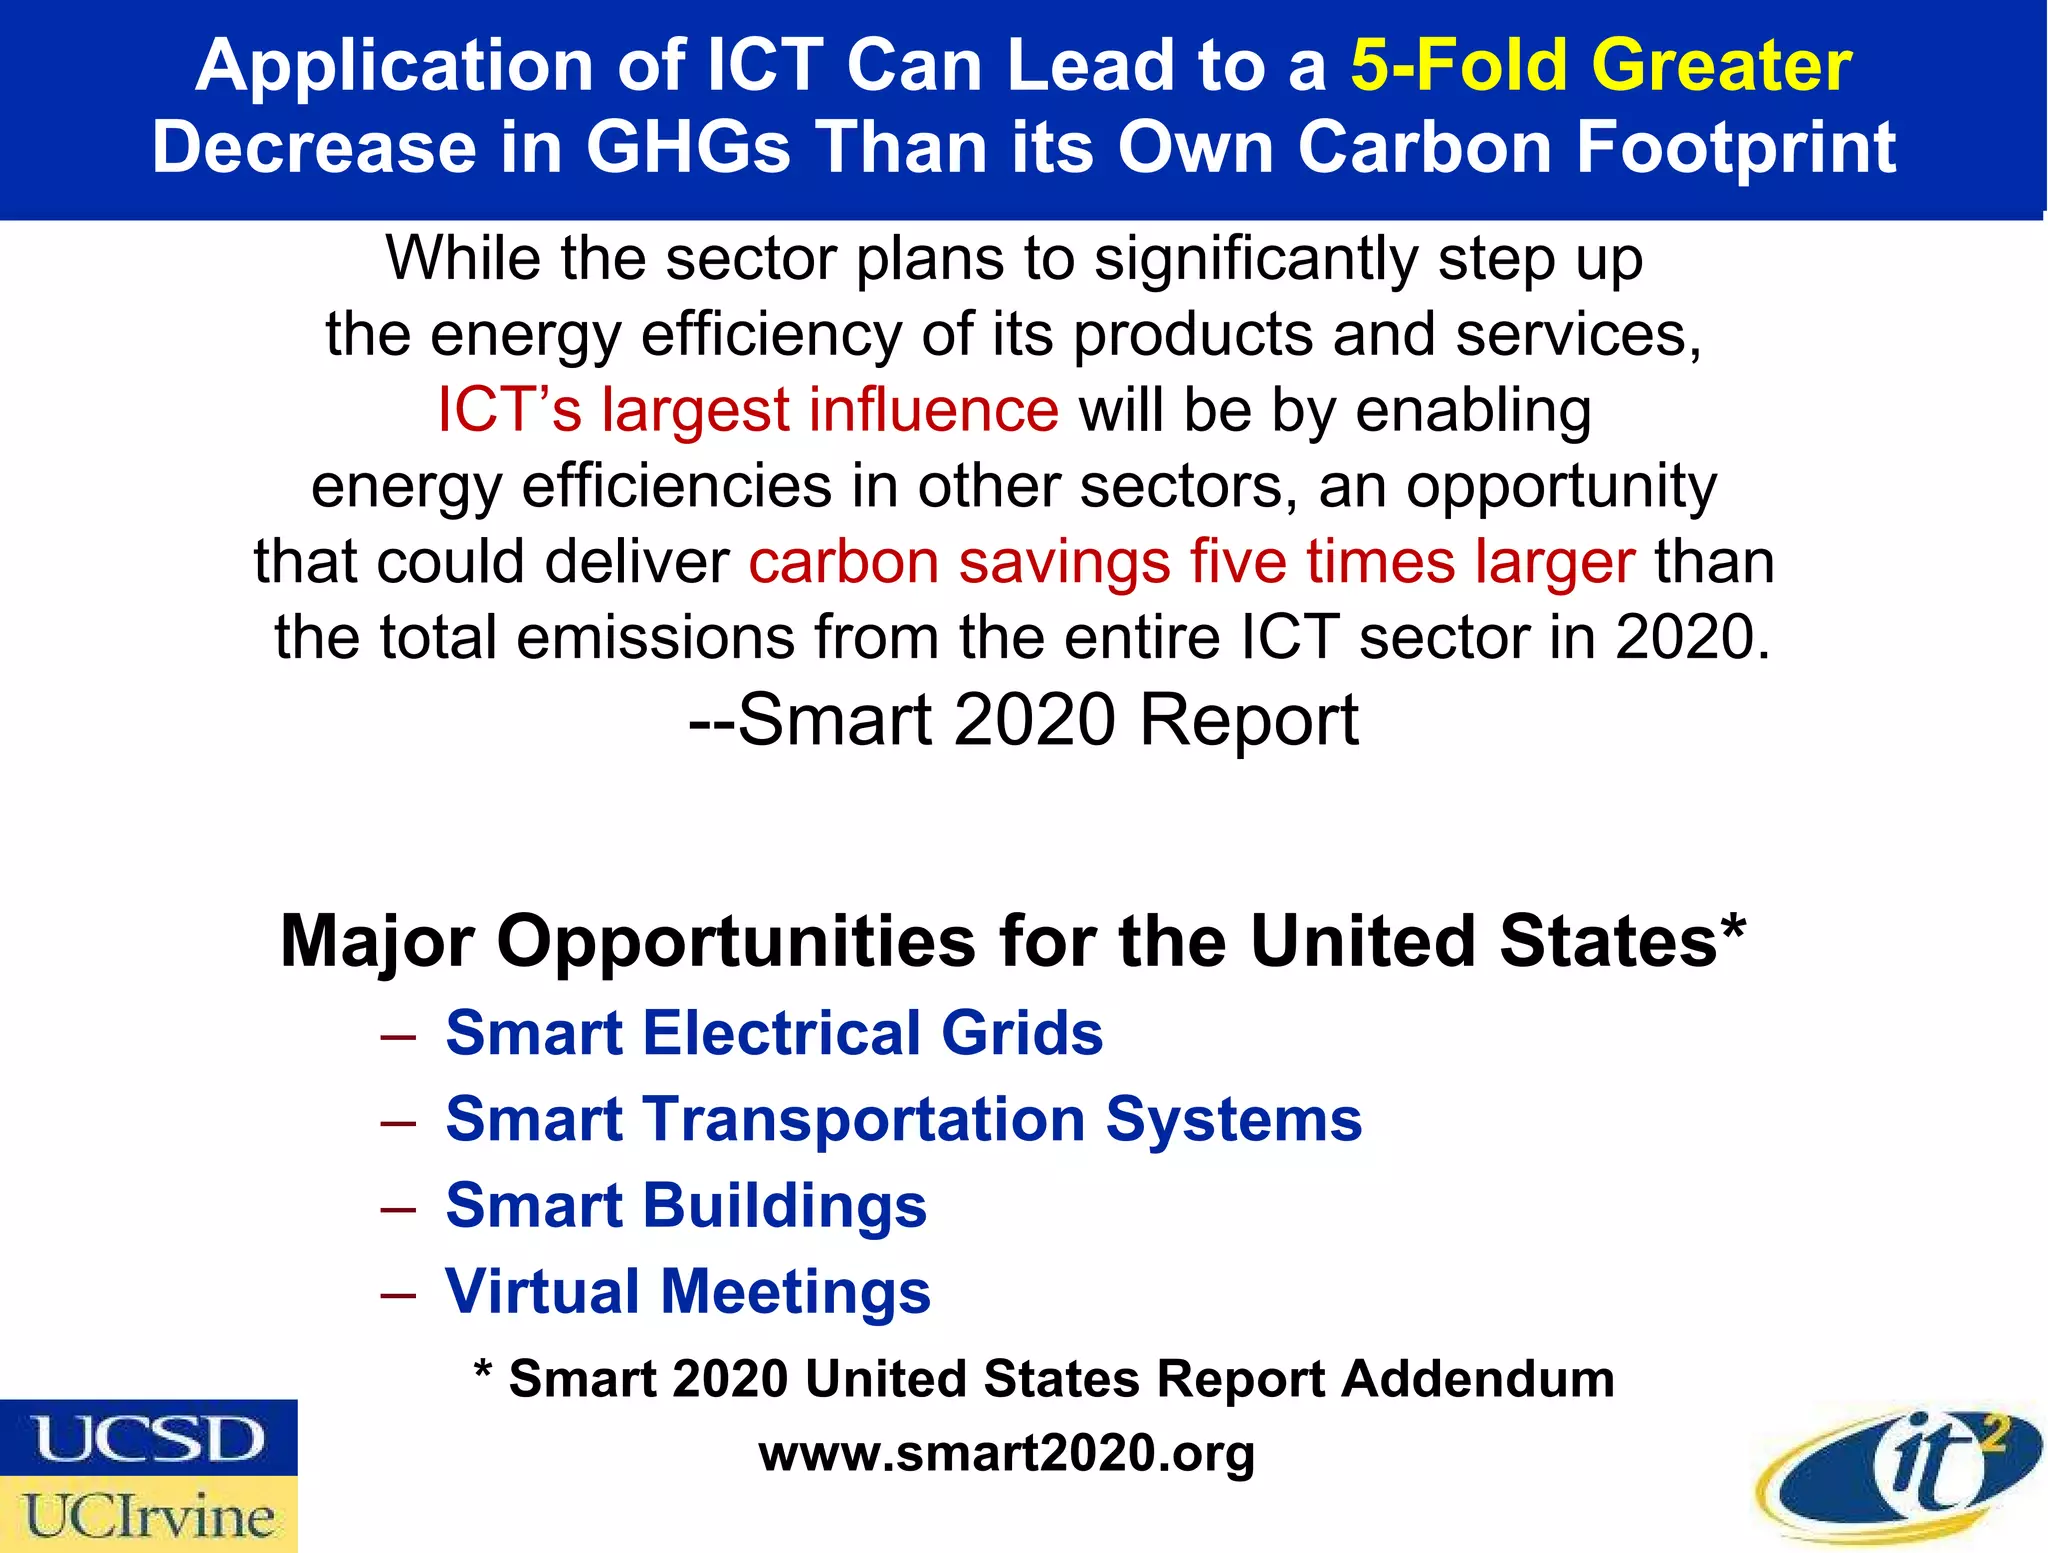
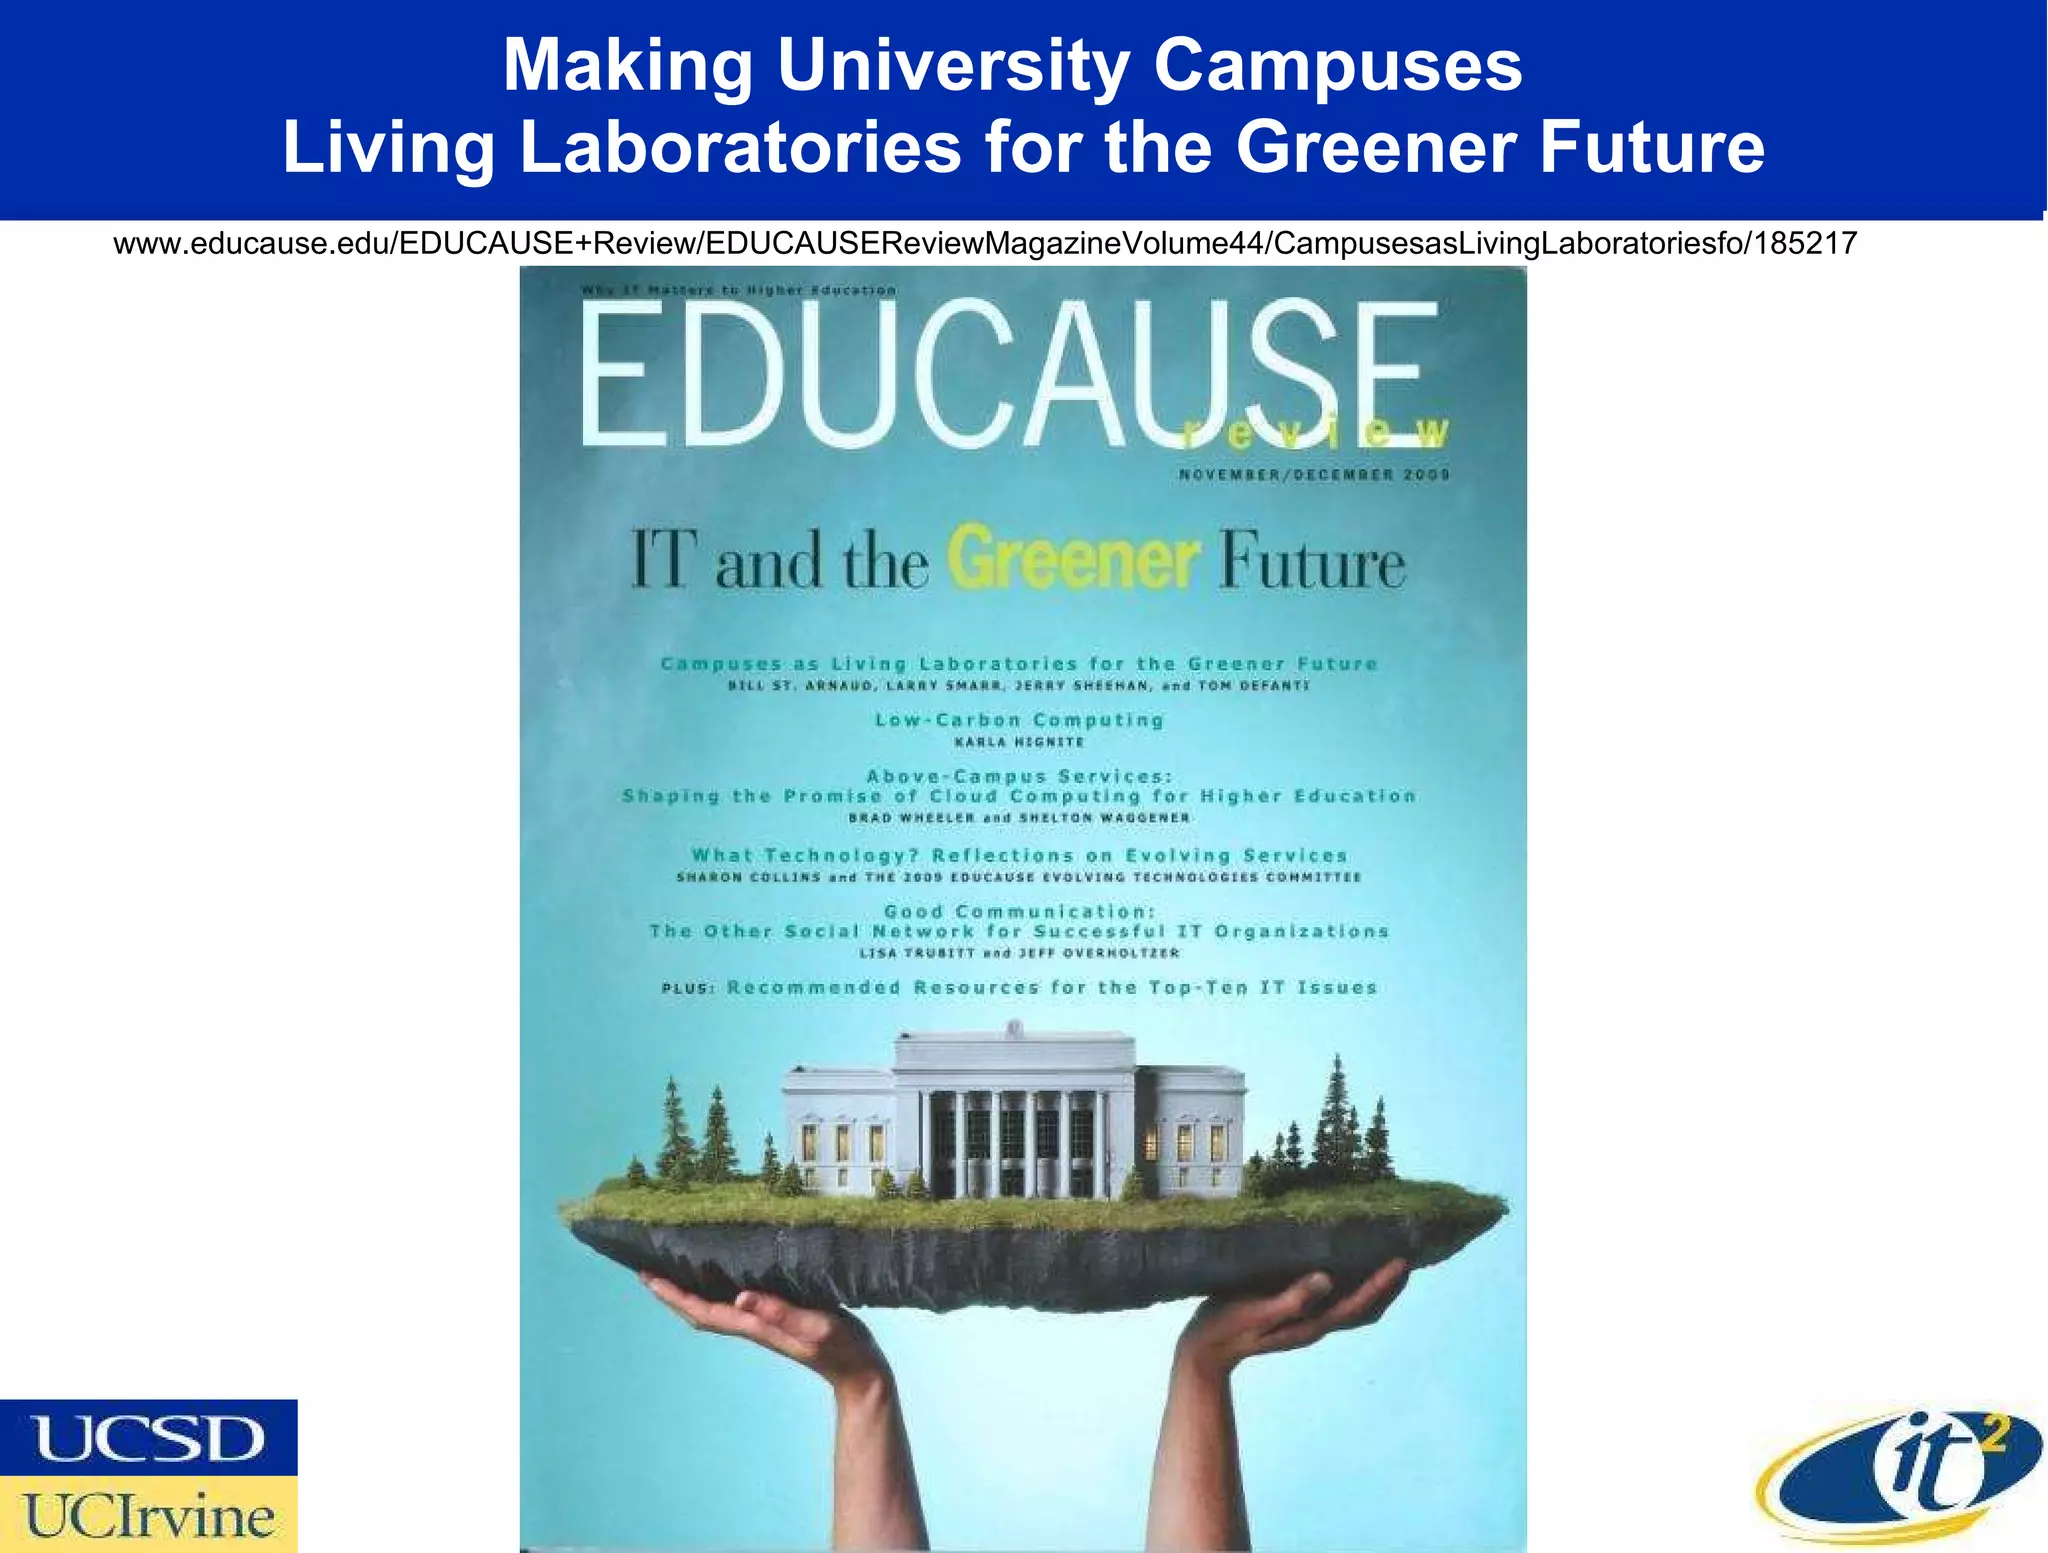
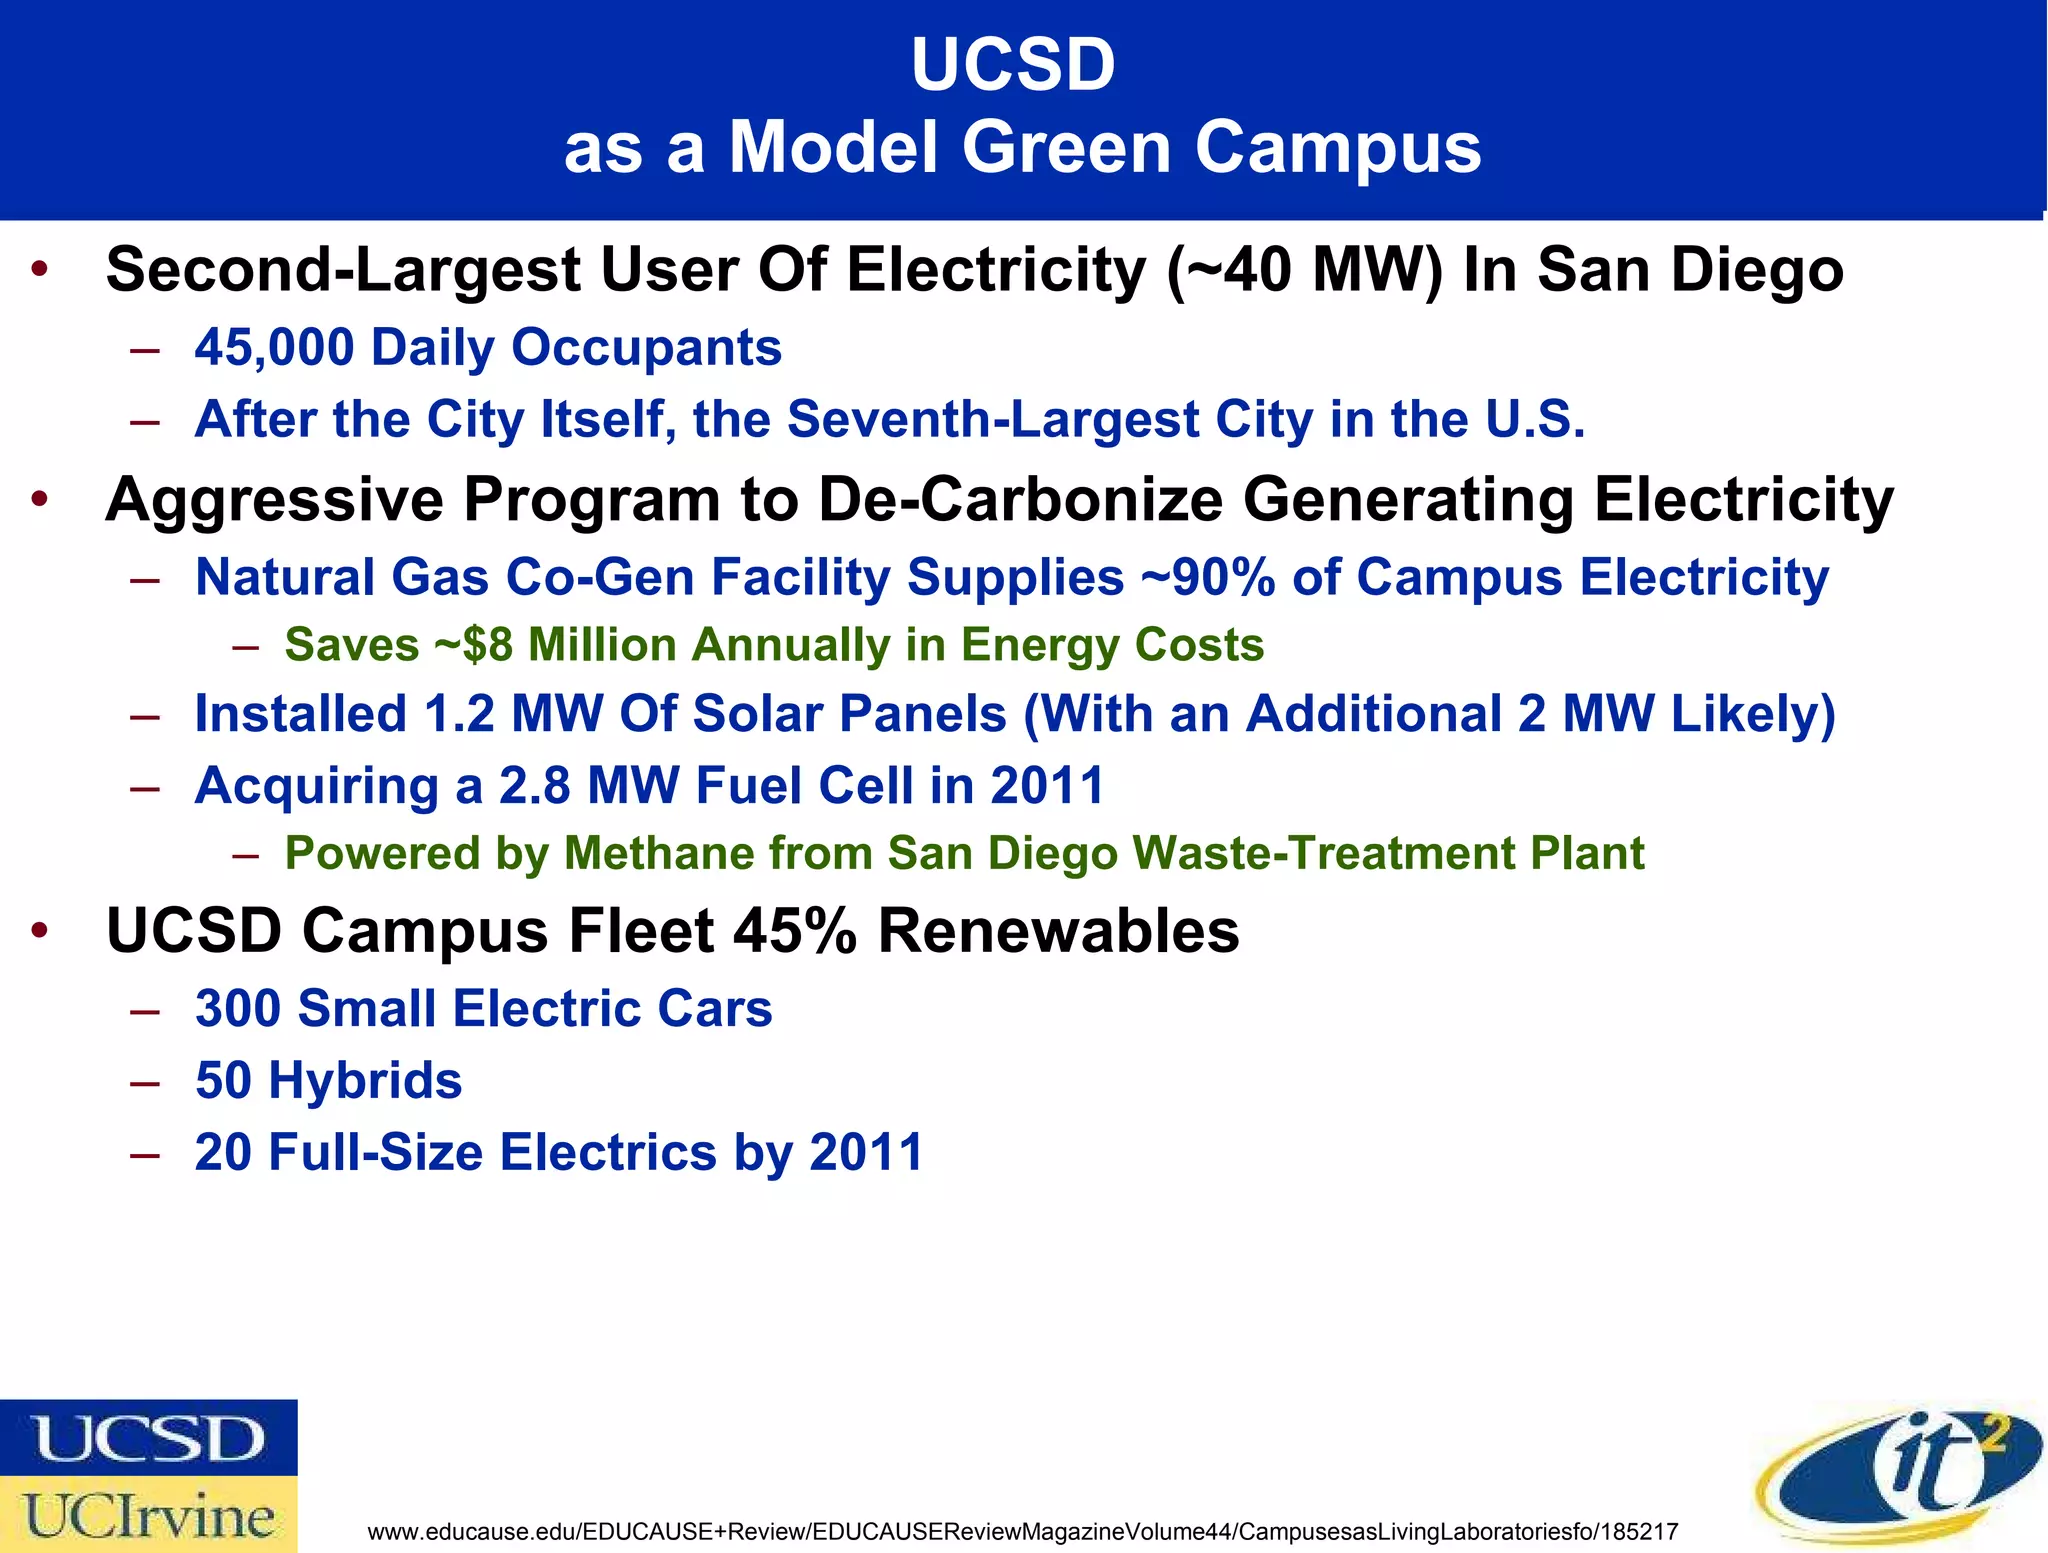
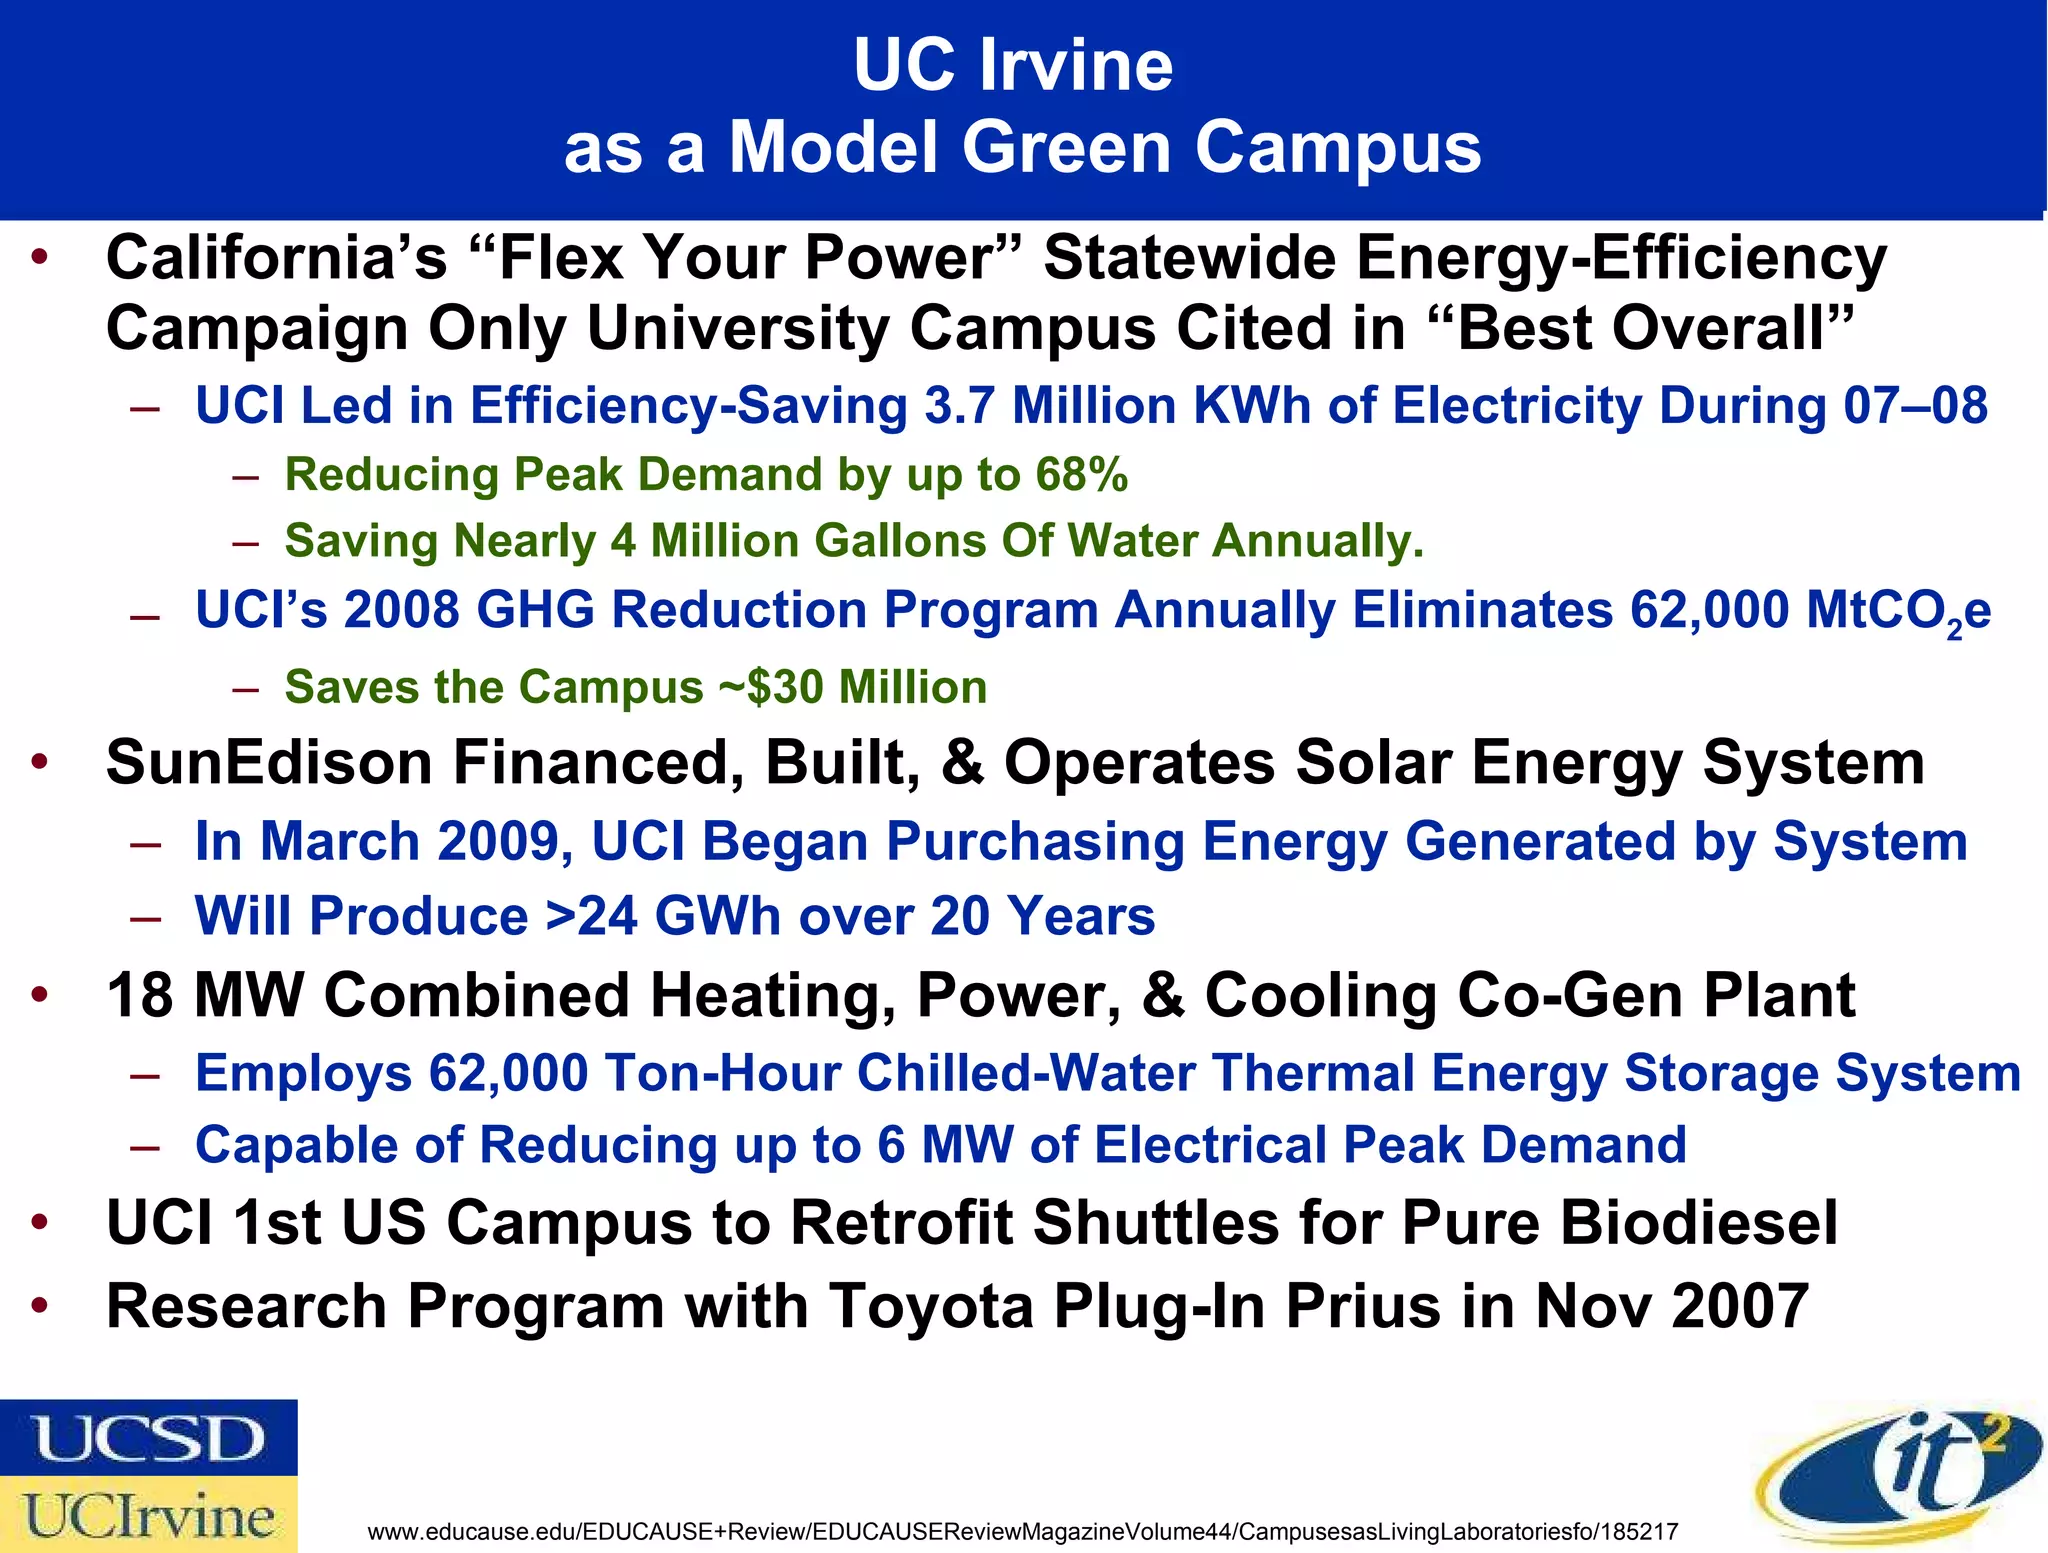
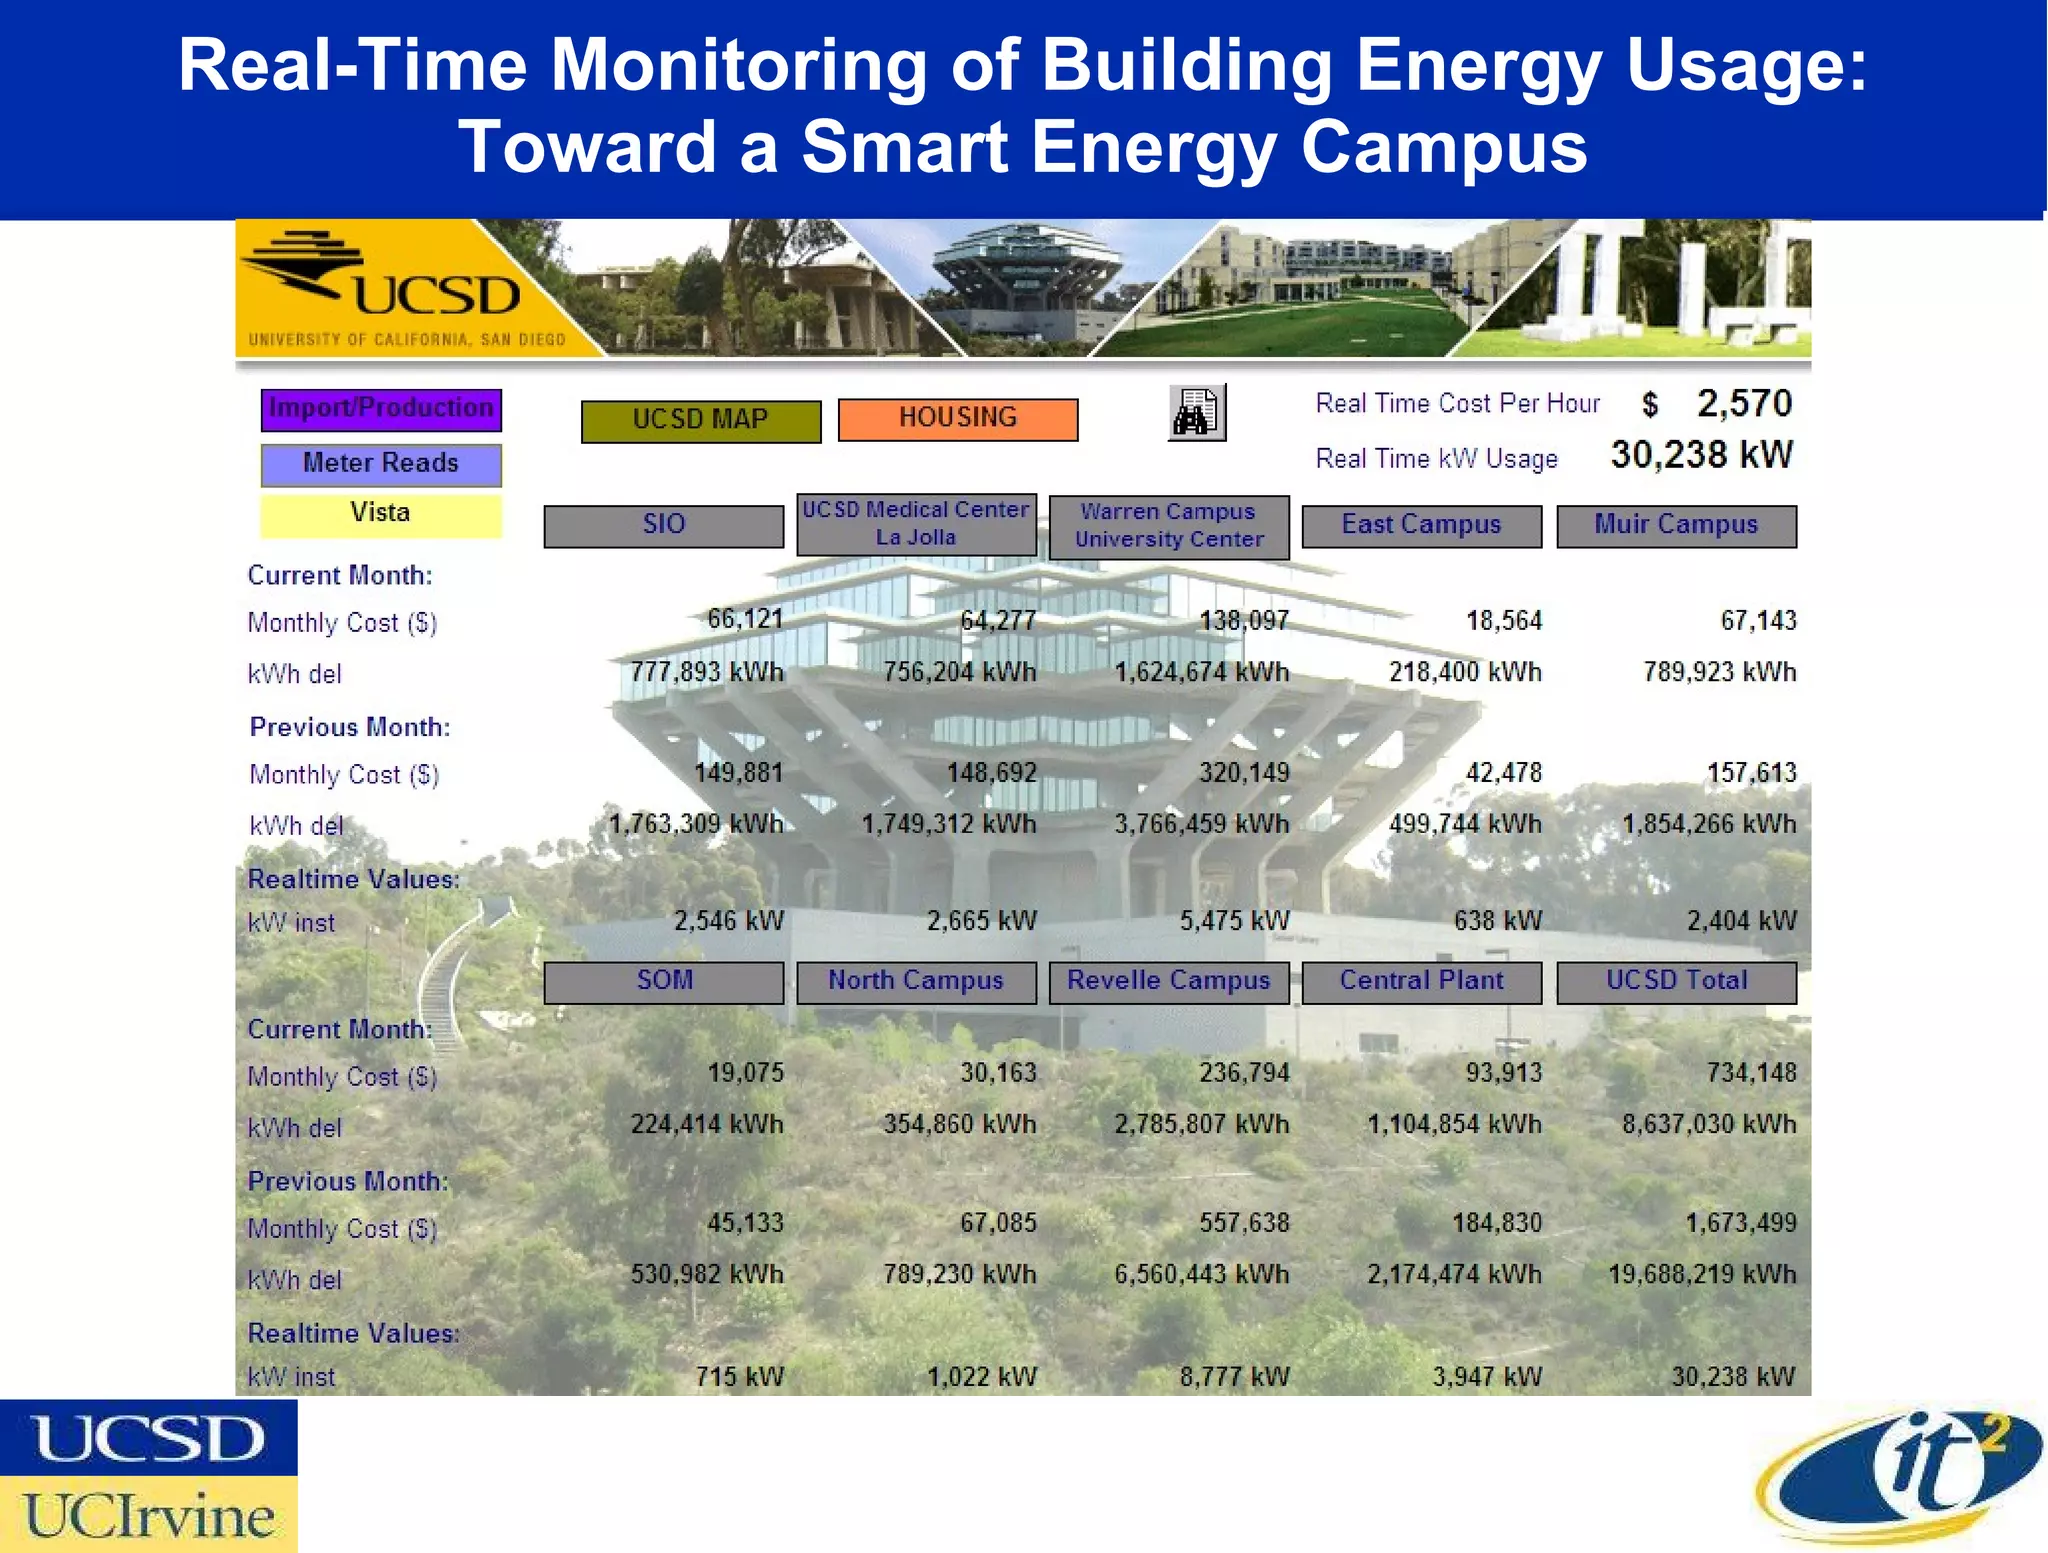
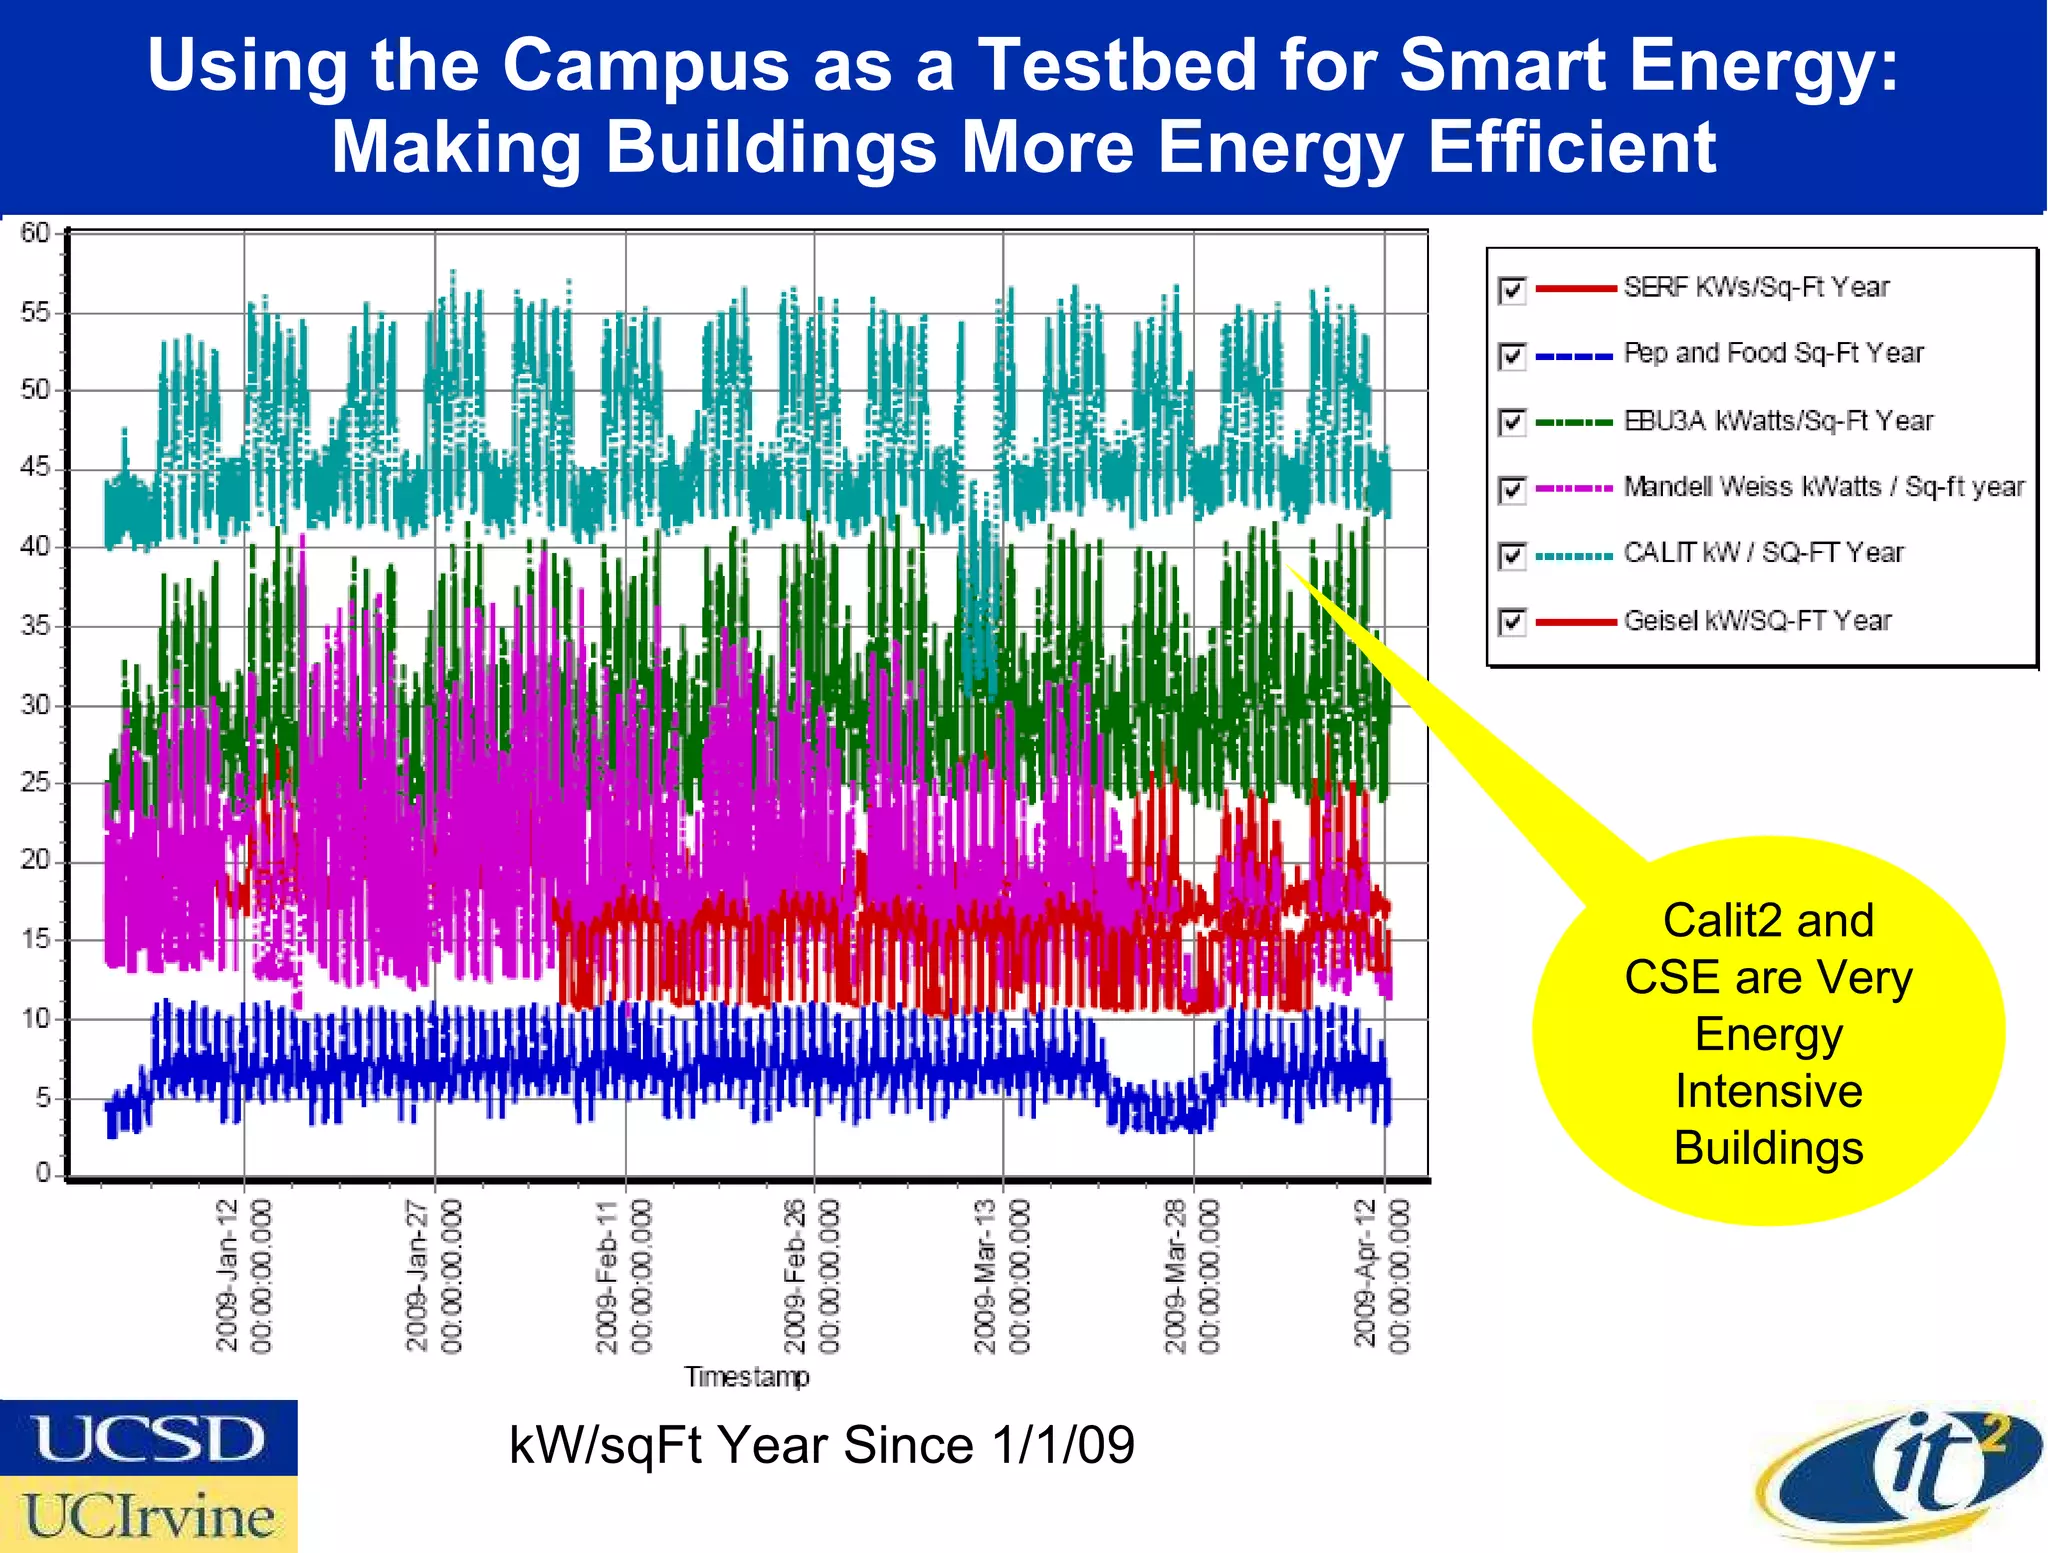
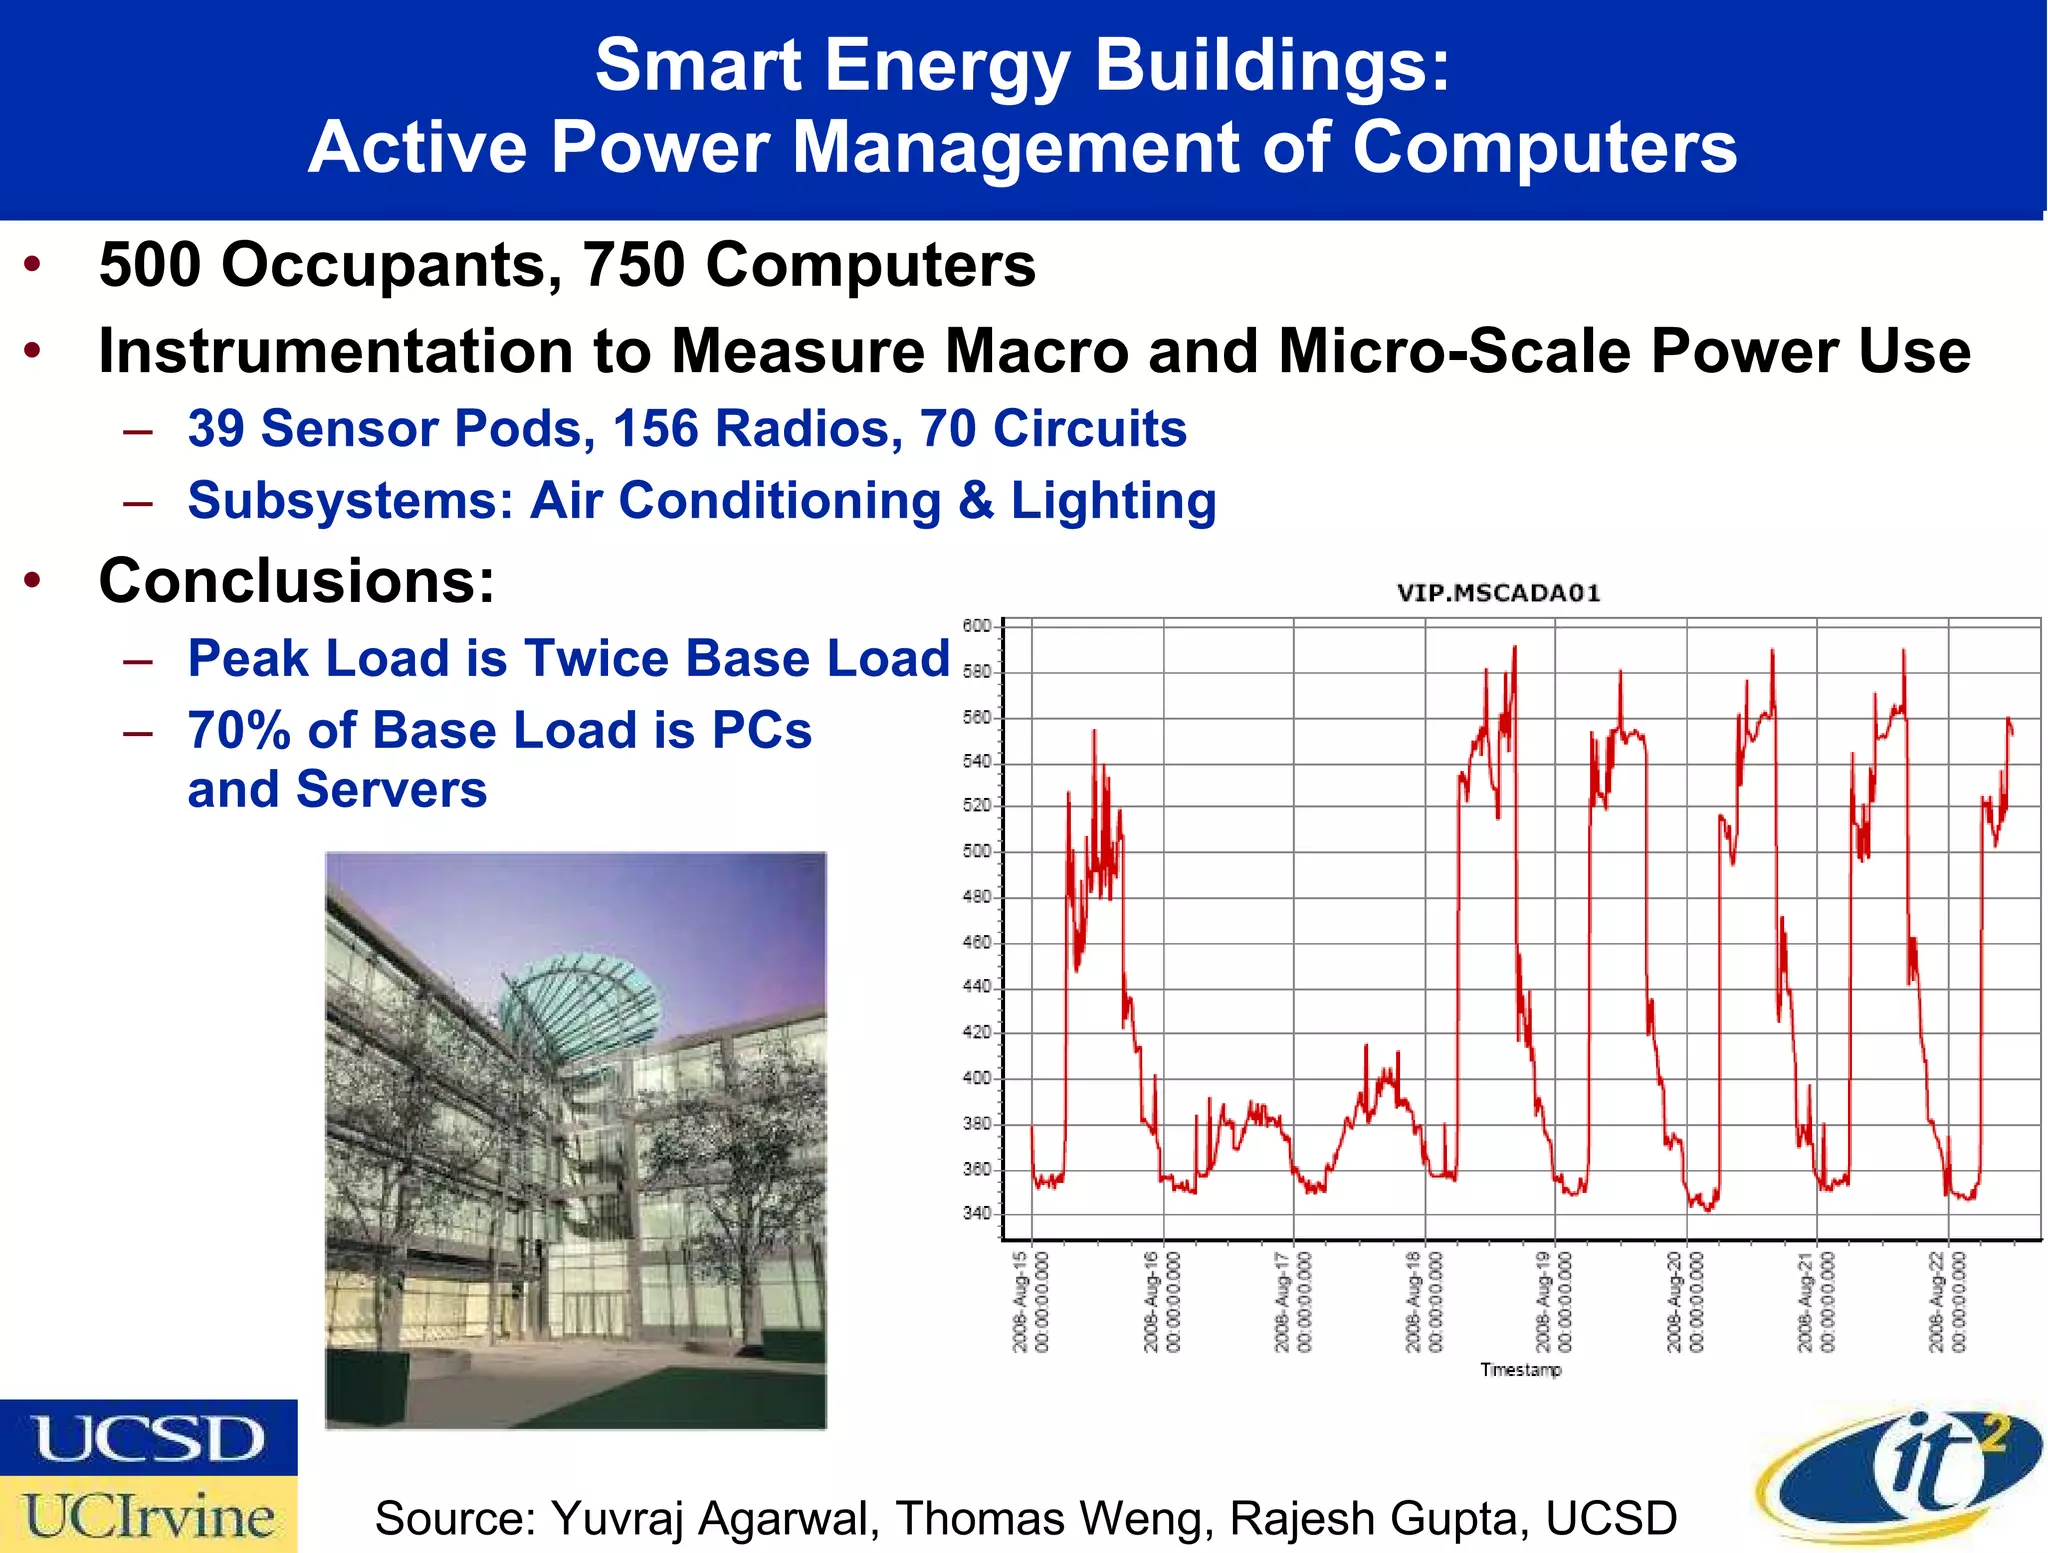
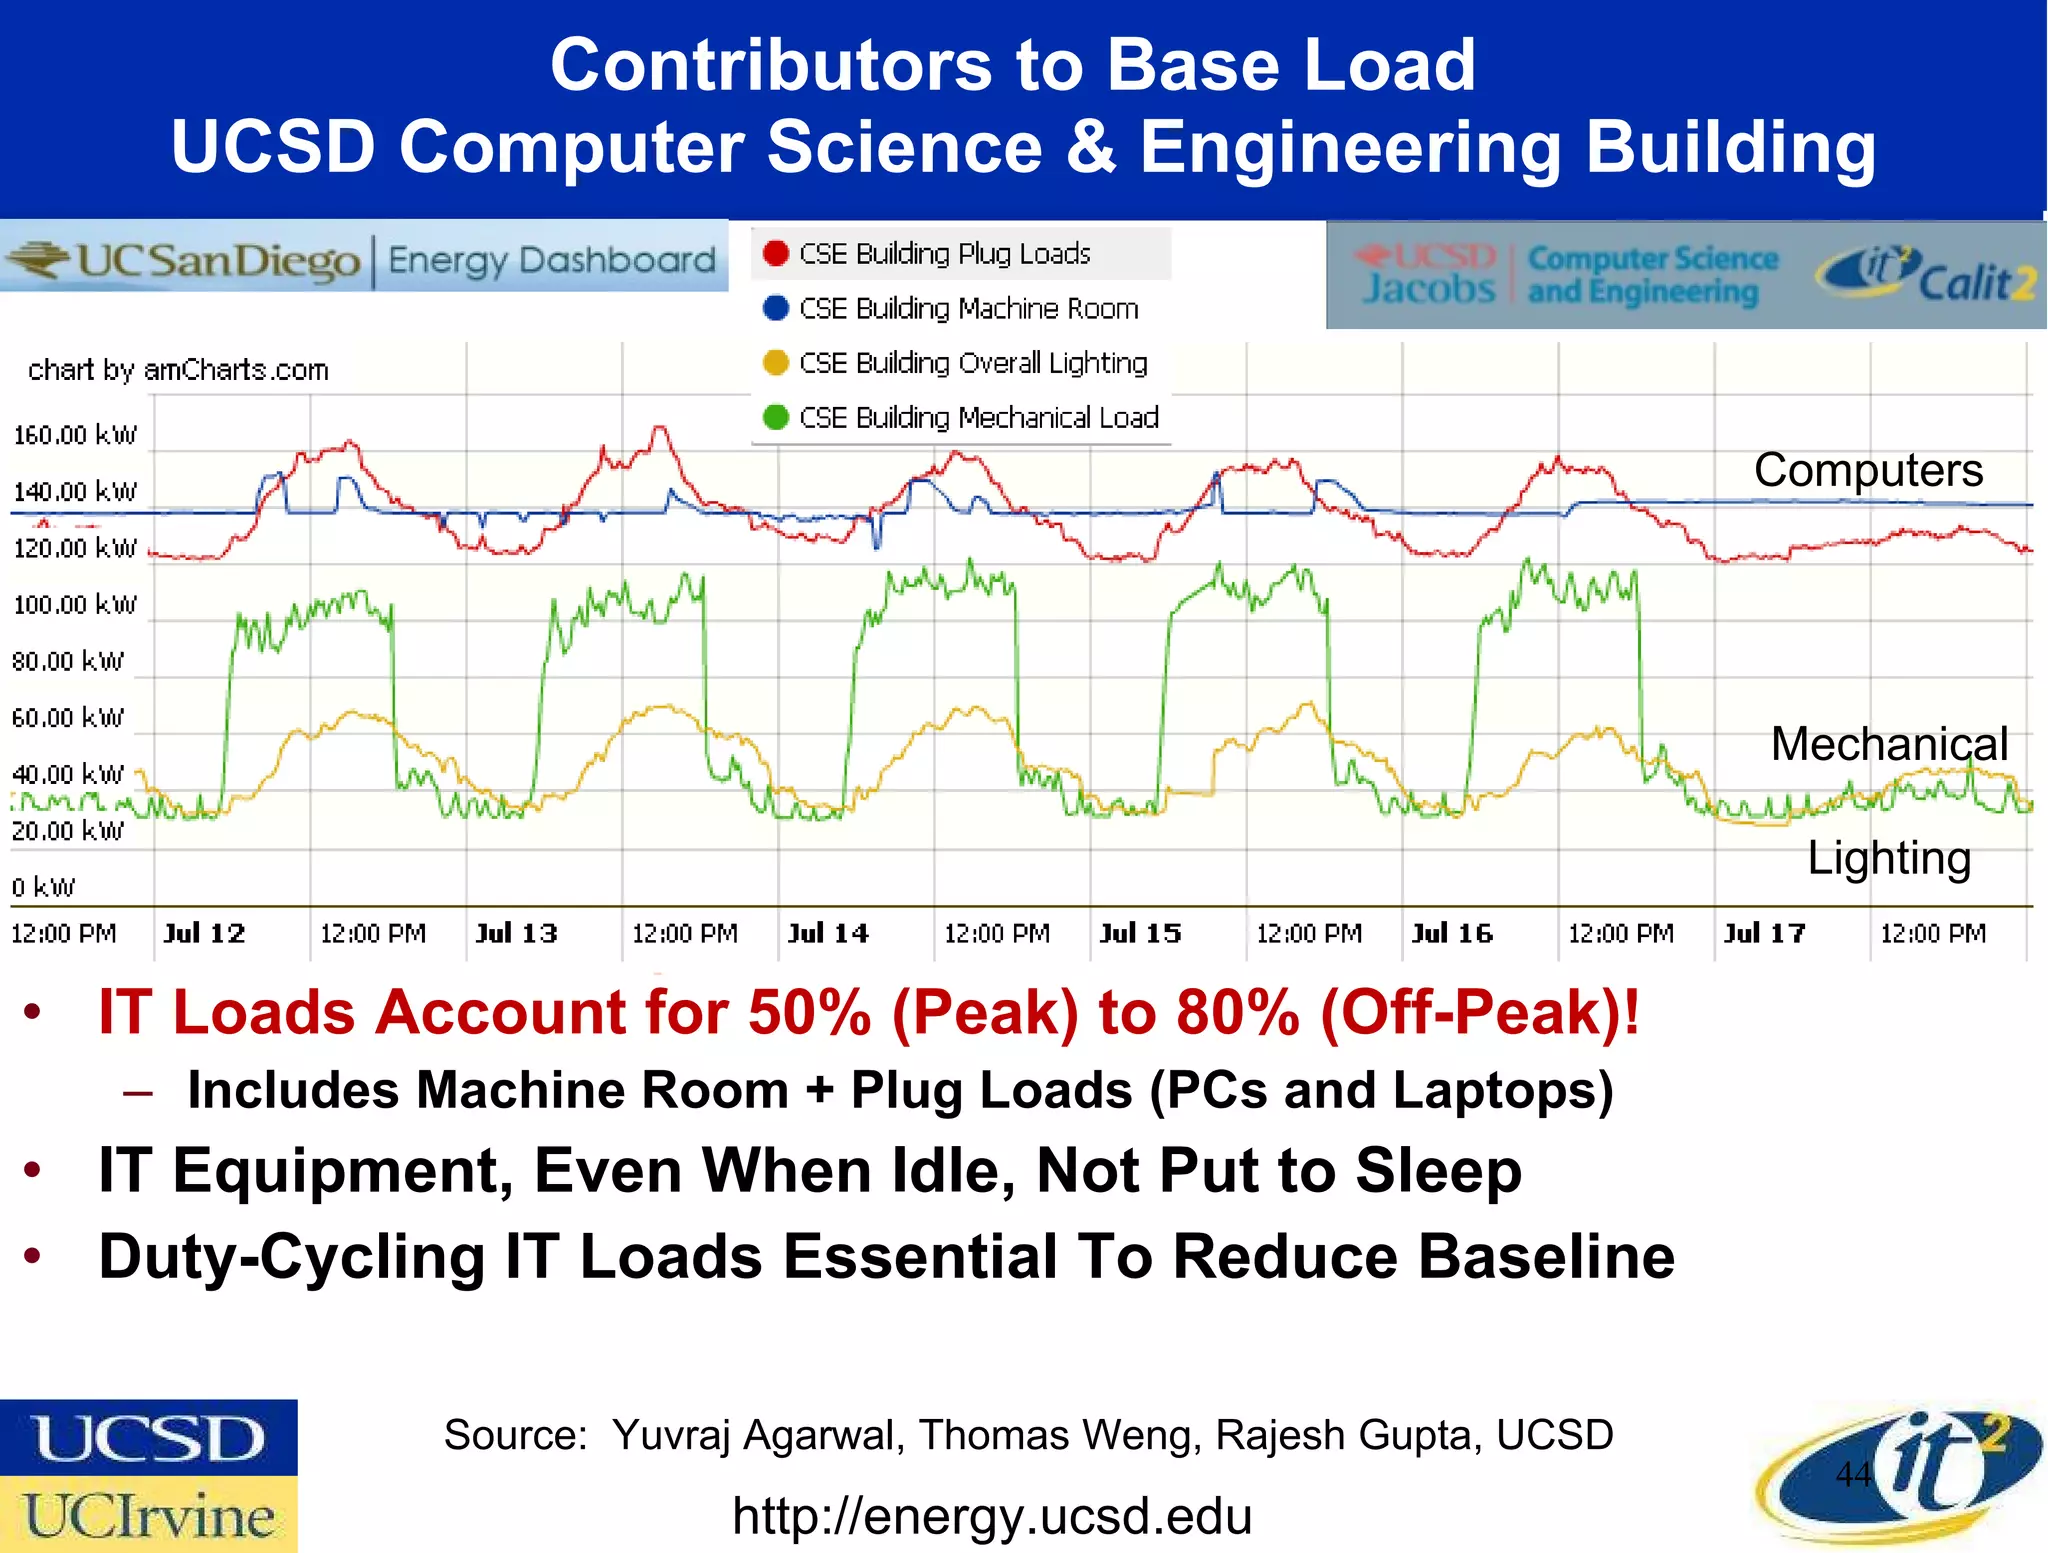
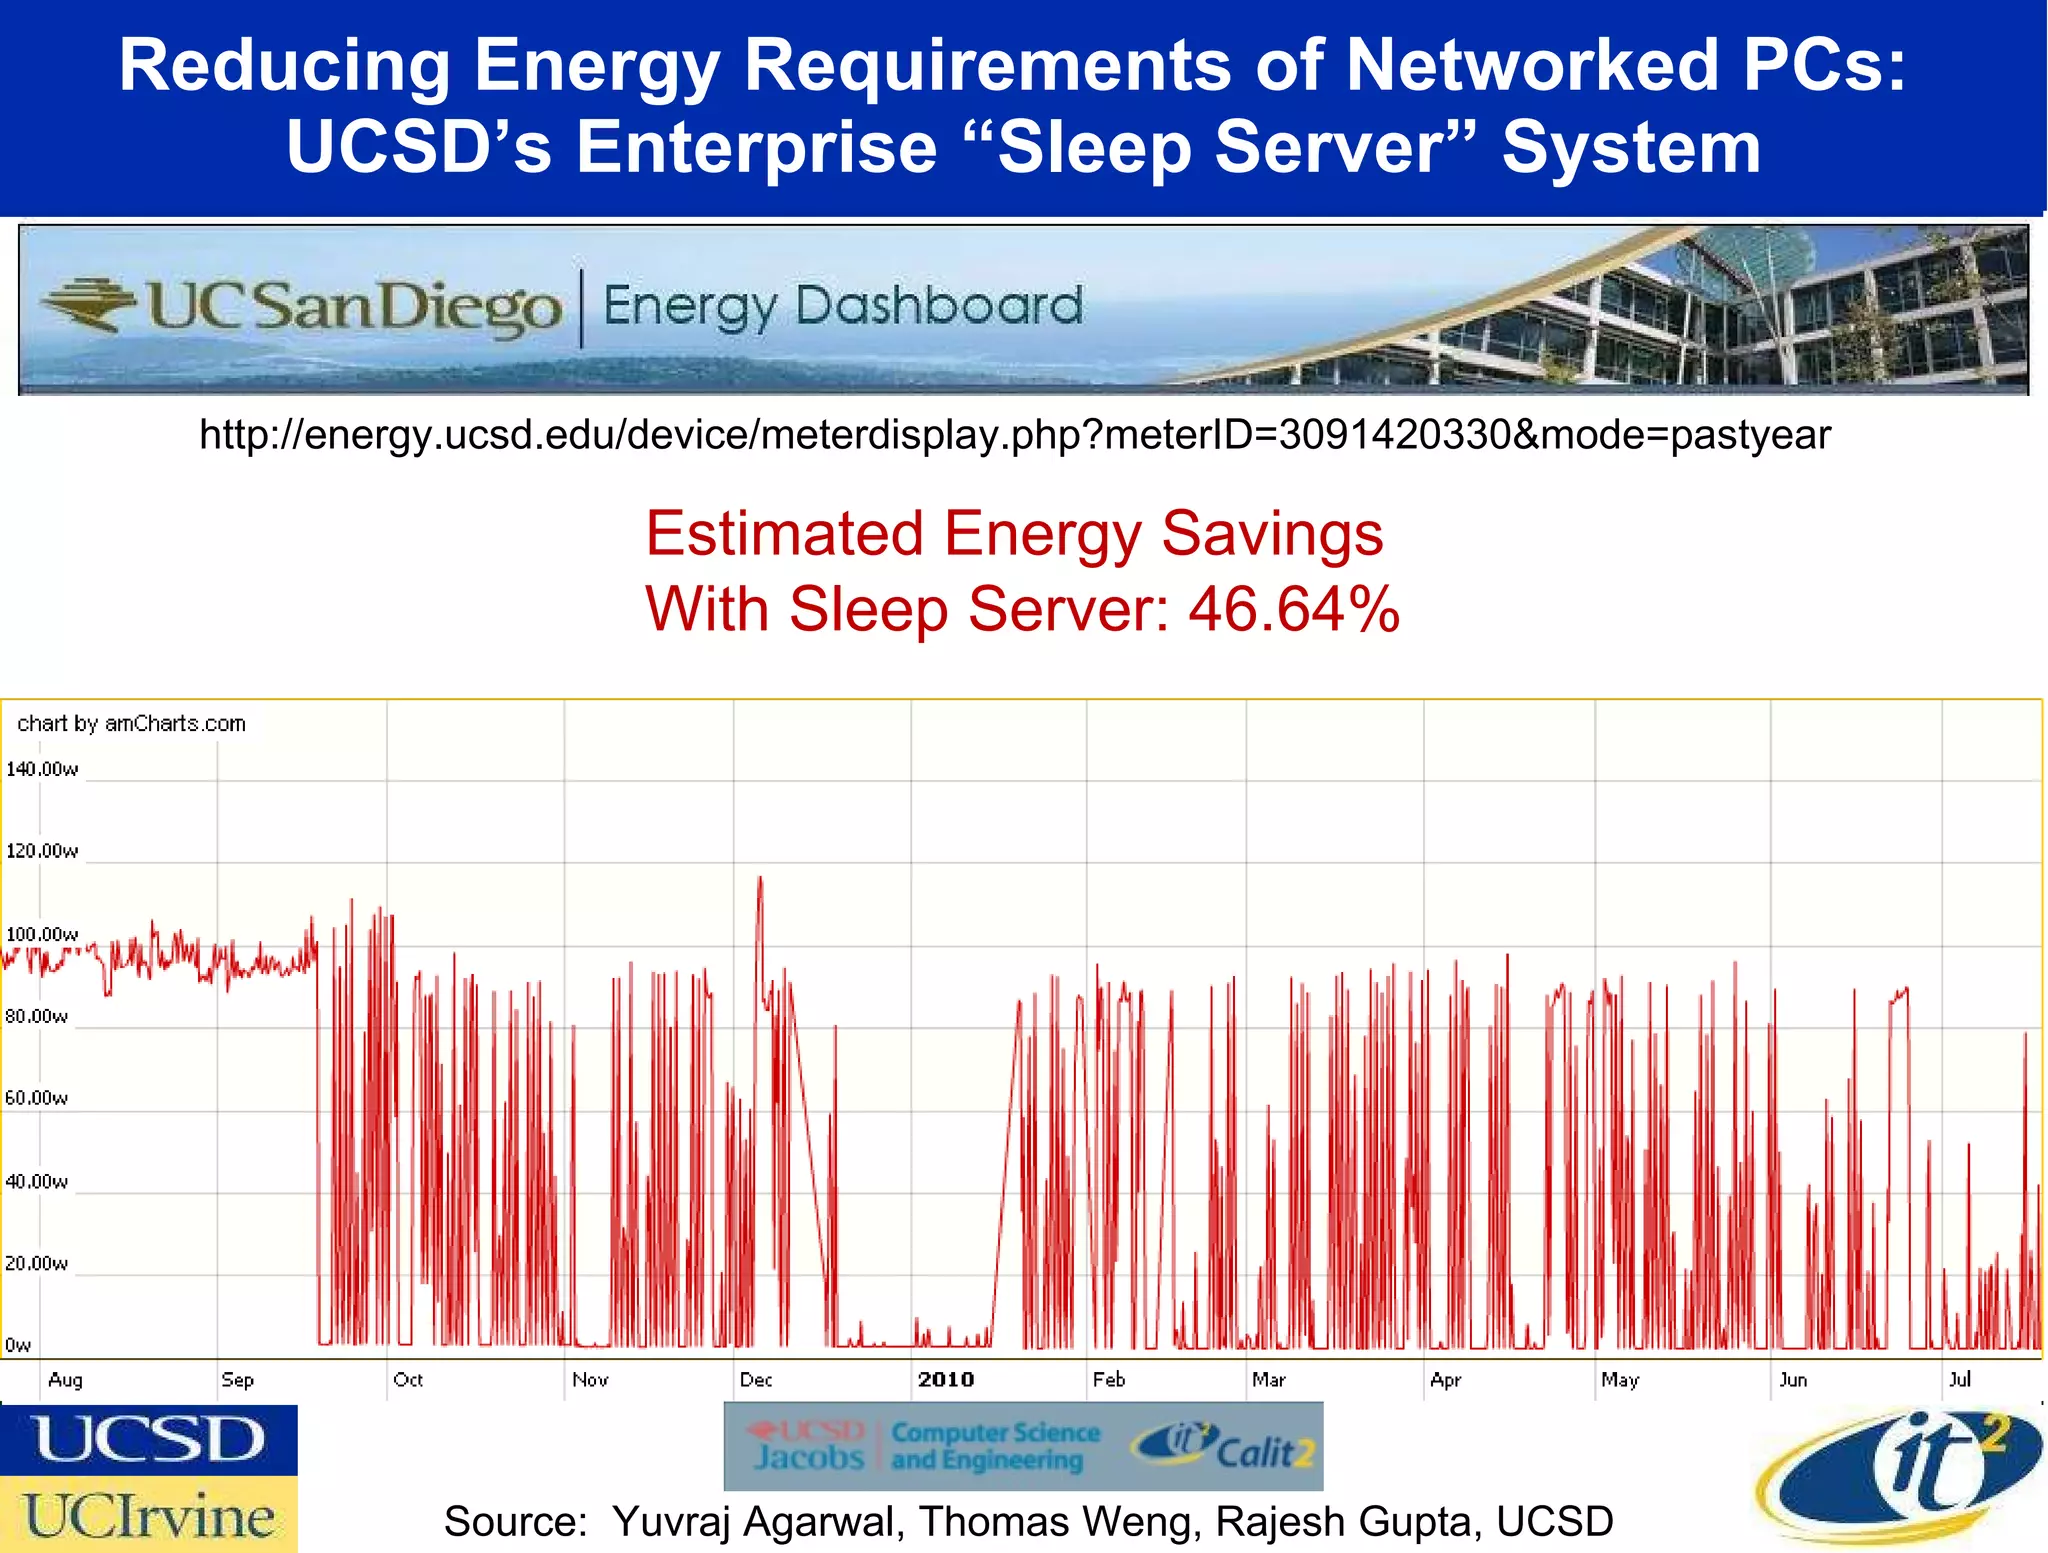
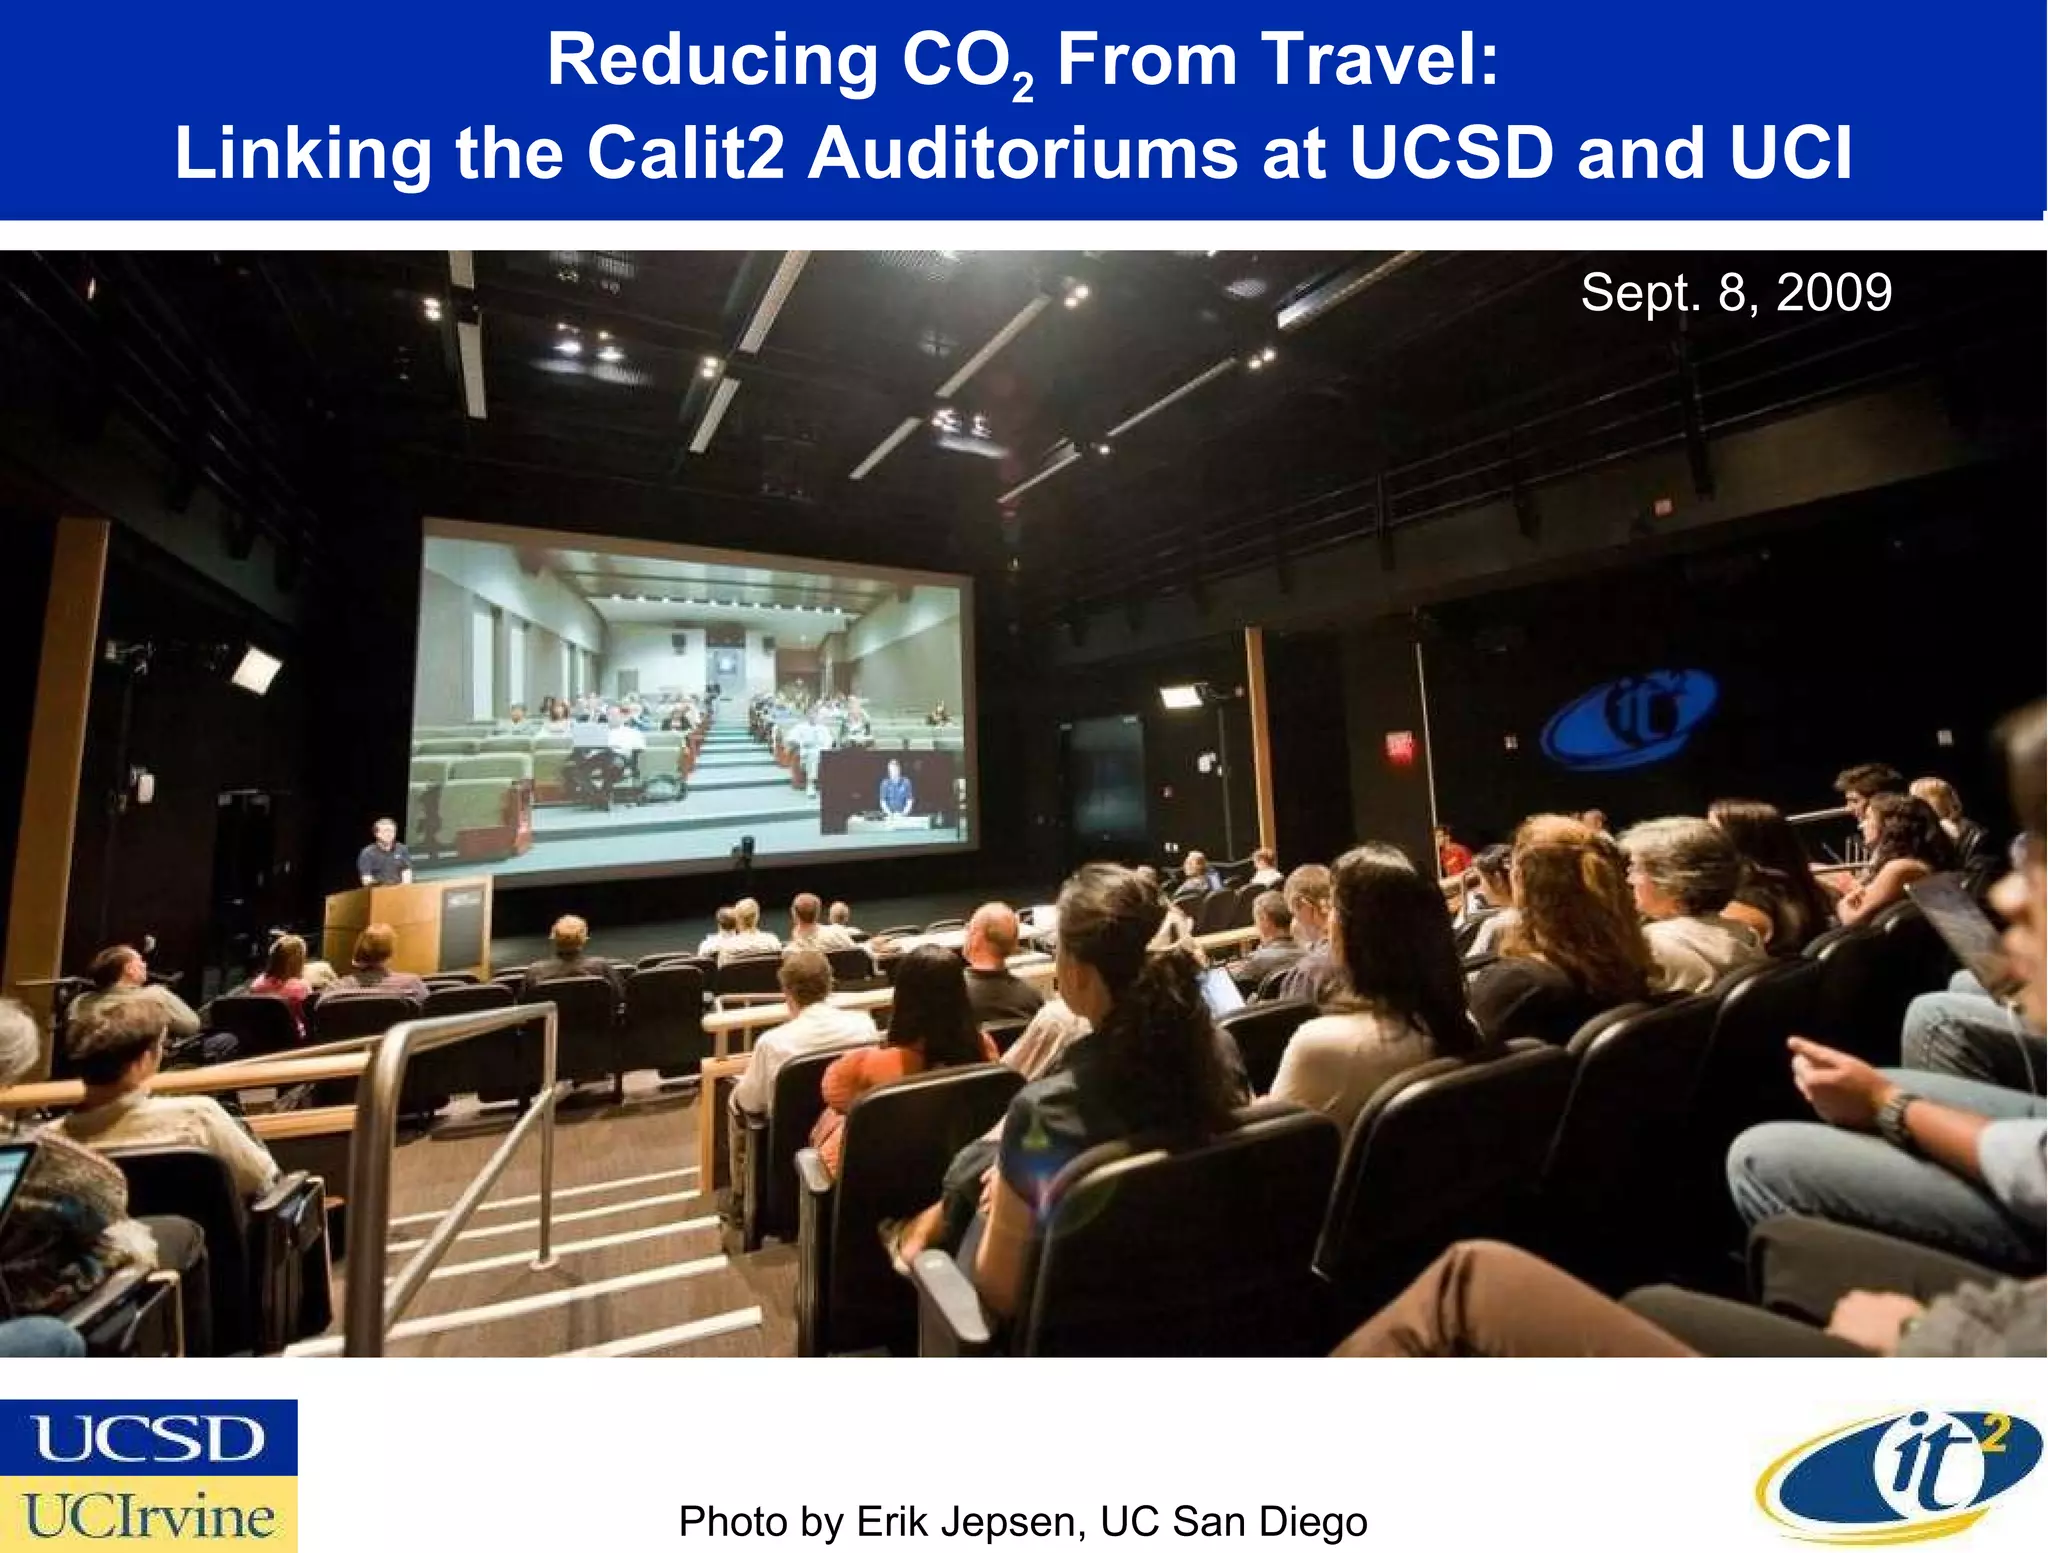
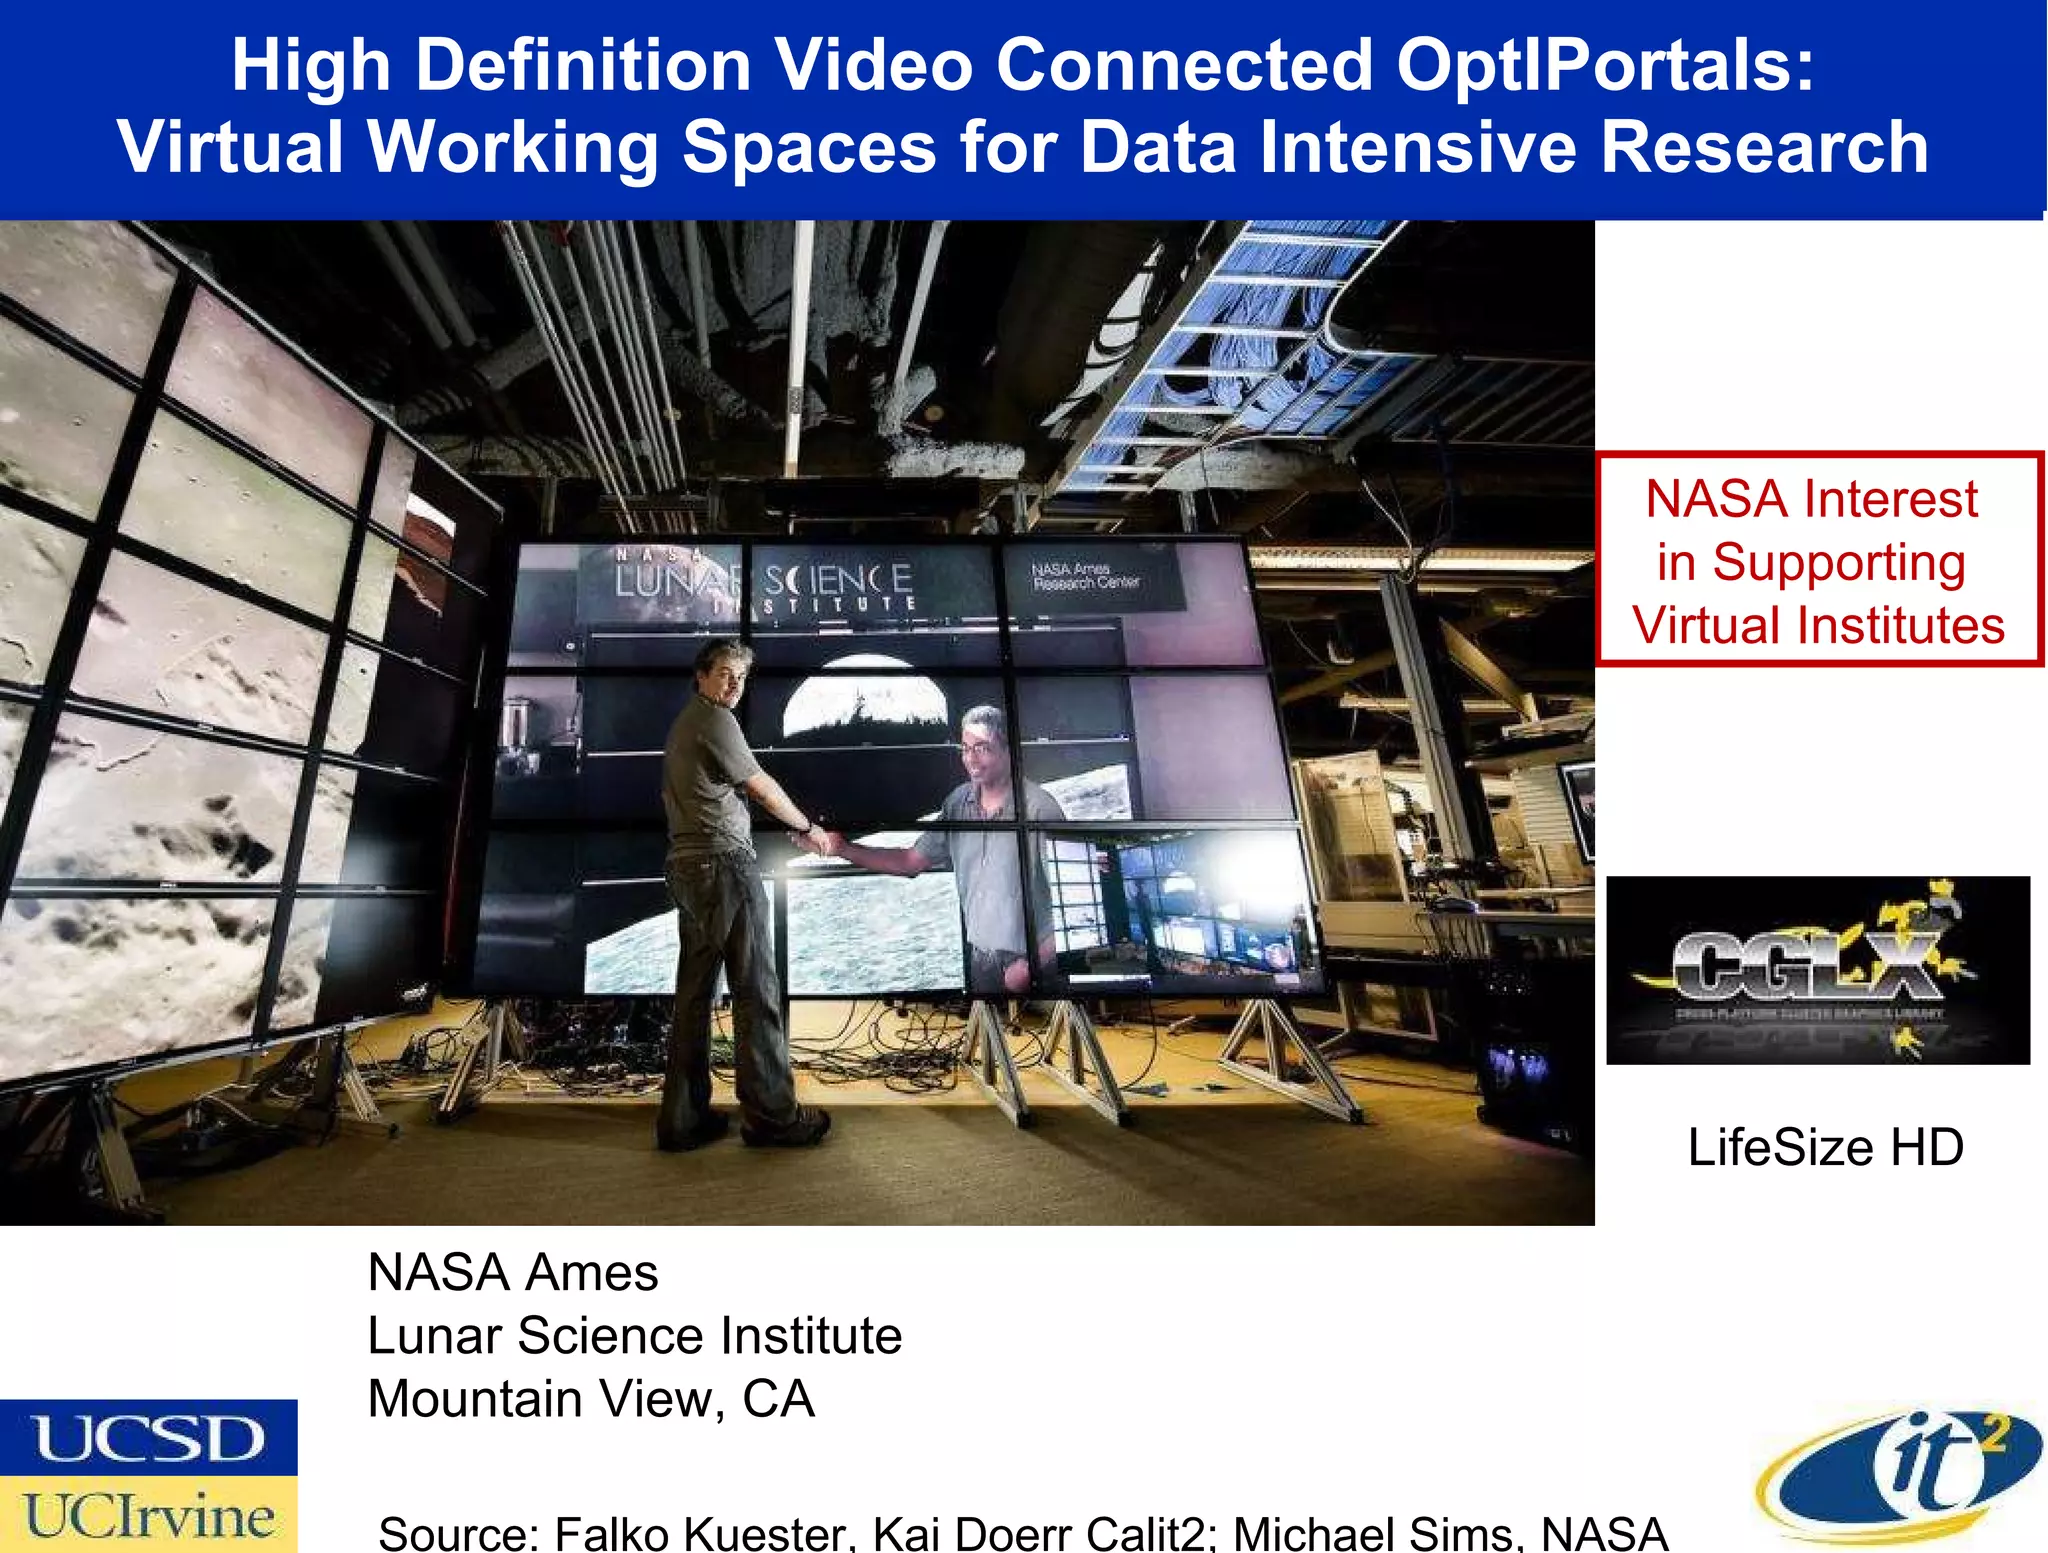
The seminar by Dr. Larry Smarr discusses the urgent need to reduce greenhouse gas emissions within the next decade to limit global warming to 2 degrees Celsius. It highlights the role of the information and communication technology (ICT) sector, which, while responsible for 2-3% of emissions, could enable a 15% reduction in global emissions through transformative applications. Projects at UC San Diego and UC Irvine showcase initiatives aimed at boosting energy efficiency and testing low-carbon technologies in a 'living laboratory' setting.


![Vibe Coding vs. Spec-Driven Development [Free Meetup]](https://cdn.slidesharecdn.com/ss_thumbnails/vibecodingvsspecdrivendevelopment-251209105622-43f455e7-thumbnail.jpg?width=640&height=640&fit=bounds)


