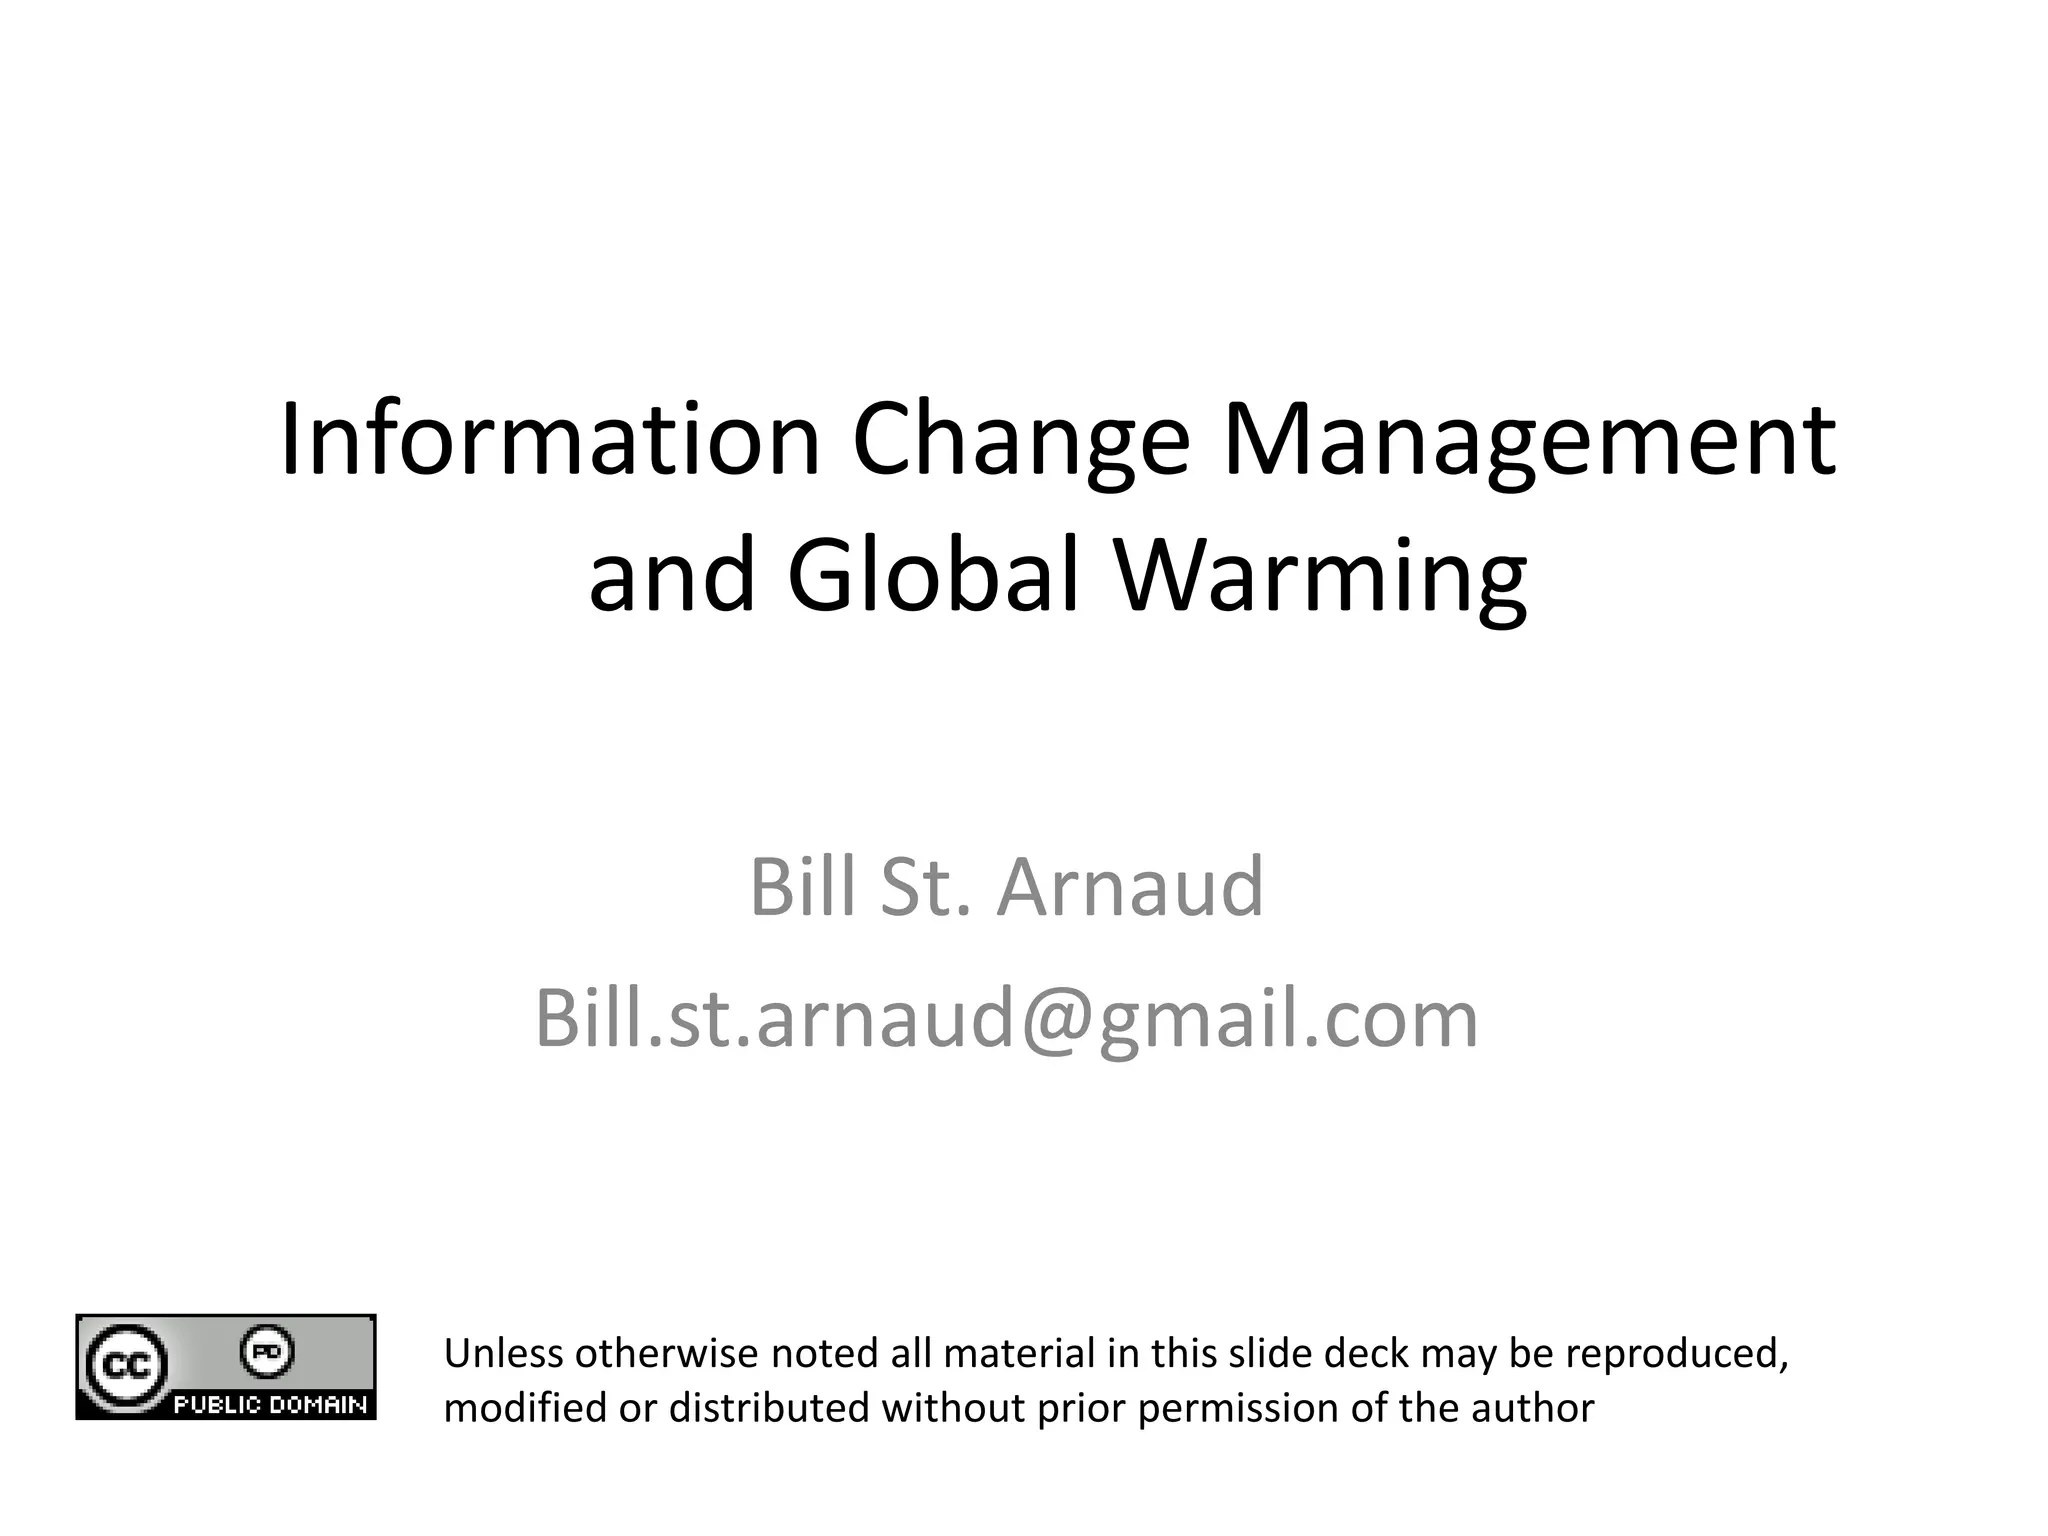
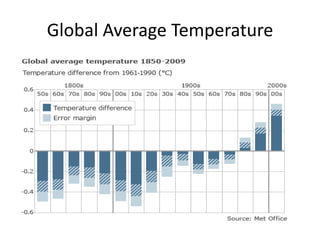
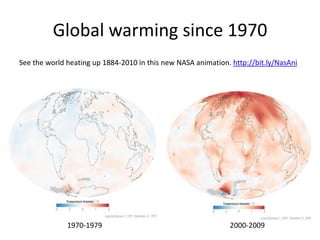
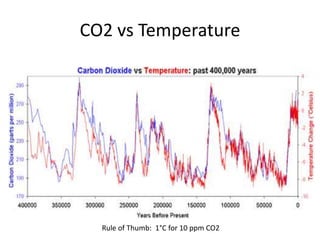
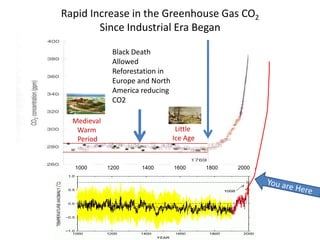
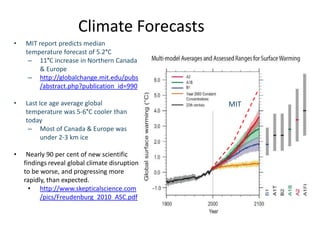
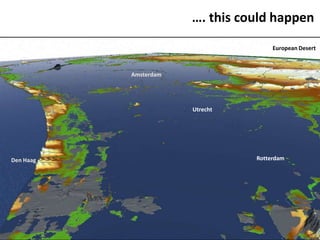
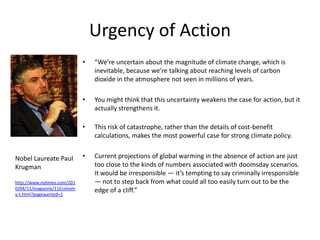
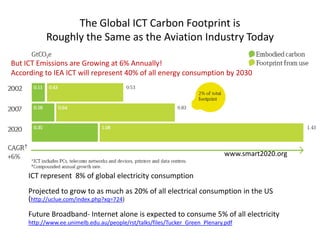
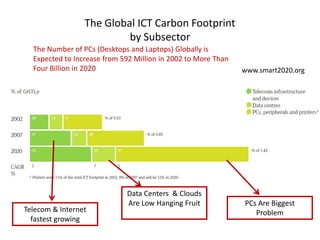
Information Change Management and Global Warming Bill St. ArnaudBill.st.arnaud@gmail.comUnless otherwise noted all material in this slide deck may be reproduced, modified or distributed without prior permission of the author
Global Average Temperature
2010 warmest year ever
Global warming since 1970See the world heating up 1884-2010 in this new NASA animation. http://bit.ly/NasAni1970-19792000-2009
CO2 vs TemperatureRule of Thumb:  1°C for 10 ppm CO2
Rapid Increase in the Greenhouse Gas CO2Since Industrial Era BeganBlack Death Allowed Reforestation in Europe and North America reducing CO2Medieval Warm PeriodLittle Ice Age200018001400160012001000You are Here
Climate ForecastsMIT report predicts median temperature forecast of 5.2°C
11°C increase in Northern Canada & Europe
http://globalchange.mit.edu/pubs/abstract.php?publication_id=990
Last Ice age average global temperature was 5-6°C cooler than today
Most of Canada & Europe was under 2-3 km ice
Nearly 90 per cent of new scientific findings reveal global climate disruption to be worse, and progressing more rapidly, than expected.
http://www.skepticalscience.com/pics/Freudenburg_2010_ASC.pdfMIT
Climate Change is not reversibleClimate Change is not like acid rain, water management or ozone destruction where environment will quickly return to normal once source of pollution is removedGHG emissions will stay in the atmosphere for thousands of years and continue to accumulatePlanet will continue to warm up even if we drastically reduce emissionsWeaver et al., GRL (2007)All we hope to achieve is to slow down the rapid rate of climate change
CO2 Residence Time
Climate tipping pointsUSGS report finds that future climate shifts have been underestimated and warns of debilitating  abrupt shift in climate that would be devastating. Tipping elements in the Earth's climate  - National Academies of Science“Society may be lulled into a false sense of security by smooth projections of global change. Our synthesis of present knowledge suggests that a variety of tipping elements could reach their critical point within this century under anthropogenic climate change. “
Future Droughts Palmer Drought Severity Index, or PDSI.
 The most severe drought in recent history, in the Sahel region of western Africa in the 1970s, had a PDSI of -3 or -4.
 By 2030 Western USA could see -4 to -6
 By 2100 some parts of the U.S. could see -8 to -10 PDSI, while Mediterranean areas could see drought in the -15 or -20 range.http://www.msnbc.msn.com/id/39741525/ns/us_news-environment/
Western Antarctic Ice Sheet (WAIS) Sits on land below sea level
 Can easily break up once sea water gets under ice
 Originally thought that breakup would take hundreds of years
 New evidence indicates that breakup will happen within 40 years when planet warms up 1C (we are already up .8C)
S ea levels would be 3.3m – 4.8m
Ice collapsed as recent as 125,000 years ago
IPCC says ice is one of the poorest understood areashttp://news.discovery.com/earth/how-stable-is-the-west-antarctic-ice-sheet.html
Ice sheets disappearing 100 years ahead of scheduleProjected Sea RiseIce sheets disappearing 100 years ahead of schedule http://climateprogress.org/2010/12/15/deep-ocean-heat-is-rapidly-melting-antarctic-ice-global-warmin/Sea levels may rise 3x faster than predicted by IPCChttp://climateprogress.org/2009/12/09/sea-level-rise-six-feet-three-times-faster-than-the-ipcc-estimat/
Dramatic changes in precipitationEvery continent has suffered record rainfalls
Rains submerged one-fifth of Pakistan, a thousand-year deluge swamped Nashville and storms just north of Rio caused the deadliest landslides Brazil has ever seen.
Observed increase in precipitation in the last few decades has been due in large part to a disproportionate increase in heavy and extreme precipitation rates which are exceeding predictions made in modelsIncreased flooding and major storms Severe consequences from global warming are starting nowThe worst is yet to comeFlooding and major storms are the bigger threat in the near term than sea levelsNetherlands, Bangladesh, etc are long overdue for major floods comparable to Pakistan or AustraliaAre you ready?
…. this could happenEuropean DesertVeluweAmsterdamUtrechtRotterdamDen Haag
Urgency of Action“We’re uncertain about the magnitude of climate change, which is inevitable, because we’re talking about reaching levels of carbon dioxide in the atmosphere not seen in millions of years. You might think that this uncertainty weakens the case for action, but it actually strengthens it. This risk of catastrophe, rather than the details of cost-benefit calculations, makes the most powerful case for strong climate policy. Current projections of global warming in the absence of action are just too close to the kinds of numbers associated with doomsday scenarios. It would be irresponsible — it’s tempting to say criminally irresponsible — not to step back from what could all too easily turn out to be the edge of a cliff.”Nobel Laureate Paul Krugmanhttp://www.nytimes.com/2010/04/11/magazine/11Economy-t.html?pagewanted=1
The Global ICT Carbon Footprint isRoughly the Same as the Aviation Industry TodayBut ICT Emissions are Growing at 6% Annually!According to IEA ICT will represent 40% of all energy consumption by 2030www.smart2020.orgICT represent  8% of global electricity consumptionProjected to grow to as much as 20% of all electrical consumption in the US  (http://uclue.com/index.php?xq=724)Future Broadband- Internet alone is expected to consume 5% of all electricity http://www.ee.unimelb.edu.au/people/rst/talks/files/Tucker_Green_Plenary.pdf

Green it overview jan 6 2011

  • 1.
    Information Change Managementand Global Warming Bill St. ArnaudBill.st.arnaud@gmail.comUnless otherwise noted all material in this slide deck may be reproduced, modified or distributed without prior permission of the author
  • 3.
  • 4.
  • 5.
    Global warming since1970See the world heating up 1884-2010 in this new NASA animation. http://bit.ly/NasAni1970-19792000-2009
  • 6.
    CO2 vs TemperatureRuleof Thumb: 1°C for 10 ppm CO2
  • 7.
    Rapid Increase inthe Greenhouse Gas CO2Since Industrial Era BeganBlack Death Allowed Reforestation in Europe and North America reducing CO2Medieval Warm PeriodLittle Ice Age200018001400160012001000You are Here
  • 8.
    Climate ForecastsMIT reportpredicts median temperature forecast of 5.2°C
  • 9.
    11°C increase inNorthern Canada & Europe
  • 10.
  • 11.
    Last Ice ageaverage global temperature was 5-6°C cooler than today
  • 12.
    Most of Canada& Europe was under 2-3 km ice
  • 13.
    Nearly 90 percent of new scientific findings reveal global climate disruption to be worse, and progressing more rapidly, than expected.
  • 14.
  • 15.
    Climate Change isnot reversibleClimate Change is not like acid rain, water management or ozone destruction where environment will quickly return to normal once source of pollution is removedGHG emissions will stay in the atmosphere for thousands of years and continue to accumulatePlanet will continue to warm up even if we drastically reduce emissionsWeaver et al., GRL (2007)All we hope to achieve is to slow down the rapid rate of climate change
  • 16.
  • 17.
    Climate tipping pointsUSGSreport finds that future climate shifts have been underestimated and warns of debilitating abrupt shift in climate that would be devastating. Tipping elements in the Earth's climate - National Academies of Science“Society may be lulled into a false sense of security by smooth projections of global change. Our synthesis of present knowledge suggests that a variety of tipping elements could reach their critical point within this century under anthropogenic climate change. “
  • 18.
    Future Droughts PalmerDrought Severity Index, or PDSI.
  • 19.
    The mostsevere drought in recent history, in the Sahel region of western Africa in the 1970s, had a PDSI of -3 or -4.
  • 20.
    By 2030Western USA could see -4 to -6
  • 21.
    By 2100some parts of the U.S. could see -8 to -10 PDSI, while Mediterranean areas could see drought in the -15 or -20 range.http://www.msnbc.msn.com/id/39741525/ns/us_news-environment/
  • 22.
    Western Antarctic IceSheet (WAIS) Sits on land below sea level
  • 23.
    Can easilybreak up once sea water gets under ice
  • 24.
    Originally thoughtthat breakup would take hundreds of years
  • 25.
    New evidenceindicates that breakup will happen within 40 years when planet warms up 1C (we are already up .8C)
  • 26.
    S ea levelswould be 3.3m – 4.8m
  • 27.
    Ice collapsed asrecent as 125,000 years ago
  • 28.
    IPCC says iceis one of the poorest understood areashttp://news.discovery.com/earth/how-stable-is-the-west-antarctic-ice-sheet.html
  • 29.
    Ice sheets disappearing100 years ahead of scheduleProjected Sea RiseIce sheets disappearing 100 years ahead of schedule http://climateprogress.org/2010/12/15/deep-ocean-heat-is-rapidly-melting-antarctic-ice-global-warmin/Sea levels may rise 3x faster than predicted by IPCChttp://climateprogress.org/2009/12/09/sea-level-rise-six-feet-three-times-faster-than-the-ipcc-estimat/
  • 30.
    Dramatic changes inprecipitationEvery continent has suffered record rainfalls
  • 31.
    Rains submerged one-fifthof Pakistan, a thousand-year deluge swamped Nashville and storms just north of Rio caused the deadliest landslides Brazil has ever seen.
  • 32.
    Observed increase inprecipitation in the last few decades has been due in large part to a disproportionate increase in heavy and extreme precipitation rates which are exceeding predictions made in modelsIncreased flooding and major storms Severe consequences from global warming are starting nowThe worst is yet to comeFlooding and major storms are the bigger threat in the near term than sea levelsNetherlands, Bangladesh, etc are long overdue for major floods comparable to Pakistan or AustraliaAre you ready?
  • 33.
    …. this couldhappenEuropean DesertVeluweAmsterdamUtrechtRotterdamDen Haag
  • 34.
    Urgency of Action“We’reuncertain about the magnitude of climate change, which is inevitable, because we’re talking about reaching levels of carbon dioxide in the atmosphere not seen in millions of years. You might think that this uncertainty weakens the case for action, but it actually strengthens it. This risk of catastrophe, rather than the details of cost-benefit calculations, makes the most powerful case for strong climate policy. Current projections of global warming in the absence of action are just too close to the kinds of numbers associated with doomsday scenarios. It would be irresponsible — it’s tempting to say criminally irresponsible — not to step back from what could all too easily turn out to be the edge of a cliff.”Nobel Laureate Paul Krugmanhttp://www.nytimes.com/2010/04/11/magazine/11Economy-t.html?pagewanted=1
  • 35.
    The Global ICTCarbon Footprint isRoughly the Same as the Aviation Industry TodayBut ICT Emissions are Growing at 6% Annually!According to IEA ICT will represent 40% of all energy consumption by 2030www.smart2020.orgICT represent 8% of global electricity consumptionProjected to grow to as much as 20% of all electrical consumption in the US (http://uclue.com/index.php?xq=724)Future Broadband- Internet alone is expected to consume 5% of all electricity http://www.ee.unimelb.edu.au/people/rst/talks/files/Tucker_Green_Plenary.pdf

Editor's Notes

  • #30 Building a zero carbon ICT infrastructurePurchasing green power locally is expensive with significant transmission line lossesDemand for green power within cities expected to grow dramaticallyICT facilities DON’T NEED TO BE LOCATED IN CITIES-Cooling also a major problem in citiesBut most renewable energy sites are very remote and impractical to connect to electrical grid. Can be easily reached by an optical network Provide independence from electrical utility and high costs in wheeling power Savings in transmission line losses (up to 15%) alone, plus carbon offsets can pay for moving ICT facilities to renewable energy siteICT is only industry ideally suited to relocate to renewable energy sites Also ideal for business continuity in event of climate catastrophe